84337 Investment Properties for Sale
Browse homes for sale and investment properties in 84337. Refine your search by price, property type, or more.
Best cash flowing properties in 84337
Active
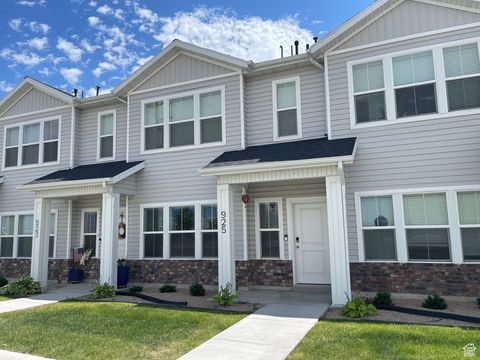
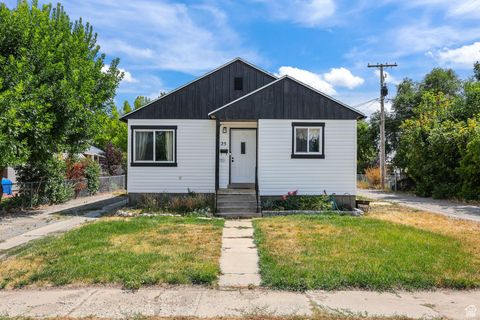
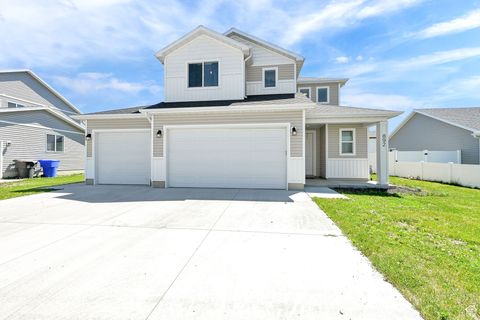
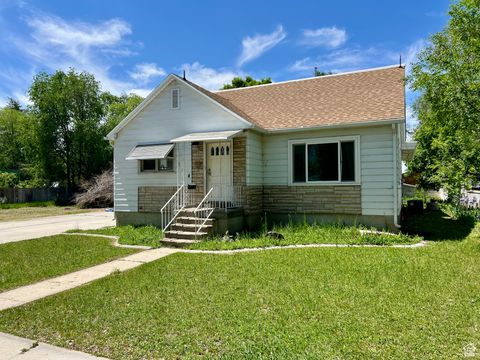
$290,000
3
bds
|
3
ba
|
1,476
sqft
|
built
2021
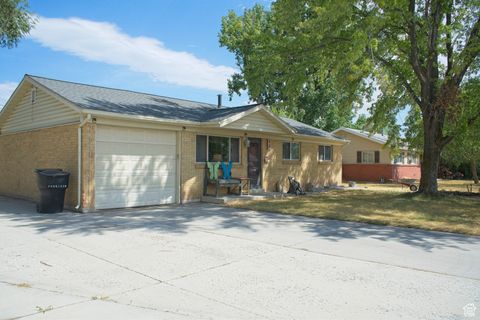
925 W 1000 N, Tremonton, UT 84337
$-253
Cash flow
-4.6%
Cash-on-Cash Return
4.6%
Cap rate
0.7%
Rent to Value Ratio
Active
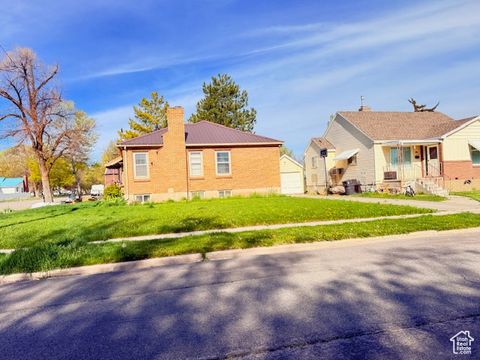
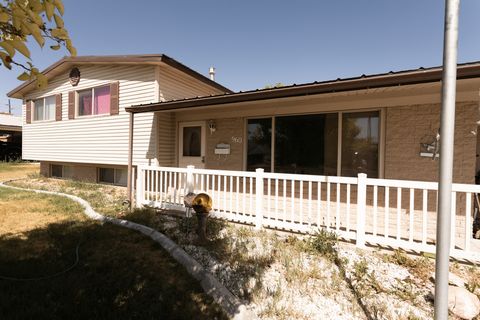
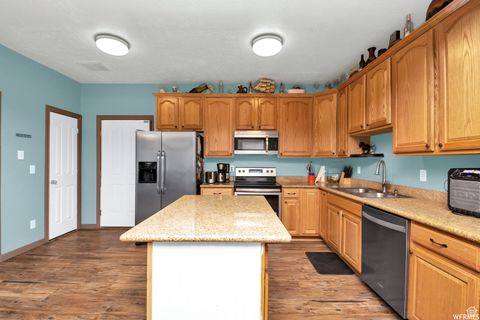
$344,900
3
bds
|
3
ba
|
2,694
sqft
|
built
1942
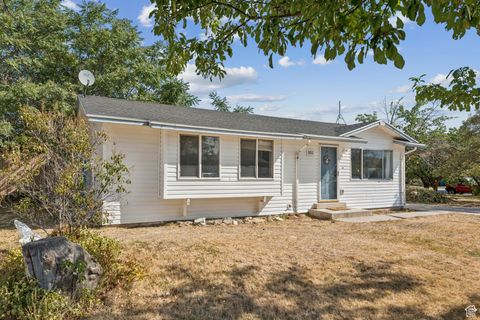
155 E 300 N, Tremonton, UT 84337
$-375
Cash flow
-5.7%
Cash-on-Cash Return
4.4%
Cap rate
0.6%
Rent to Value Ratio
34 out of 41 properties for sale in 84337
Limited Results Shown
Create a free account, or log in to reveal all property listings and enjoy the complete experience.
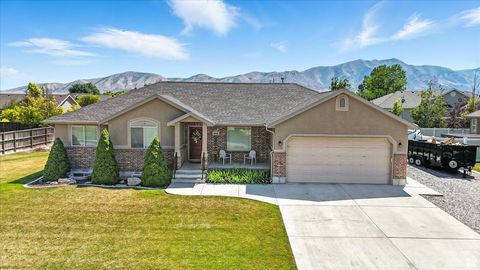
Active
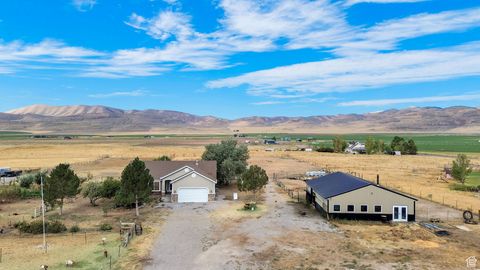
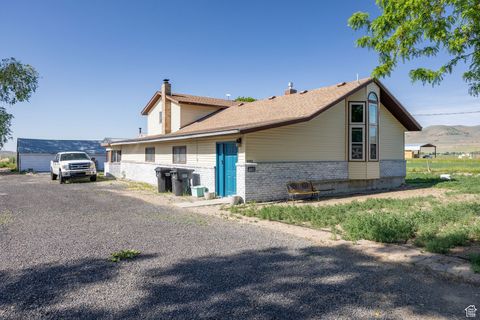
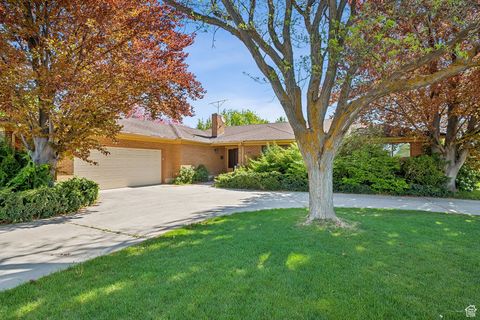
$794,000
4
bds
|
3
ba
|
2,988
sqft
|
built
2000
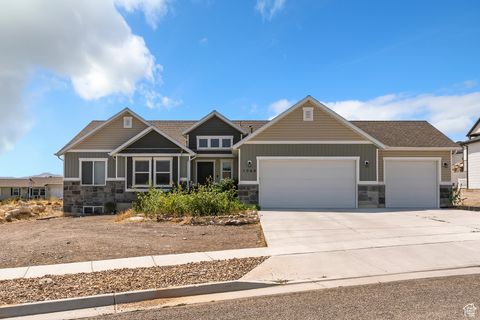
13585 N 10000 W, Tremonton, UT 84337
$-2,635
Cash flow
-17.3%
Cash-on-Cash Return
1.7%
Cap rate
0.3%
Rent to Value Ratio
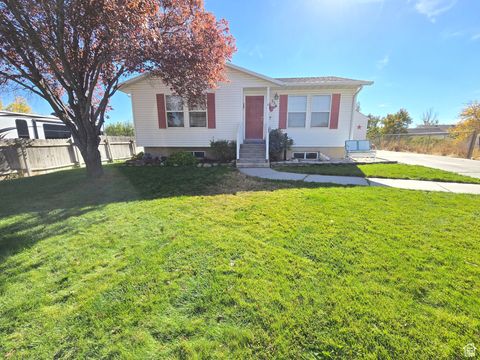
Active
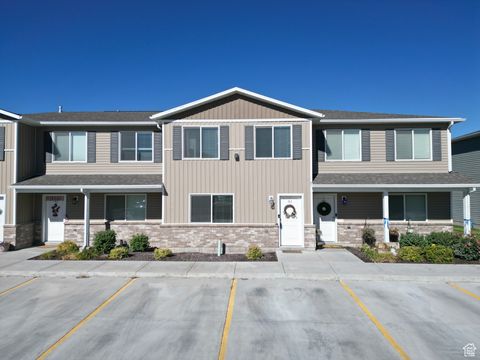
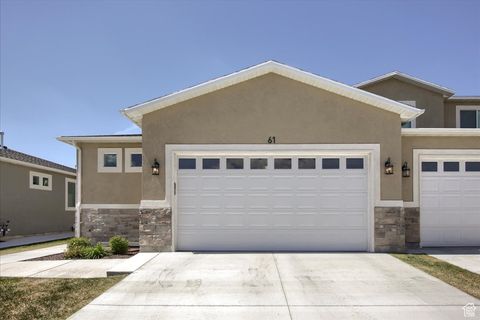
$265,000
3
bds
|
2
ba
|
1,340
sqft
|
built
2018
320 W 600 S, Tremonton, UT 84337
$-566
Cash flow
-11.1%
Cash-on-Cash Return
3.1%
Cap rate
0.6%
Rent to Value Ratio
Active
$314,900
3
bds
|
1
ba
|
990
sqft
|
built
1961
795 S 150 W, Tremonton, UT 84337
$-654
Cash flow
-10.8%
Cash-on-Cash Return
3.2%
Cap rate
0.4%
Rent to Value Ratio
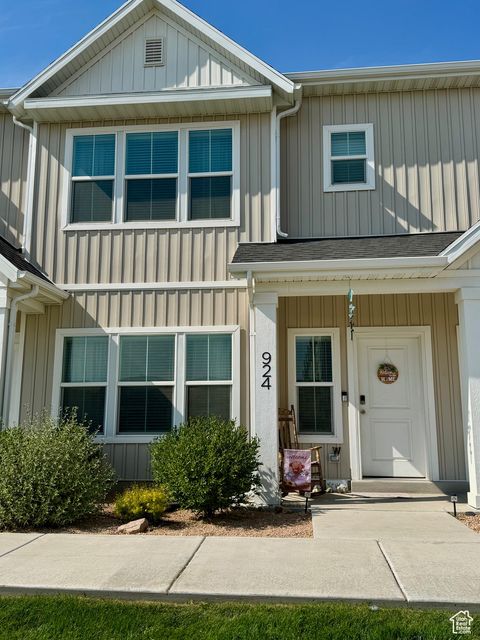
Active
$299,900
3
bds
|
1
ba
|
924
sqft
|
built
1980
551 W 720 S, Tremonton, UT 84337
$-603
Cash flow
-10.5%
Cash-on-Cash Return
3.3%
Cap rate
0.5%
Rent to Value Ratio
Active
$450,000
4
bds
|
1
ba
|
1,859
sqft
|
built
1953
311 S 100 W, Tremonton, UT 84337
$-834
Cash flow
-9.7%
Cash-on-Cash Return
3.5%
Cap rate
0.5%
Rent to Value Ratio
Active
$629,000
5
bds
|
4
ba
|
4,027
sqft
|
built
2021
1069 N 2800 W, Tremonton, UT 84337
$-901
Cash flow
-7.5%
Cash-on-Cash Return
4.0%
Cap rate
0.6%
Rent to Value Ratio
Active
$300,000
3
bds
|
3
ba
|
1,513
sqft
|
built
2021
924 W 960 N, Tremonton, UT 84337
$-434
Cash flow
-7.5%
Cash-on-Cash Return
3.9%
Cap rate
0.6%
Rent to Value Ratio
Active
$450,000
3
bds
|
2
ba
|
1,555
sqft
|
built
2022
877 N 2300 W, Tremonton, UT 84337
$-1,085
Cash flow
-12.6%
Cash-on-Cash Return
2.8%
Cap rate
0.4%
Rent to Value Ratio
Active
$729,000
3
bds
|
2
ba
|
3,344
sqft
|
built
2023
10160 N 6800 W, Tremonton, UT 84337
$-1,684
Cash flow
-12.1%
Cash-on-Cash Return
2.9%
Cap rate
0.4%
Rent to Value Ratio
Active
$586,900
6
bds
|
3
ba
|
3,523
sqft
|
built
2007
844 N 400 E, Tremonton, UT 84337
$-1,188
Cash flow
-10.6%
Cash-on-Cash Return
3.2%
Cap rate
0.5%
Rent to Value Ratio
Active
$335,000
4
bds
|
1
ba
|
1,646
sqft
|
built
1946
25 W 400 S, Tremonton, UT 84337
$-551
Cash flow
-8.6%
Cash-on-Cash Return
3.7%
Cap rate
0.5%
Rent to Value Ratio
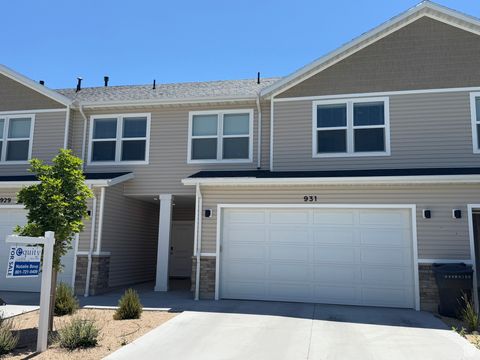
Active
$315,000
3
bds
|
3
ba
|
1,550
sqft
|
built
2022
931 W 910 N, Tremonton, UT 84337
$-646
Cash flow
-10.7%
Cash-on-Cash Return
3.2%
Cap rate
0.5%
Rent to Value Ratio
Active
$385,000
4
bds
|
2
ba
|
2,400
sqft
|
built
1996
556 W 860 S, Tremonton, UT 84337
$-1,026
Cash flow
-13.9%
Cash-on-Cash Return
2.5%
Cap rate
0.4%
Rent to Value Ratio
Active
$569,900
6
bds
|
3
ba
|
3,344
sqft
|
built
2008
758 N 400 E, Tremonton, UT 84337
$-1,851
Cash flow
-16.9%
Cash-on-Cash Return
1.8%
Cap rate
0.3%
Rent to Value Ratio
Active
$525,000
3
bds
|
3
ba
|
1,960
sqft
|
built
2020
910 W 800 N, Tremonton, UT 84337
$-1,156
Cash flow
-11.5%
Cash-on-Cash Return
3.0%
Cap rate
0.4%
Rent to Value Ratio
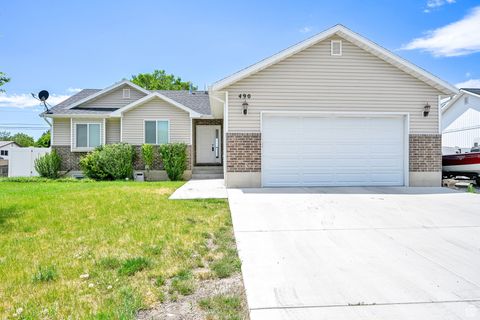
Active
$480,000
5
bds
|
3
ba
|
2,700
sqft
|
built
2018
490 S 500 W, Tremonton, UT 84337
$-1,234
Cash flow
-13.4%
Cash-on-Cash Return
2.6%
Cap rate
0.4%
Rent to Value Ratio
Active
$414,900
3
bds
|
2
ba
|
1,527
sqft
|
built
2005
1635 W 125 N, Tremonton, UT 84337
$-1,026
Cash flow
-12.9%
Cash-on-Cash Return
2.7%
Cap rate
0.4%
Rent to Value Ratio
Active
$669,000
5
bds
|
3
ba
|
3,948
sqft
|
built
2006
2618 W Mountain Rd, Tremonton, UT 84337
$-1,765
Cash flow
-13.8%
Cash-on-Cash Return
2.5%
Cap rate
0.4%
Rent to Value Ratio
Active
$425,000
3
bds
|
3
ba
|
1,547
sqft
|
built
2021
892 N 900 W, Tremonton, UT 84337
$-830
Cash flow
-10.2%
Cash-on-Cash Return
3.3%
Cap rate
0.5%
Rent to Value Ratio
Active
$333,300
3
bds
|
2
ba
|
2,191
sqft
|
built
1960
960 N 100 W, Tremonton, UT 84337
$-576
Cash flow
-9.0%
Cash-on-Cash Return
3.6%
Cap rate
0.5%
Rent to Value Ratio
Active
$650,000
4
bds
|
3
ba
|
3,036
sqft
|
built
1942
102 S 1000 W, Tremonton, UT 84337
$-1,662
Cash flow
-13.3%
Cash-on-Cash Return
2.6%
Cap rate
0.4%
Rent to Value Ratio
Active
$495,000
5
bds
|
2
ba
|
3,452
sqft
|
built
1921
10205 W 10400 N, Tremonton, UT 84337
$-583
Cash flow
-6.1%
Cash-on-Cash Return
4.3%
Cap rate
0.6%
Rent to Value Ratio
Active
$425,000
3
bds
|
2
ba
|
2,380
sqft
|
built
1940
144 S 100 W, Tremonton, UT 84337
$-1,124
Cash flow
-13.8%
Cash-on-Cash Return
2.5%
Cap rate
0.4%
Rent to Value Ratio
Active
$290,000
3
bds
|
3
ba
|
1,654
sqft
|
built
2007
855 W 350 N, Tremonton, UT 84337
$-505
Cash flow
-9.1%
Cash-on-Cash Return
3.6%
Cap rate
0.6%
Rent to Value Ratio
Active
$495,000
4
bds
|
4
ba
|
3,590
sqft
|
built
1975
720 N 300 E, Tremonton, UT 84337
$-893
Cash flow
-9.4%
Cash-on-Cash Return
3.5%
Cap rate
0.5%
Rent to Value Ratio
Active
$364,900
3
bds
|
3
ba
|
2,060
sqft
|
built
2023
200 W 1200 S, Tremonton, UT 84337
$-1,086
Cash flow
-15.5%
Cash-on-Cash Return
2.1%
Cap rate
0.4%
Rent to Value Ratio
Active
$530,000
7
bds
|
3
ba
|
3,146
sqft
|
built
2006
680 N 980 W, Tremonton, UT 84337
$-1,571
Cash flow
-15.5%
Cash-on-Cash Return
2.1%
Cap rate
0.3%
Rent to Value Ratio
Active
$379,900
3
bds
|
2
ba
|
1,900
sqft
|
built
1959
789 N 100 W, Tremonton, UT 84337
$-888
Cash flow
-12.2%
Cash-on-Cash Return
2.9%
Cap rate
0.4%
Rent to Value Ratio
Active
$450,000
6
bds
|
3
ba
|
2,558
sqft
|
built
2006
162 S 500 W, Tremonton, UT 84337
$-612
Cash flow
-7.1%
Cash-on-Cash Return
4.0%
Cap rate
0.6%
Rent to Value Ratio
Active
$749,900
6
bds
|
3
ba
|
3,776
sqft
|
built
2022
9480 N 5600 W, Elwood, UT 84337
$-2,047
Cash flow
-14.2%
Cash-on-Cash Return
2.4%
Cap rate
0.3%
Rent to Value Ratio
Active
$655,000
6
bds
|
4
ba
|
3,834
sqft
|
built
2005
955 W 720 N, Tremonton, UT 84337
$-1,616
Cash flow
-12.9%
Cash-on-Cash Return
2.7%
Cap rate
0.4%
Rent to Value Ratio
Active
$949,000
3
bds
|
2
ba
|
2,262
sqft
|
built
2014
12695 N 10800 W, Tremonton, UT 84337
$-2,750
Cash flow
-15.1%
Cash-on-Cash Return
2.2%
Cap rate
0.3%
Rent to Value Ratio