84337 Investment Properties for Sale
Browse homes for sale and investment properties in 84337. Refine your search by price, property type, or more.
Best cash flowing properties in 84337
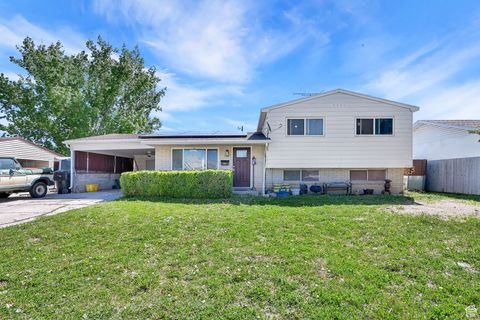
Active
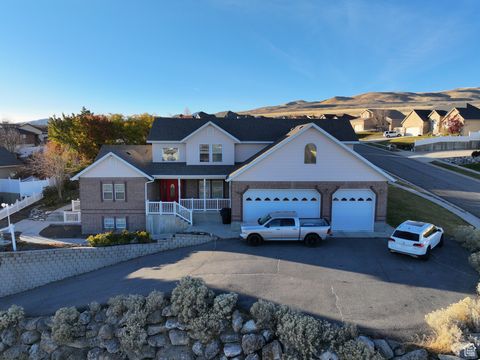
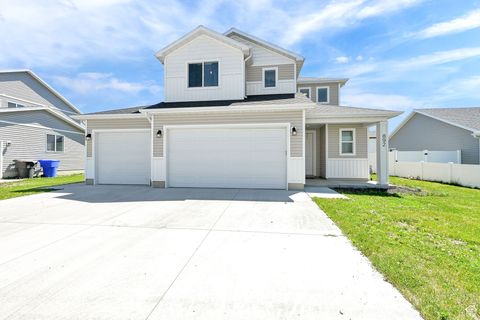
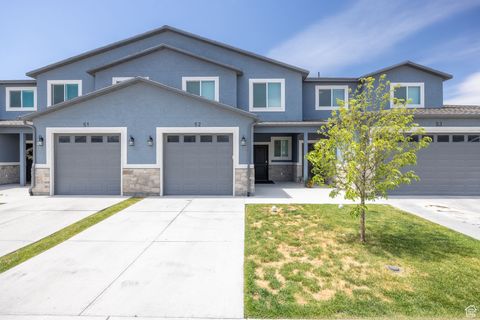
$529,000
4
bds
|
4
ba
|
3,915
sqft
|
built
1999
1035 N Valley View Dr, Tremonton, UT 84337
$-88
Cash flow
-0.9%
Cash-on-Cash Return
5.5%
Cap rate
0.7%
Rent to Value Ratio
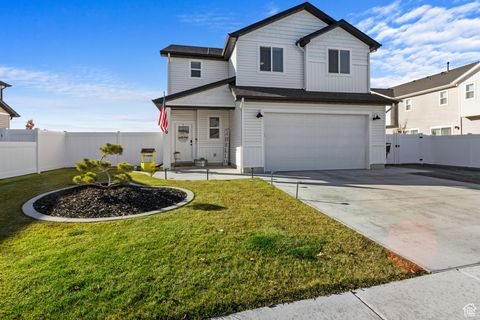
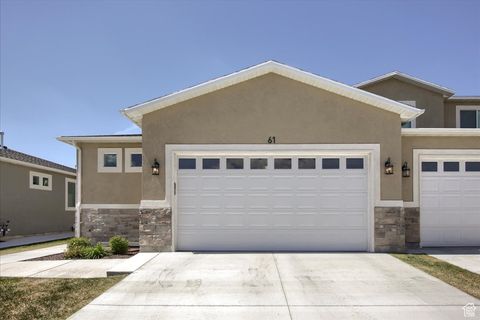
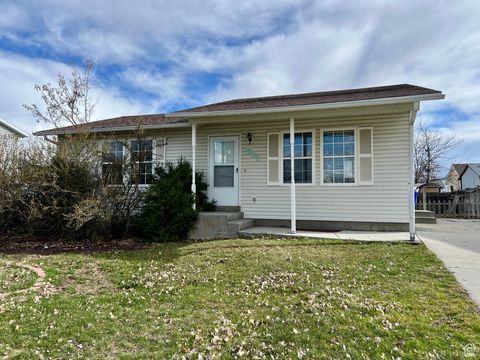
Active
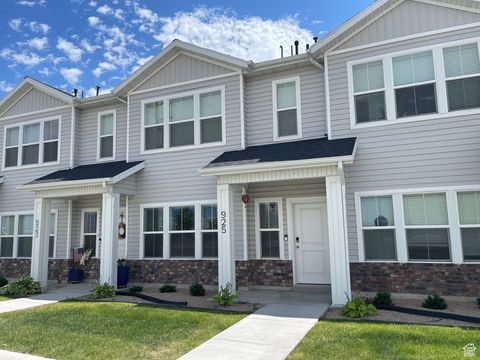
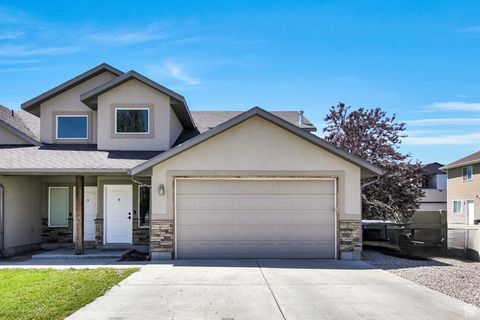
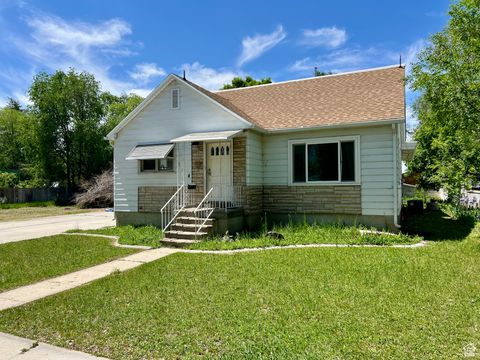
$295,000
3
bds
|
3
ba
|
1,476
sqft
|
built
2021
925 W 1000 N, Tremonton, UT 84337
$-277
Cash flow
-4.9%
Cash-on-Cash Return
4.6%
Cap rate
0.7%
Rent to Value Ratio
48 out of 57 properties for sale in 84337
Limited Results Shown
Create a free account, or log in to reveal all property listings and enjoy the complete experience.
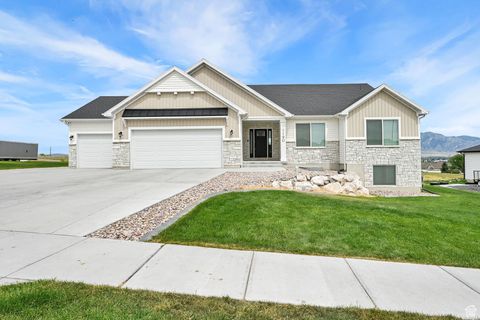
Active
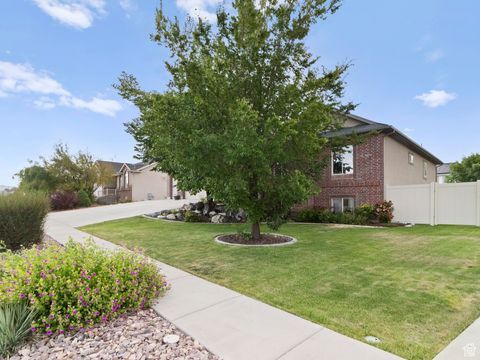
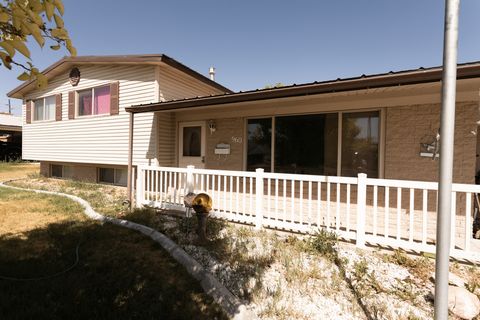
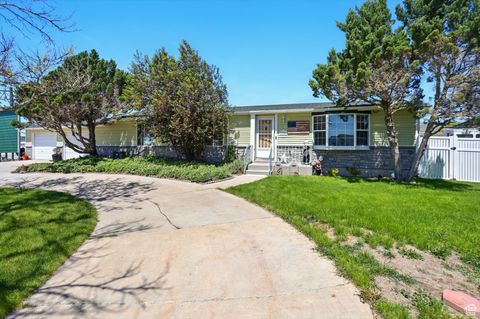
$669,000
5
bds
|
3
ba
|
3,948
sqft
|
built
2006
2618 W Mountain Rd, Tremonton, UT 84337
$-1,765
Cash flow
-13.8%
Cash-on-Cash Return
2.5%
Cap rate
0.4%
Rent to Value Ratio
Active
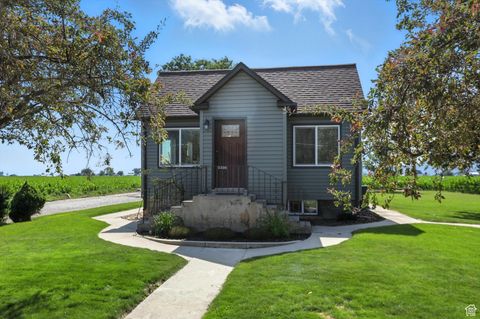
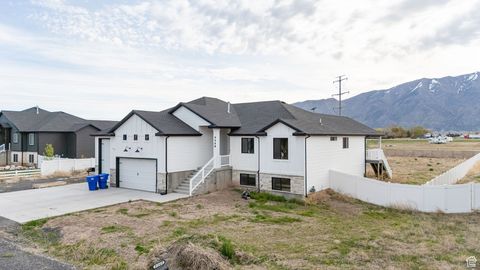
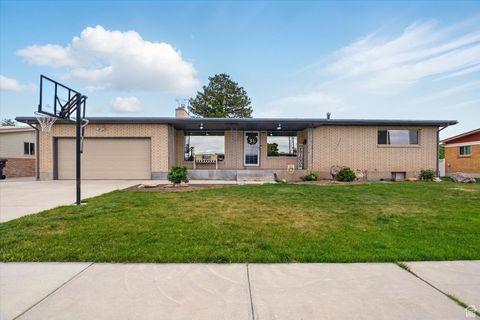
$490,000
3
bds
|
2
ba
|
2,002
sqft
|
built
1945
11395 N 4400 W, Tremonton, UT 84337
$-1,588
Cash flow
-16.9%
Cash-on-Cash Return
2.4%
Cap rate
0.3%
Rent to Value Ratio
Active
$425,000
3
bds
|
3
ba
|
1,547
sqft
|
built
2021
892 N 900 W, Tremonton, UT 84337
$-830
Cash flow
-10.2%
Cash-on-Cash Return
3.3%
Cap rate
0.5%
Rent to Value Ratio
Active
$325,000
3
bds
|
3
ba
|
1,560
sqft
|
built
2010
429 W 350 N, Tremonton, UT 84337
$-789
Cash flow
-12.7%
Cash-on-Cash Return
2.8%
Cap rate
0.4%
Rent to Value Ratio
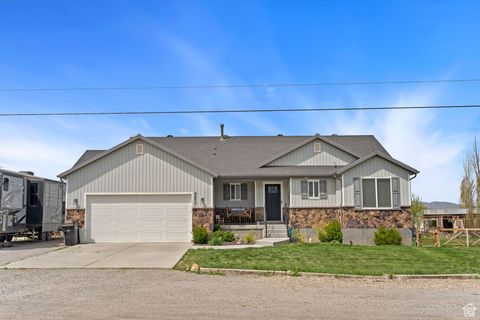
Active
$333,000
3
bds
|
2
ba
|
2,191
sqft
|
built
1960
960 N 100 W, Tremonton, UT 84337
$-575
Cash flow
-9.0%
Cash-on-Cash Return
3.6%
Cap rate
0.5%
Rent to Value Ratio
Active
$655,000
6
bds
|
3
ba
|
3,512
sqft
|
built
2020
9568 N 5600 W, Elwood, UT 84337
$-1,202
Cash flow
-9.6%
Cash-on-Cash Return
3.5%
Cap rate
0.5%
Rent to Value Ratio
Active
$380,000
3
bds
|
2
ba
|
1,650
sqft
|
built
1994
834 S 660 W, Tremonton, UT 84337
$-985
Cash flow
-13.5%
Cash-on-Cash Return
2.6%
Cap rate
0.4%
Rent to Value Ratio
Active
$580,000
4
bds
|
3
ba
|
2,411
sqft
|
built
2000
913 N 2300 W, Tremonton, UT 84337
$-1,358
Cash flow
-12.2%
Cash-on-Cash Return
2.9%
Cap rate
0.4%
Rent to Value Ratio
Active
$675,000
4
bds
|
3
ba
|
3,036
sqft
|
built
1942
102 S 1000 W, Tremonton, UT 84337
$-1,780
Cash flow
-13.8%
Cash-on-Cash Return
2.5%
Cap rate
0.4%
Rent to Value Ratio
Active
$495,000
5
bds
|
2
ba
|
3,452
sqft
|
built
1921
10205 W 10400 N, Tremonton, UT 84337
$-583
Cash flow
-6.1%
Cash-on-Cash Return
4.3%
Cap rate
0.6%
Rent to Value Ratio
Active
$325,000
3
bds
|
3
ba
|
1,590
sqft
|
built
2021
200 W 1200 S, Tremonton, UT 84337
$-928
Cash flow
-14.9%
Cash-on-Cash Return
2.3%
Cap rate
0.4%
Rent to Value Ratio

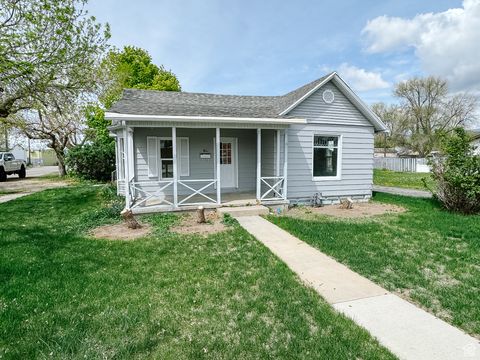
Active
$379,000
5
bds
|
2
ba
|
2,026
sqft
|
built
1975
981 N Tremont St, Tremonton, UT 84337
$-715
Cash flow
-9.8%
Cash-on-Cash Return
3.4%
Cap rate
0.5%
Rent to Value Ratio
Active
$425,000
3
bds
|
2
ba
|
2,380
sqft
|
built
1940
144 S 100 W, Tremonton, UT 84337
$-1,124
Cash flow
-13.8%
Cash-on-Cash Return
2.5%
Cap rate
0.4%
Rent to Value Ratio
Active
$510,000
3
bds
|
2
ba
|
1,344
sqft
|
built
1972
2226 W 1000 N, Tremonton, UT 84337
$-1,373
Cash flow
-14.0%
Cash-on-Cash Return
2.4%
Cap rate
0.3%
Rent to Value Ratio
Active
$409,900
4
bds
|
2
ba
|
2,502
sqft
|
built
1962
730 N 100 E, Tremonton, UT 84337
$-1,197
Cash flow
-15.2%
Cash-on-Cash Return
2.2%
Cap rate
0.3%
Rent to Value Ratio
Active
$355,000
3
bds
|
3
ba
|
2,053
sqft
|
built
2021
250 W 1200 S, Tremonton, UT 84337
$-1,028
Cash flow
-15.1%
Cash-on-Cash Return
2.2%
Cap rate
0.4%
Rent to Value Ratio
Active
$369,900
5
bds
|
2
ba
|
1,628
sqft
|
built
1936
260 N 100 W, Tremonton, UT 84337
$-849
Cash flow
-12.0%
Cash-on-Cash Return
2.9%
Cap rate
0.4%
Rent to Value Ratio
Active
$290,000
3
bds
|
3
ba
|
1,654
sqft
|
built
2007
855 W 350 N, Tremonton, UT 84337
$-505
Cash flow
-9.1%
Cash-on-Cash Return
3.6%
Cap rate
0.6%
Rent to Value Ratio
Active
$510,000
4
bds
|
4
ba
|
3,590
sqft
|
built
1975
720 N 300 E, Tremonton, UT 84337
$-964
Cash flow
-9.9%
Cash-on-Cash Return
3.4%
Cap rate
0.5%
Rent to Value Ratio
Active
$330,000
3
bds
|
2
ba
|
1,599
sqft
|
built
1962
463 S 700 W, Tremonton, UT 84337
$-747
Cash flow
-11.8%
Cash-on-Cash Return
3.0%
Cap rate
0.4%
Rent to Value Ratio
Active
$519,000
5
bds
|
4
ba
|
3,620
sqft
|
built
1976
518 Wendy Way, Tremonton, UT 84337
$-756
Cash flow
-7.6%
Cash-on-Cash Return
3.9%
Cap rate
0.5%
Rent to Value Ratio
Active
$345,000
3
bds
|
2
ba
|
1,758
sqft
|
built
1950
285 S 100 E, Tremonton, UT 84337
$-806
Cash flow
-12.2%
Cash-on-Cash Return
2.9%
Cap rate
0.4%
Rent to Value Ratio

Active
$349,900
3
bds
|
3
ba
|
1,986
sqft
|
built
2021
250 W 1200 S, Tremonton, UT 84337
$-1,004
Cash flow
-15.0%
Cash-on-Cash Return
2.2%
Cap rate
0.4%
Rent to Value Ratio
Active
$499,000
3
bds
|
3
ba
|
2,213
sqft
|
built
2022
889 N 900 W, Tremonton, UT 84337
$-727
Cash flow
-7.6%
Cash-on-Cash Return
3.9%
Cap rate
0.5%
Rent to Value Ratio
Active
$369,900
3
bds
|
3
ba
|
2,060
sqft
|
built
2023
200 W 1200 S, Tremonton, UT 84337
$-1,109
Cash flow
-15.6%
Cash-on-Cash Return
2.1%
Cap rate
0.4%
Rent to Value Ratio
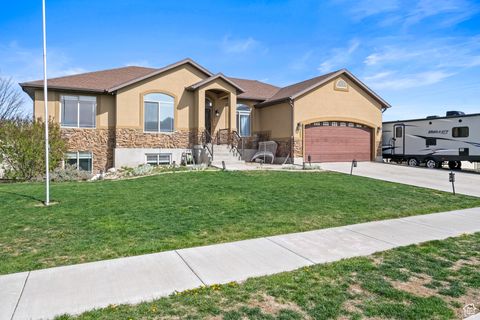
Active
$595,000
5
bds
|
3
ba
|
3,200
sqft
|
built
2011
9457 N 4800 W, Tremonton, UT 84337
$-1,894
Cash flow
-16.6%
Cash-on-Cash Return
1.9%
Cap rate
0.3%
Rent to Value Ratio
Active
$339,000
4
bds
|
2
ba
|
1,480
sqft
|
built
1908
105 N 100 W, Tremonton, UT 84337
$-767
Cash flow
-11.8%
Cash-on-Cash Return
3.0%
Cap rate
0.4%
Rent to Value Ratio
Active
$540,000
7
bds
|
3
ba
|
3,146
sqft
|
built
2006
680 N 980 W, Tremonton, UT 84337
$-1,618
Cash flow
-15.6%
Cash-on-Cash Return
2.1%
Cap rate
0.3%
Rent to Value Ratio

Active
$389,900
5
bds
|
3
ba
|
2,509
sqft
|
built
2021
250 W 1200 S, Tremonton, UT 84337
$-1,191
Cash flow
-15.9%
Cash-on-Cash Return
2.0%
Cap rate
0.4%
Rent to Value Ratio

Active
$469,000
5
bds
|
3
ba
|
2,372
sqft
|
built
2010
458 W 275 S, Tremonton, UT 84337
$-1,164
Cash flow
-12.9%
Cash-on-Cash Return
2.7%
Cap rate
0.4%
Rent to Value Ratio

Active
$499,900
6
bds
|
3
ba
|
3,869
sqft
|
built
1975
485 N 400 W, Tremonton, UT 84337
$-661
Cash flow
-6.9%
Cash-on-Cash Return
4.1%
Cap rate
0.6%
Rent to Value Ratio
Active
$325,000
3
bds
|
1
ba
|
1,872
sqft
|
built
1993
530 W 800 S, Tremonton, UT 84337
$-733
Cash flow
-11.8%
Cash-on-Cash Return
3.0%
Cap rate
0.4%
Rent to Value Ratio
Active
$615,000
5
bds
|
3
ba
|
3,628
sqft
|
built
2020
1190 N 2650 W, Tremonton, UT 84337
$-1,278
Cash flow
-10.8%
Cash-on-Cash Return
3.2%
Cap rate
0.5%
Rent to Value Ratio

Active
$325,000
3
bds
|
2
ba
|
1,295
sqft
|
built
1947
219 N 300 W, Tremonton, UT 84337
$-433
Cash flow
-7.0%
Cash-on-Cash Return
4.1%
Cap rate
0.6%
Rent to Value Ratio
Active
$384,900
3
bds
|
2
ba
|
1,900
sqft
|
built
1959
789 N 100 W, Tremonton, UT 84337
$-911
Cash flow
-12.3%
Cash-on-Cash Return
2.8%
Cap rate
0.4%
Rent to Value Ratio

Active
$234,900
2
bds
|
2
ba
|
955
sqft
|
built
2019
483 N 2650 W, Tremonton, UT 84337
$-350
Cash flow
-7.8%
Cash-on-Cash Return
3.9%
Cap rate
0.6%
Rent to Value Ratio
Active
$779,000
6
bds
|
3
ba
|
3,776
sqft
|
built
2022
9480 N 5600 W, Elwood, UT 84337
$-2,184
Cash flow
-14.6%
Cash-on-Cash Return
2.3%
Cap rate
0.3%
Rent to Value Ratio

Active
$665,000
6
bds
|
4
ba
|
3,834
sqft
|
built
2005
955 W 720 N, Tremonton, UT 84337
$-1,663
Cash flow
-13.0%
Cash-on-Cash Return
2.7%
Cap rate
0.4%
Rent to Value Ratio