84341 Investment Properties for Sale
Browse homes for sale and investment properties in 84341. Refine your search by price, property type, or more.
Best cash flowing properties in 84341
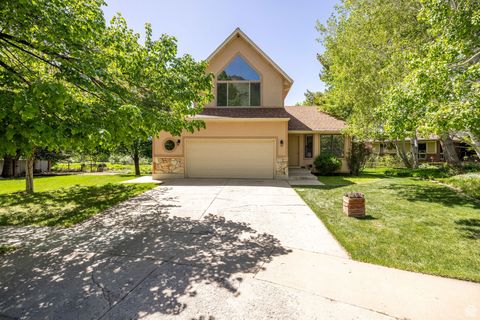
Active
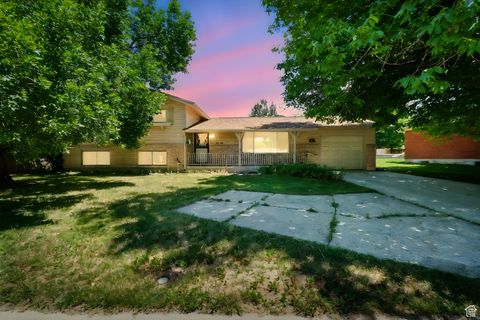
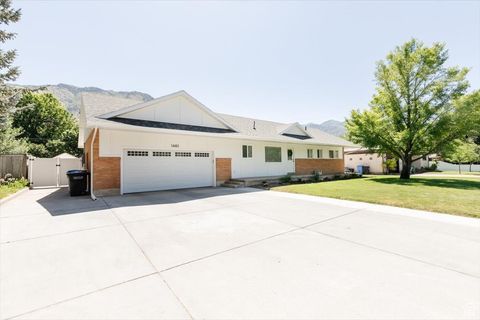
$427,000
4
bds
|
2
ba
|
2,514
sqft
|
built
1961
1188 N 600 E, Logan, UT 84341
$-458
Cash flow
-5.6%
Cash-on-Cash Return
4.4%
Cap rate
0.6%
Rent to Value Ratio
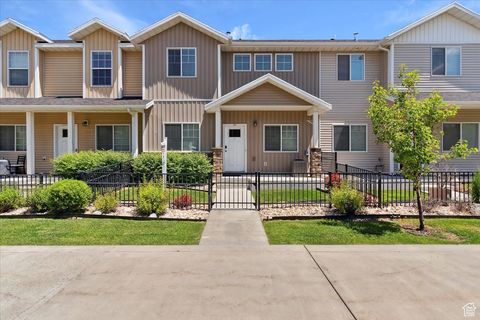
Active
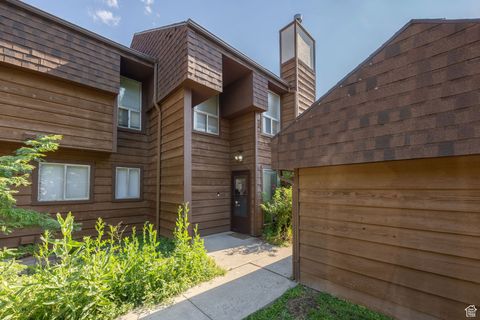
$235,000
2
bds
|
1
ba
|
904
sqft
|
built
1978
1085 N 375 W, Logan, UT 84341
$-458
Cash flow
-10.2%
Cash-on-Cash Return
3.3%
Cap rate
0.6%
Rent to Value Ratio
43 out of 52 properties for sale in 84341
Limited Results Shown
Create a free account, or log in to reveal all property listings and enjoy the complete experience.
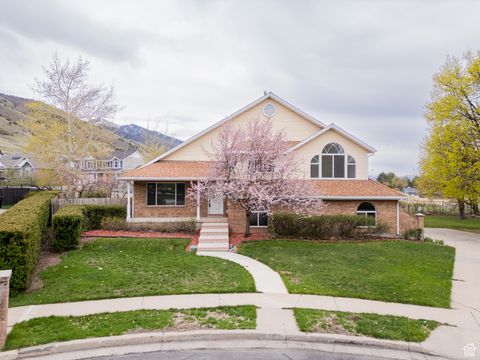
Active
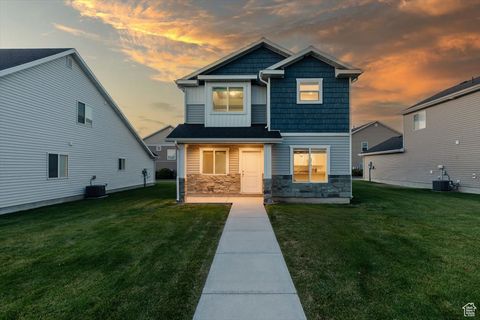
$375,000
3
bds
|
3
ba
|
1,689
sqft
|
built
2016
162 E 2480 N, North Logan, UT 84341
$-586
Cash flow
-8.2%
Cash-on-Cash Return
3.8%
Cap rate
0.6%
Rent to Value Ratio
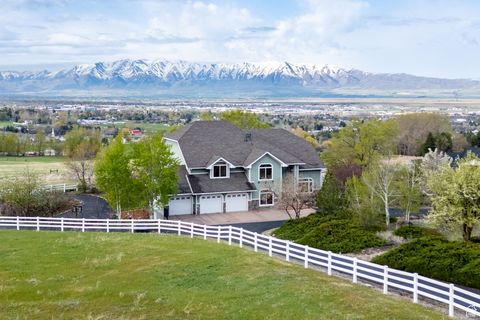
Active
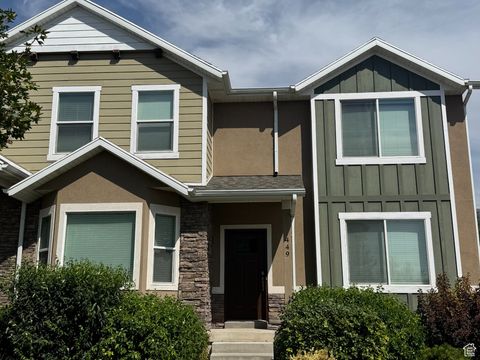
$349,900
3
bds
|
3
ba
|
1,481
sqft
|
built
2015
449 E 2170 N, Logan, UT 84341
$-804
Cash flow
-12.0%
Cash-on-Cash Return
2.9%
Cap rate
0.5%
Rent to Value Ratio
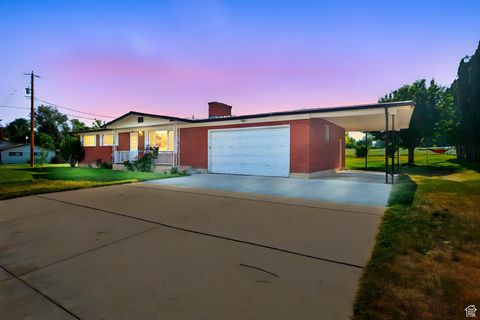
Active
$539,500
4
bds
|
3
ba
|
3,012
sqft
|
built
1981
235 E 1100 N, Logan, UT 84341
$-1,491
Cash flow
-14.4%
Cash-on-Cash Return
2.4%
Cap rate
0.3%
Rent to Value Ratio
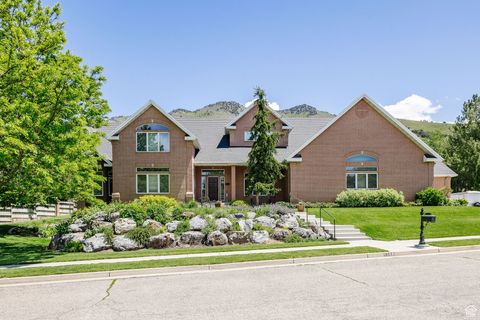
Active
$625,000
5
bds
|
3
ba
|
3,218
sqft
|
built
1994
1575 N 1640 E, Logan, UT 84341
$-1,450
Cash flow
-12.1%
Cash-on-Cash Return
2.9%
Cap rate
0.4%
Rent to Value Ratio
Active
$332,900
3
bds
|
3
ba
|
1,583
sqft
|
built
2007
514 W 1490 N, Logan, UT 84341
$-603
Cash flow
-9.5%
Cash-on-Cash Return
3.5%
Cap rate
0.5%
Rent to Value Ratio
Active
$630,000
6
bds
|
4
ba
|
5,246
sqft
|
built
1988
1560 E 1580 N, Logan, UT 84341
$-1,110
Cash flow
-9.2%
Cash-on-Cash Return
3.6%
Cap rate
0.5%
Rent to Value Ratio
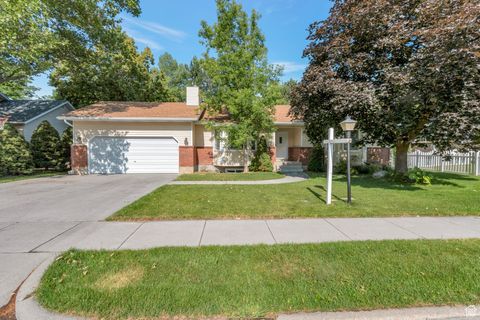
Active
$515,000
5
bds
|
3
ba
|
2,836
sqft
|
built
1964
1658 E 1500 N, Logan, UT 84341
$-680
Cash flow
-6.9%
Cash-on-Cash Return
4.1%
Cap rate
0.5%
Rent to Value Ratio
Active
$639,900
4
bds
|
3
ba
|
3,544
sqft
|
built
1967
1725 E 1080 N, Logan, UT 84341
$-1,853
Cash flow
-15.1%
Cash-on-Cash Return
2.2%
Cap rate
0.3%
Rent to Value Ratio
Active
$399,900
5
bds
|
3
ba
|
1,922
sqft
|
built
1991
224 W 1330 N, Logan, UT 84341
$-652
Cash flow
-8.5%
Cash-on-Cash Return
3.7%
Cap rate
0.5%
Rent to Value Ratio
Active
$285,000
2
bds
|
2
ba
|
1,224
sqft
|
built
1999
123 Penhurst Pl, Logan, UT 84341
$-643
Cash flow
-11.8%
Cash-on-Cash Return
3.0%
Cap rate
0.5%
Rent to Value Ratio
Active
$1,595,000
6
bds
|
6
ba
|
5,494
sqft
|
built
2018
2835 Naomi Cir, North Logan, UT 84341
$-5,963
Cash flow
-19.5%
Cash-on-Cash Return
1.2%
Cap rate
0.2%
Rent to Value Ratio
Active
$545,000
5
bds
|
3
ba
|
2,500
sqft
|
built
1974
1570 E 2100 N, Logan, UT 84341
$-1,232
Cash flow
-11.8%
Cash-on-Cash Return
3.0%
Cap rate
0.4%
Rent to Value Ratio
Active
$899,900
5
bds
|
4
ba
|
3,374
sqft
|
built
1967
1739 E 1080 N, Logan, UT 84341
$-2,719
Cash flow
-15.8%
Cash-on-Cash Return
2.1%
Cap rate
0.3%
Rent to Value Ratio
Active
$390,500
4
bds
|
4
ba
|
2,630
sqft
|
built
2003
1030 N 130 W, Logan, UT 84341
$-781
Cash flow
-10.4%
Cash-on-Cash Return
3.3%
Cap rate
0.5%
Rent to Value Ratio
Active
$275,000
2
bds
|
2
ba
|
1,224
sqft
|
built
2000
85 Hampton Pl, Logan, UT 84341
$-591
Cash flow
-11.2%
Cash-on-Cash Return
3.1%
Cap rate
0.5%
Rent to Value Ratio
Active
$324,500
3
bds
|
3
ba
|
1,595
sqft
|
built
2007
1568 N 565 W, Logan, UT 84341
$-568
Cash flow
-9.1%
Cash-on-Cash Return
3.6%
Cap rate
0.6%
Rent to Value Ratio
Active
$315,000
3
bds
|
2
ba
|
1,398
sqft
|
built
2008
1492 N 565 W, Logan, UT 84341
$-658
Cash flow
-10.9%
Cash-on-Cash Return
3.2%
Cap rate
0.5%
Rent to Value Ratio

Active
$420,000
5
bds
|
3
ba
|
1,740
sqft
|
built
1994
364 W 1330 N, Logan, UT 84341
$-888
Cash flow
-11.0%
Cash-on-Cash Return
3.1%
Cap rate
0.4%
Rent to Value Ratio
Active
$1,350,000
6
bds
|
6
ba
|
7,771
sqft
|
built
2007
1273 Cedar Heights Dr, Logan, UT 84341
$-4,588
Cash flow
-17.7%
Cash-on-Cash Return
1.6%
Cap rate
0.2%
Rent to Value Ratio
Active
$560,000
5
bds
|
3
ba
|
2,620
sqft
|
built
1963
1440 N 1600 E, Logan, UT 84341
$-1,172
Cash flow
-10.9%
Cash-on-Cash Return
3.2%
Cap rate
0.4%
Rent to Value Ratio
Active
$1,750,000
6
bds
|
5
ba
|
8,214
sqft
|
built
1995
1188 N 1750 E, Logan, UT 84341
$-5,639
Cash flow
-16.8%
Cash-on-Cash Return
1.8%
Cap rate
0.3%
Rent to Value Ratio
Active
$489,900
6
bds
|
2
ba
|
2,592
sqft
|
built
1963
2280 N 800 E, North Logan, UT 84341
$-1,272
Cash flow
-13.5%
Cash-on-Cash Return
2.6%
Cap rate
0.4%
Rent to Value Ratio

Active
$635,000
5
bds
|
3
ba
|
4,935
sqft
|
built
1987
1580 E 1630 N, North Logan, UT 84341
$-1,053
Cash flow
-8.7%
Cash-on-Cash Return
3.7%
Cap rate
0.5%
Rent to Value Ratio
Active
$464,000
5
bds
|
2
ba
|
2,306
sqft
|
built
1986
1561 N 1525 E, Logan, UT 84341
$-855
Cash flow
-9.6%
Cash-on-Cash Return
3.5%
Cap rate
0.5%
Rent to Value Ratio
Active
$624,900
5
bds
|
4
ba
|
3,172
sqft
|
built
1992
2951 N 1200 E, North Logan, UT 84341
$-1,379
Cash flow
-11.5%
Cash-on-Cash Return
3.0%
Cap rate
0.4%
Rent to Value Ratio

Active
$334,500
4
bds
|
3
ba
|
1,603
sqft
|
built
2007
1587 N 565 W, Logan, UT 84341
$-687
Cash flow
-10.7%
Cash-on-Cash Return
3.2%
Cap rate
0.5%
Rent to Value Ratio
Active
$389,900
4
bds
|
4
ba
|
2,631
sqft
|
built
2003
1035 N 130 W, Logan, UT 84341
$-781
Cash flow
-10.5%
Cash-on-Cash Return
3.3%
Cap rate
0.5%
Rent to Value Ratio
Active
$784,999
6
bds
|
4
ba
|
3,903
sqft
|
built
2008
1872 N 1850 E, North Logan, UT 84341
$-2,033
Cash flow
-13.5%
Cash-on-Cash Return
2.6%
Cap rate
0.4%
Rent to Value Ratio
Active
$899,000
4
bds
|
4
ba
|
5,785
sqft
|
built
2003
1315 E 1550 N, North Logan, UT 84341
$-2,889
Cash flow
-16.8%
Cash-on-Cash Return
1.8%
Cap rate
0.3%
Rent to Value Ratio
Active
$629,000
4
bds
|
3
ba
|
3,300
sqft
|
built
1987
1729 E 1700 N, North Logan, UT 84341
$-1,781
Cash flow
-14.8%
Cash-on-Cash Return
2.3%
Cap rate
0.3%
Rent to Value Ratio
Active
$339,500
4
bds
|
3
ba
|
1,625
sqft
|
built
2014
1545 N 420 W, Logan, UT 84341
$-613
Cash flow
-9.4%
Cash-on-Cash Return
3.5%
Cap rate
0.5%
Rent to Value Ratio
Active
$566,000
5
bds
|
4
ba
|
2,844
sqft
|
built
1988
1720 N 1850 E, North Logan, UT 84341
$-1,276
Cash flow
-11.8%
Cash-on-Cash Return
3.0%
Cap rate
0.4%
Rent to Value Ratio
Active
$1,399,000
6
bds
|
5
ba
|
6,721
sqft
|
built
1994
1910 E Canyon Ridge Dr, North Logan, UT 84341
$-4,939
Cash flow
-18.4%
Cash-on-Cash Return
1.4%
Cap rate
0.2%
Rent to Value Ratio
Active
$415,000
4
bds
|
3
ba
|
1,574
sqft
|
built
2016
455 W 1140 N, Logan, UT 84341
$-724
Cash flow
-9.1%
Cash-on-Cash Return
3.6%
Cap rate
0.5%
Rent to Value Ratio

Active
$769,000
6
bds
|
4
ba
|
4,174
sqft
|
built
2005
534 E 2000 N, North Logan, UT 84341
$-1,491
Cash flow
-10.1%
Cash-on-Cash Return
3.4%
Cap rate
0.5%
Rent to Value Ratio

Active
$324,500
3
bds
|
3
ba
|
1,598
sqft
|
built
2006
462 W 1490 N, Logan, UT 84341
$-636
Cash flow
-10.2%
Cash-on-Cash Return
3.3%
Cap rate
0.5%
Rent to Value Ratio
Active
$399,000
4
bds
|
2
ba
|
1,586
sqft
|
built
1996
495 W 1330 N, Logan, UT 84341
$-788
Cash flow
-10.3%
Cash-on-Cash Return
3.3%
Cap rate
0.5%
Rent to Value Ratio

Active
$544,999
5
bds
|
3
ba
|
3,558
sqft
|
built
1969
2047 N 1350 E, North Logan, UT 84341
$-957
Cash flow
-9.2%
Cash-on-Cash Return
3.6%
Cap rate
0.5%
Rent to Value Ratio