85008 Investment Properties for Sale
Browse homes for sale and investment properties in 85008. Refine your search by price, property type, or more.
Best cash flowing properties in 85008
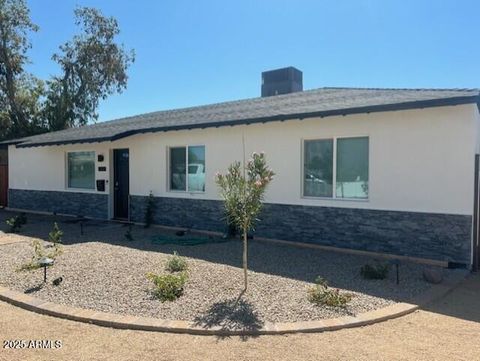
Active
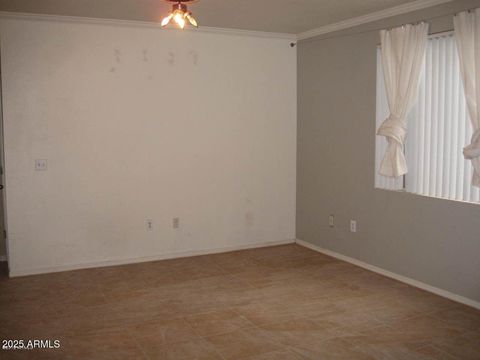
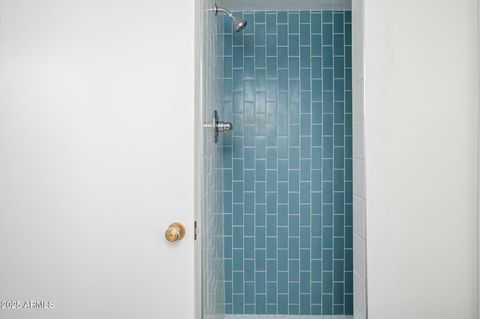
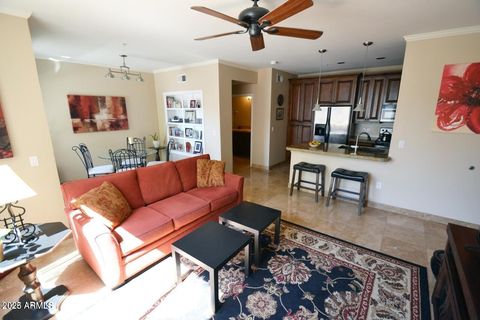
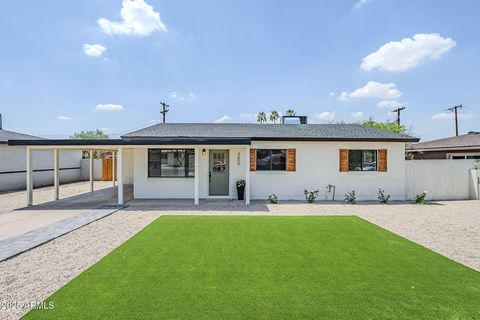
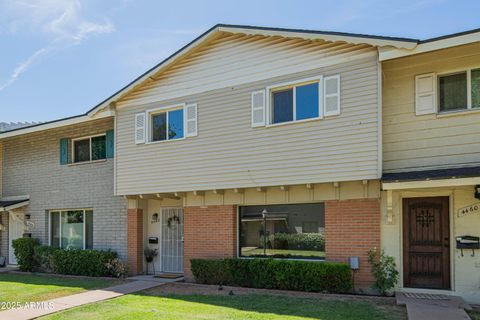
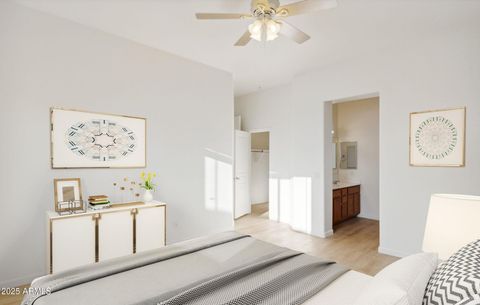
$639,000
4
bds
|
2
ba
|
1,402
sqft
|
built
1950
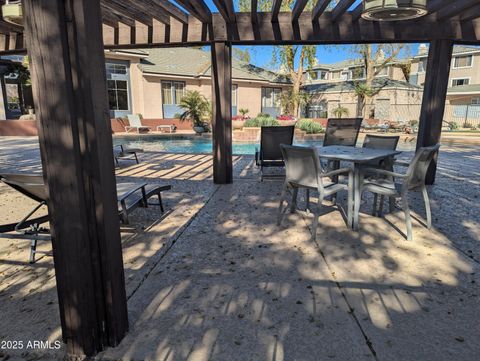
4337 E Wilshire Dr, Phoenix, AZ 85008
$3,681
Cash flow
30.1%
Cash-on-Cash Return
12.6%
Cap rate
1.6%
Rent to Value Ratio

Active
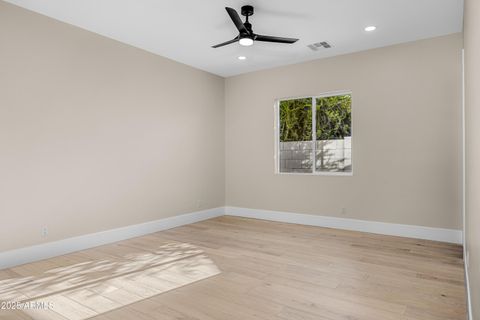
$288,000
2
bds
|
2
ba
|
1,062
sqft
|
built
1983
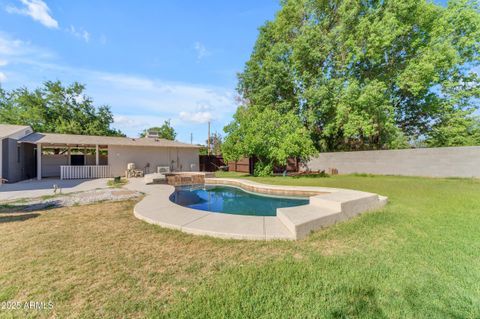
1618 N 32nd St, Phoenix, AZ 85008
$-141
Cash flow
-2.6%
Cash-on-Cash Return
5.1%
Cap rate
0.7%
Rent to Value Ratio
65 out of 75 properties for sale in 85008
Limited Results Shown
Create a free account, or log in to reveal all property listings and enjoy the complete experience.

Active
$514,900
3
bds
|
2
ba
|
1,500
sqft
|
built
1955
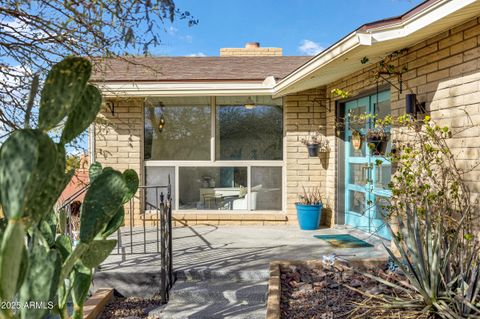
2301 N 38th St, Phoenix, AZ 85008
$-1,017
Cash flow
-10.3%
Cash-on-Cash Return
3.3%
Cap rate
0.4%
Rent to Value Ratio

Active
$499,000
4
bds
|
2
ba
|
1,610
sqft
|
built
2002
2640 N 28th Pl, Phoenix, AZ 85008
$-812
Cash flow
-8.5%
Cash-on-Cash Return
3.7%
Cap rate
0.5%
Rent to Value Ratio
Active
$925,000
bds
|
0
ba
|
0
sqft
|
built
1965
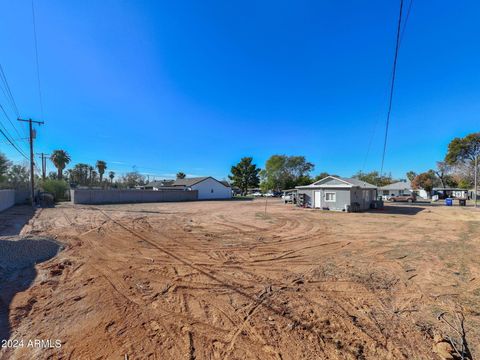
2646 E Willetta St, Phoenix, AZ 85008
$-2,965
Cash flow
-16.7%
Cash-on-Cash Return
1.8%
Cap rate
0.2%
Rent to Value Ratio

Active
$419,000
3
bds
|
2
ba
|
1,132
sqft
|
built
1980
5119 E Windsor Ave, Phoenix, AZ 85008
$-961
Cash flow
-12.0%
Cash-on-Cash Return
2.9%
Cap rate
0.4%
Rent to Value Ratio

Active
$1,500,000
4
bds
|
3
ba
|
2,565
sqft
|
built
1953
4037 E Oak St, Phoenix, AZ 85008
$-5,048
Cash flow
-17.6%
Cash-on-Cash Return
1.6%
Cap rate
0.2%
Rent to Value Ratio

Active
$499,000
3
bds
|
2
ba
|
1,720
sqft
|
built
1955
4928 E Palm Ln, Phoenix, AZ 85008
$-561
Cash flow
-5.9%
Cash-on-Cash Return
4.3%
Cap rate
0.6%
Rent to Value Ratio
Active
$489,900
4
bds
|
2
ba
|
1,523
sqft
|
built
1949
3239 E Virginia Ave, Phoenix, AZ 85008
$-902
Cash flow
-9.6%
Cash-on-Cash Return
3.5%
Cap rate
0.4%
Rent to Value Ratio

Active
$449,000
3
bds
|
2
ba
|
1,534
sqft
|
built
1955
501 N 47th Pl, Phoenix, AZ 85008
$-675
Cash flow
-7.8%
Cash-on-Cash Return
3.9%
Cap rate
0.5%
Rent to Value Ratio
Active
$540,000
3
bds
|
2
ba
|
1,274
sqft
|
built
1950
2201 N 29th Pl, Phoenix, AZ 85008
$-1,367
Cash flow
-13.2%
Cash-on-Cash Return
2.6%
Cap rate
0.3%
Rent to Value Ratio

Active
$269,999
2
bds
|
2
ba
|
847
sqft
|
built
2002
5302 E Van Buren St, Phoenix, AZ 85008
$-630
Cash flow
-12.2%
Cash-on-Cash Return
2.9%
Cap rate
0.5%
Rent to Value Ratio

Active
$474,990
3
bds
|
2
ba
|
896
sqft
|
built
1955
4832 E Cambridge Ave, Phoenix, AZ 85008
$-1,116
Cash flow
-12.3%
Cash-on-Cash Return
2.9%
Cap rate
0.4%
Rent to Value Ratio

Active
$468,000
2
bds
|
3
ba
|
1,000
sqft
|
built
1945
4815 E Windsor Ave, Phoenix, AZ 85008
$-1,349
Cash flow
-15.0%
Cash-on-Cash Return
2.2%
Cap rate
0.3%
Rent to Value Ratio

Active
$950,000
5
bds
|
0
ba
|
0
sqft
|
built
1965
2534 N 52nd St, Phoenix, AZ 85008
$-2,154
Cash flow
-11.8%
Cash-on-Cash Return
3.0%
Cap rate
0.4%
Rent to Value Ratio
Active
$270,000
2
bds
|
2
ba
|
1,034
sqft
|
built
1999
5345 E Van Buren St, Phoenix, AZ 85008
$-596
Cash flow
-11.5%
Cash-on-Cash Return
3.0%
Cap rate
0.6%
Rent to Value Ratio
Active
$1,050,000
4
bds
|
4
ba
|
2,839
sqft
|
built
1953
2425 E Harvard St, Phoenix, AZ 85008
$-2,942
Cash flow
-14.6%
Cash-on-Cash Return
2.3%
Cap rate
0.3%
Rent to Value Ratio
Active
$1,025,000
4
bds
|
2
ba
|
1,962
sqft
|
built
1964
2306 N 55th St, Phoenix, AZ 85008
$-1,260
Cash flow
-6.4%
Cash-on-Cash Return
4.2%
Cap rate
0.5%
Rent to Value Ratio
Active
$549,000
2
bds
|
1
ba
|
800
sqft
|
built
1950
2627 N 30th Pl, Phoenix, AZ 85008
$-1,414
Cash flow
-13.4%
Cash-on-Cash Return
2.6%
Cap rate
0.3%
Rent to Value Ratio

Active
$245,000
2
bds
|
2
ba
|
936
sqft
|
built
1983
2815 N 52nd St, Phoenix, AZ 85008
$-452
Cash flow
-9.6%
Cash-on-Cash Return
3.5%
Cap rate
0.7%
Rent to Value Ratio
Active
$215,000
1
bds
|
1
ba
|
777
sqft
|
built
1999
5345 E Van Buren St, Phoenix, AZ 85008
$-429
Cash flow
-10.4%
Cash-on-Cash Return
3.3%
Cap rate
0.7%
Rent to Value Ratio
Active
$1,995,000
5
bds
|
5
ba
|
6,023
sqft
|
built
2025
4115 E Windsor Ave, Phoenix, AZ 85008
$-7,904
Cash flow
-20.7%
Cash-on-Cash Return
0.9%
Cap rate
0.1%
Rent to Value Ratio

Active
$650,000
4
bds
|
3
ba
|
2,049
sqft
|
built
2022
2601 N 27th St, Phoenix, AZ 85008
$-496
Cash flow
-4.0%
Cash-on-Cash Return
4.8%
Cap rate
0.7%
Rent to Value Ratio

Active
$265,000
2
bds
|
2
ba
|
847
sqft
|
built
2002
5302 E Van Buren St, Phoenix, AZ 85008
$-606
Cash flow
-11.9%
Cash-on-Cash Return
2.9%
Cap rate
0.5%
Rent to Value Ratio
Active
$995,000
bds
|
0
ba
|
0
sqft
|
built
1950
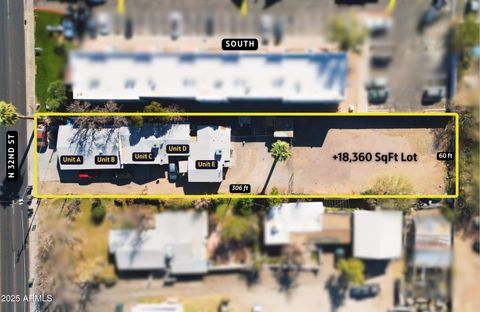
1714 N 32nd St, Phoenix, AZ 85008
$-3,484
Cash flow
-18.3%
Cash-on-Cash Return
1.5%
Cap rate
0.2%
Rent to Value Ratio

Active
$369,900
2
bds
|
1
ba
|
896
sqft
|
built
1930
2112 N 24th Pl, Phoenix, AZ 85008
$-423
Cash flow
-6.0%
Cash-on-Cash Return
4.3%
Cap rate
0.5%
Rent to Value Ratio
Active
$498,000
4
bds
|
2
ba
|
1,603
sqft
|
built
1950
2825 N 33rd Pl, Phoenix, AZ 85008
$-861
Cash flow
-9.0%
Cash-on-Cash Return
3.6%
Cap rate
0.5%
Rent to Value Ratio

Active
$1,085,000
4
bds
|
4
ba
|
3,170
sqft
|
built
2006
4213 E Edgemont Ave, Phoenix, AZ 85008
$-2,390
Cash flow
-11.5%
Cash-on-Cash Return
3.0%
Cap rate
0.4%
Rent to Value Ratio

Active
$305,000
2
bds
|
2
ba
|
1,042
sqft
|
built
1999
5401 E Van Buren St, Phoenix, AZ 85008
$-785
Cash flow
-13.4%
Cash-on-Cash Return
2.6%
Cap rate
0.5%
Rent to Value Ratio

Active
$658,000
4
bds
|
3
ba
|
2,159
sqft
|
built
2022
2604 N 27th St, Phoenix, AZ 85008
$-1,104
Cash flow
-8.8%
Cash-on-Cash Return
3.7%
Cap rate
0.5%
Rent to Value Ratio
Active
$699,000
3
bds
|
2
ba
|
1,734
sqft
|
built
1955
4621 E Edgemont Ave, Phoenix, AZ 85008
$-1,668
Cash flow
-12.5%
Cash-on-Cash Return
2.8%
Cap rate
0.4%
Rent to Value Ratio

Active
$485,000
3
bds
|
3
ba
|
2,051
sqft
|
built
1967
2601 E Virginia Ave, Phoenix, AZ 85008
$-896
Cash flow
-9.6%
Cash-on-Cash Return
3.5%
Cap rate
0.5%
Rent to Value Ratio
Active
$222,900
1
bds
|
1
ba
|
777
sqft
|
built
1999
5345 E Van Buren St, Phoenix, AZ 85008
$-329
Cash flow
-7.7%
Cash-on-Cash Return
3.9%
Cap rate
0.7%
Rent to Value Ratio
Active
$499,999
3
bds
|
2
ba
|
1,226
sqft
|
built
1955
3609 E Palm Ln, Phoenix, AZ 85008
$-1,238
Cash flow
-12.9%
Cash-on-Cash Return
2.7%
Cap rate
0.4%
Rent to Value Ratio
Active
$345,000
3
bds
|
3
ba
|
1,584
sqft
|
built
1966
4462 E Belleview St, Phoenix, AZ 85008
$-745
Cash flow
-11.3%
Cash-on-Cash Return
3.1%
Cap rate
0.5%
Rent to Value Ratio
Active
$310,000
2
bds
|
2
ba
|
1,206
sqft
|
built
2006
1225 N 36th St, Phoenix, AZ 85008
$-562
Cash flow
-9.5%
Cash-on-Cash Return
3.5%
Cap rate
0.6%
Rent to Value Ratio
Active
$219,900
1
bds
|
1
ba
|
692
sqft
|
built
1999
5345 E Van Buren St, Phoenix, AZ 85008
$-412
Cash flow
-9.8%
Cash-on-Cash Return
3.4%
Cap rate
0.6%
Rent to Value Ratio
Active
$649,999
4
bds
|
3
ba
|
1,854
sqft
|
built
1954
3754 E Yale St, Phoenix, AZ 85008
$-2,023
Cash flow
-16.2%
Cash-on-Cash Return
1.9%
Cap rate
0.3%
Rent to Value Ratio
Active
$1,600,000
bds
|
0
ba
|
0
sqft
|
built
1958
1801 N 25th Pl, Phoenix, AZ 85008
$-6,649
Cash flow
-21.7%
Cash-on-Cash Return
0.7%
Cap rate
0.1%
Rent to Value Ratio

Active
$699,999
4
bds
|
2
ba
|
2,553
sqft
|
built
1961
3743 E Coronado Rd, Phoenix, AZ 85008
$-1,038
Cash flow
-7.7%
Cash-on-Cash Return
3.9%
Cap rate
0.5%
Rent to Value Ratio