85009 Investment Properties for Sale
Browse homes for sale and investment properties in 85009. Refine your search by price, property type, or more.
Best cash flowing properties in 85009

Active
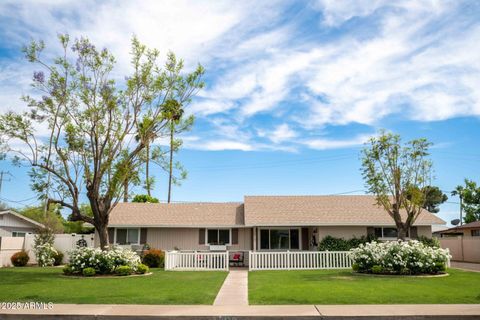
$315,000
3
bds
|
2
ba
|
1,280
sqft
|
built
1939
914 S 30th Dr, Phoenix, AZ 85009
$-32
Cash flow
-0.5%
Cash-on-Cash Return
5.6%
Cap rate
0.7%
Rent to Value Ratio

Active
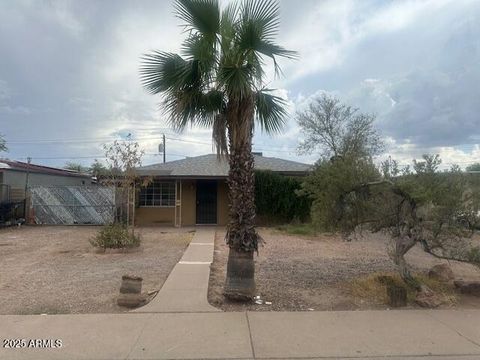
$200,000
2
bds
|
2
ba
|
1,394
sqft
|
built
1941
2016 W Hadley St, Phoenix, AZ 85009
$-32
Cash flow
-0.8%
Cash-on-Cash Return
5.5%
Cap rate
0.7%
Rent to Value Ratio
45 out of 53 properties for sale in 85009
Limited Results Shown
Create a free account, or log in to reveal all property listings and enjoy the complete experience.
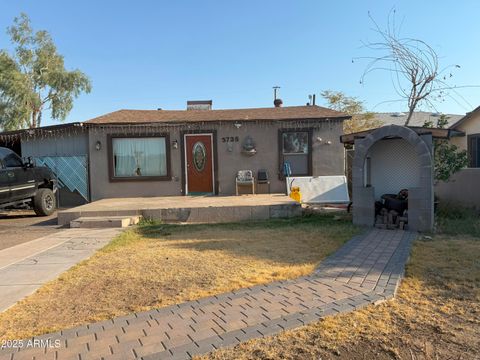
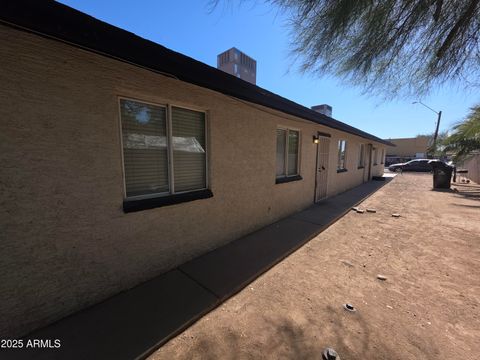
Active
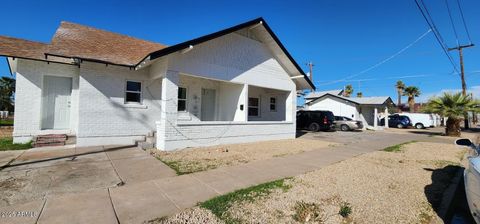
$305,000
3
bds
|
1
ba
|
1,480
sqft
|
built
1954
3735 W Moreland St, Phoenix, AZ 85009
$-316
Cash flow
-5.4%
Cash-on-Cash Return
4.4%
Cap rate
0.6%
Rent to Value Ratio
Active
$675,000
bds
|
0
ba
|
0
sqft
|
built
1984
1001 N 32nd Ave, Phoenix, AZ 85009
$-2,327
Cash flow
-18.0%
Cash-on-Cash Return
1.5%
Cap rate
0.2%
Rent to Value Ratio
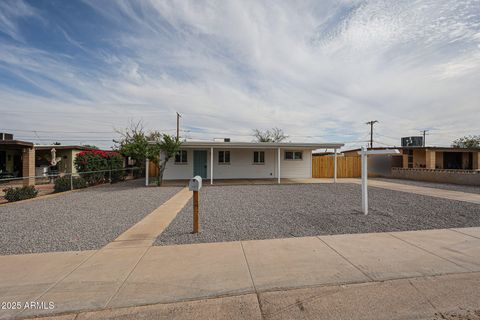
Active
$289,000
2
bds
|
1
ba
|
720
sqft
|
built
1945
3601 W Polk St, Phoenix, AZ 85009
$-349
Cash flow
-6.3%
Cash-on-Cash Return
4.2%
Cap rate
0.6%
Rent to Value Ratio
Active
$354,000
4
bds
|
2
ba
|
1,258
sqft
|
built
1951
3528 W Encanto Blvd, Phoenix, AZ 85009
$-380
Cash flow
-5.6%
Cash-on-Cash Return
4.4%
Cap rate
0.6%
Rent to Value Ratio
Active
$310,000
3
bds
|
3
ba
|
1,092
sqft
|
built
1948
3140 W Alvarado Rd, Phoenix, AZ 85009
$-190
Cash flow
-3.2%
Cash-on-Cash Return
4.9%
Cap rate
0.6%
Rent to Value Ratio
Active
$319,900
4
bds
|
2
ba
|
1,500
sqft
|
built
1954
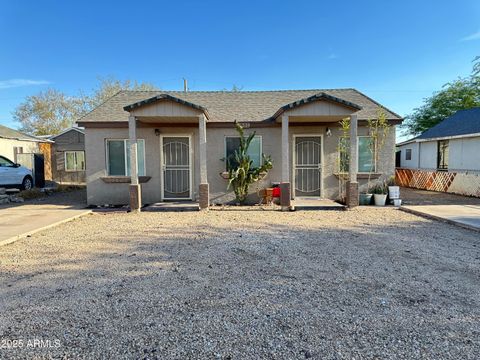
3512 W Tonto St, Phoenix, AZ 85009
$-218
Cash flow
-3.6%
Cash-on-Cash Return
4.9%
Cap rate
0.6%
Rent to Value Ratio
Active
$269,900
2
bds
|
1
ba
|
754
sqft
|
built
1950
3421 W Willetta St, Phoenix, AZ 85009
$-467
Cash flow
-9.0%
Cash-on-Cash Return
3.6%
Cap rate
0.5%
Rent to Value Ratio

Active
$200,000
2
bds
|
2
ba
|
984
sqft
|
built
1946
2121 W Tonto St, Phoenix, AZ 85009
$-159
Cash flow
-4.1%
Cash-on-Cash Return
4.7%
Cap rate
0.6%
Rent to Value Ratio
Active
$450,000
bds
|
0
ba
|
0
sqft
|
built
1938
610 N 27th Ave, Phoenix, AZ 85009
$-1,068
Cash flow
-12.4%
Cash-on-Cash Return
2.8%
Cap rate
0.4%
Rent to Value Ratio
Active
$328,000
2
bds
|
1
ba
|
1,053
sqft
|
built
1950
3435 W Holly St, Phoenix, AZ 85009
$-495
Cash flow
-7.9%
Cash-on-Cash Return
3.9%
Cap rate
0.5%
Rent to Value Ratio
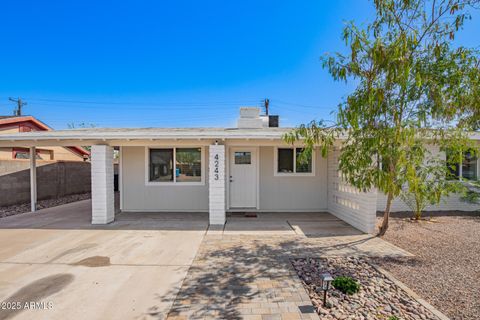
Active
$390,000
4
bds
|
2
ba
|
1,297
sqft
|
built
1963
4243 W Sheridan St, Phoenix, AZ 85009
$-676
Cash flow
-9.0%
Cash-on-Cash Return
3.6%
Cap rate
0.5%
Rent to Value Ratio

Active
$999,999
3
bds
|
3
ba
|
1,912
sqft
|
built
1957
2055 W Windsor Ave, Phoenix, AZ 85009
$-3,015
Cash flow
-15.7%
Cash-on-Cash Return
2.1%
Cap rate
0.3%
Rent to Value Ratio
Active
$430,000
bds
|
0
ba
|
0
sqft
|
built
1958
3905 W Almeria Rd, Phoenix, AZ 85009
$-1,033
Cash flow
-12.5%
Cash-on-Cash Return
2.8%
Cap rate
0.4%
Rent to Value Ratio
Active
$1,295,000
bds
|
0
ba
|
0
sqft
|
built
1952
1945 W Van Buren St, Phoenix, AZ 85009
$-5,527
Cash flow
-22.3%
Cash-on-Cash Return
0.6%
Cap rate
0.1%
Rent to Value Ratio
Active
$308,000
3
bds
|
2
ba
|
1,100
sqft
|
built
1944
3640 W Garfield St, Phoenix, AZ 85009
$-505
Cash flow
-8.6%
Cash-on-Cash Return
3.7%
Cap rate
0.5%
Rent to Value Ratio
Active
$335,000
5
bds
|
2
ba
|
1,570
sqft
|
built
1946
3215 W Garfield St, Phoenix, AZ 85009
$-323
Cash flow
-5.0%
Cash-on-Cash Return
4.5%
Cap rate
0.6%
Rent to Value Ratio

Active
$533,000
3
bds
|
2
ba
|
1,810
sqft
|
built
1951
2740 N 21st Dr, Phoenix, AZ 85009
$-610
Cash flow
-6.0%
Cash-on-Cash Return
4.3%
Cap rate
0.6%
Rent to Value Ratio
Active
$310,000
3
bds
|
1
ba
|
1,050
sqft
|
built
1948
3702 W Sherman St, Phoenix, AZ 85009
$-435
Cash flow
-7.3%
Cash-on-Cash Return
4.0%
Cap rate
0.5%
Rent to Value Ratio
Active
$370,000
4
bds
|
2
ba
|
1,269
sqft
|
built
1954
3308 W Windsor Ave, Phoenix, AZ 85009
$-684
Cash flow
-9.6%
Cash-on-Cash Return
3.5%
Cap rate
0.5%
Rent to Value Ratio
Active
$475,000
5
bds
|
3
ba
|
3,197
sqft
|
built
1954
3002 W Latham St, Phoenix, AZ 85009
$-247
Cash flow
-2.7%
Cash-on-Cash Return
5.1%
Cap rate
0.6%
Rent to Value Ratio
Active
$275,000
3
bds
|
2
ba
|
1,264
sqft
|
built
1948
3145 W Monte Vista Rd, Phoenix, AZ 85009
$-295
Cash flow
-5.6%
Cash-on-Cash Return
4.4%
Cap rate
0.6%
Rent to Value Ratio
Active
$265,000
2
bds
|
1
ba
|
930
sqft
|
built
1945
1916 W Tonto St, Phoenix, AZ 85009
$-35
Cash flow
-0.7%
Cash-on-Cash Return
5.5%
Cap rate
0.7%
Rent to Value Ratio
Active
$399,950
3
bds
|
2
ba
|
1,461
sqft
|
built
2022
2130 W Sherman St, Phoenix, AZ 85009
$-896
Cash flow
-11.7%
Cash-on-Cash Return
3.0%
Cap rate
0.4%
Rent to Value Ratio
Active
$350,000
bds
|
0
ba
|
0
sqft
|
built
1955
2801 W Garfield St, Phoenix, AZ 85009
$-1,024
Cash flow
-15.3%
Cash-on-Cash Return
2.2%
Cap rate
0.3%
Rent to Value Ratio
Active
$289,900
3
bds
|
1
ba
|
1,026
sqft
|
built
1958
3914 W Palm Ln, Phoenix, AZ 85009
$-319
Cash flow
-5.7%
Cash-on-Cash Return
4.4%
Cap rate
0.6%
Rent to Value Ratio

Active
$345,000
3
bds
|
2
ba
|
1,100
sqft
|
built
1955
3408 W Virginia Ave, Phoenix, AZ 85009
$-720
Cash flow
-10.9%
Cash-on-Cash Return
3.2%
Cap rate
0.4%
Rent to Value Ratio
Active
$370,000
3
bds
|
2
ba
|
1,210
sqft
|
built
1948
3402 W Tonto St, Phoenix, AZ 85009
$-680
Cash flow
-9.6%
Cash-on-Cash Return
3.5%
Cap rate
0.4%
Rent to Value Ratio
Active
$1,250,000
bds
|
0
ba
|
0
sqft
|
built
1946
3601 W Melvin St, Phoenix, AZ 85009
$-5,012
Cash flow
-20.9%
Cash-on-Cash Return
0.9%
Cap rate
0.1%
Rent to Value Ratio
Active
$655,000
3
bds
|
3
ba
|
2,122
sqft
|
built
1956
2017 W Edgemont Ave, Phoenix, AZ 85009
$-1,500
Cash flow
-11.9%
Cash-on-Cash Return
2.9%
Cap rate
0.4%
Rent to Value Ratio
Active
$225,000
2
bds
|
1
ba
|
690
sqft
|
built
1948
3215 W Taylor St, Phoenix, AZ 85009
$-253
Cash flow
-5.9%
Cash-on-Cash Return
4.3%
Cap rate
0.6%
Rent to Value Ratio
Active
$979,500
bds
|
0
ba
|
0
sqft
|
built
1935
2002 W Jefferson St, Phoenix, AZ 85009
$-3,740
Cash flow
-19.9%
Cash-on-Cash Return
1.1%
Cap rate
0.1%
Rent to Value Ratio
Active
$310,000
3
bds
|
1
ba
|
880
sqft
|
built
1958
3935 W Palm Ln, Phoenix, AZ 85009
$-544
Cash flow
-9.2%
Cash-on-Cash Return
3.6%
Cap rate
0.5%
Rent to Value Ratio
Active
$399,000
3
bds
|
2
ba
|
1,782
sqft
|
built
1953
3614 W Granada Rd, Phoenix, AZ 85009
$-342
Cash flow
-4.5%
Cash-on-Cash Return
4.6%
Cap rate
0.6%
Rent to Value Ratio
Active
$339,990
3
bds
|
1
ba
|
1,259
sqft
|
built
1959
3944 W Wilshire Dr, Phoenix, AZ 85009
$-284
Cash flow
-4.4%
Cash-on-Cash Return
4.7%
Cap rate
0.6%
Rent to Value Ratio

Active
$299,000
2
bds
|
2
ba
|
850
sqft
|
built
2000
1646 S 28th Dr, Phoenix, AZ 85009
$-449
Cash flow
-7.8%
Cash-on-Cash Return
3.9%
Cap rate
0.5%
Rent to Value Ratio
Active
$325,000
3
bds
|
2
ba
|
988
sqft
|
built
1953
1802 N 36th Ave, Phoenix, AZ 85009
$-572
Cash flow
-9.2%
Cash-on-Cash Return
3.6%
Cap rate
0.4%
Rent to Value Ratio
Active
$375,000
4
bds
|
2
ba
|
1,469
sqft
|
built
1955
3801 W Wilshire Dr, Phoenix, AZ 85009
$-341
Cash flow
-4.7%
Cash-on-Cash Return
4.6%
Cap rate
0.6%
Rent to Value Ratio
Active
$379,000
3
bds
|
1
ba
|
960
sqft
|
built
1946
2435 W Yuma St, Phoenix, AZ 85009
$-661
Cash flow
-9.1%
Cash-on-Cash Return
3.6%
Cap rate
0.4%
Rent to Value Ratio