85020 Investment Properties for Sale
Browse homes for sale and investment properties in 85020. Refine your search by price, property type, or more.
Best cash flowing properties in 85020

Active
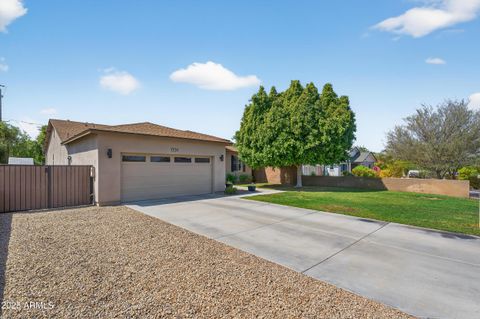
$360,000
3
bds
|
2
ba
|
1,116
sqft
|
built
1959
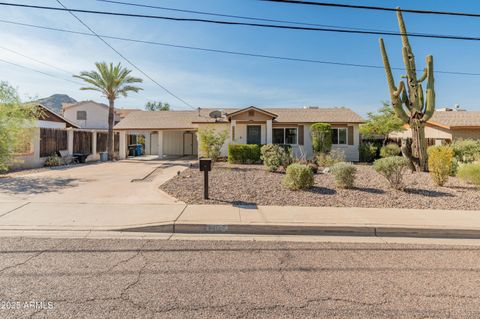
1216 E Desert Park Ln, Phoenix, AZ 85020
$-306
Cash flow
-4.4%
Cash-on-Cash Return
4.7%
Cap rate
0.6%
Rent to Value Ratio
Active
$229,000
2
bds
|
1
ba
|
874
sqft
|
built
1972
7550 N 12th St, Phoenix, AZ 85020
$-328
Cash flow
-7.5%
Cash-on-Cash Return
4.0%
Cap rate
0.7%
Rent to Value Ratio
124 out of 135 properties for sale in 85020
Limited Results Shown
Create a free account, or log in to reveal all property listings and enjoy the complete experience.
Active
$249,900
3
bds
|
2
ba
|
928
sqft
|
built
1975
10217 N 7th Pl, Phoenix, AZ 85020
$-386
Cash flow
-8.1%
Cash-on-Cash Return
3.8%
Cap rate
0.7%
Rent to Value Ratio
Active
$395,000
3
bds
|
2
ba
|
1,389
sqft
|
built
1972
1432 E Purdue Ave, Phoenix, AZ 85020
$-581
Cash flow
-7.7%
Cash-on-Cash Return
3.9%
Cap rate
0.5%
Rent to Value Ratio

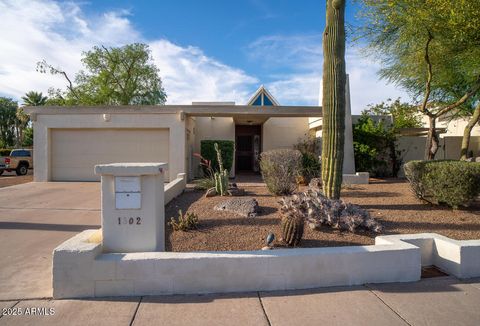
Active
$639,777
4
bds
|
2
ba
|
1,596
sqft
|
built
1958
1002 E Butler Dr, Phoenix, AZ 85020
$-1,565
Cash flow
-12.8%
Cash-on-Cash Return
2.7%
Cap rate
0.4%
Rent to Value Ratio
Active
$267,000
2
bds
|
2
ba
|
1,038
sqft
|
built
1986
10410 N Cave Creek Rd, Phoenix, AZ 85020
$-446
Cash flow
-8.7%
Cash-on-Cash Return
3.7%
Cap rate
0.7%
Rent to Value Ratio
Active
$760,000
3
bds
|
2
ba
|
1,816
sqft
|
built
2014
1331 E Kaler Dr, Phoenix, AZ 85020
$-1,414
Cash flow
-9.7%
Cash-on-Cash Return
3.4%
Cap rate
0.5%
Rent to Value Ratio
Active
$1,250,000
4
bds
|
3
ba
|
3,901
sqft
|
built
1973
1522 E Northern Ave, Phoenix, AZ 85020
$-713
Cash flow
-3.0%
Cash-on-Cash Return
5.0%
Cap rate
0.6%
Rent to Value Ratio
Active
$600,000
3
bds
|
2
ba
|
1,316
sqft
|
built
1904
717 E Myrtle Ave, Phoenix, AZ 85020
$-1,117
Cash flow
-9.7%
Cash-on-Cash Return
3.4%
Cap rate
0.5%
Rent to Value Ratio
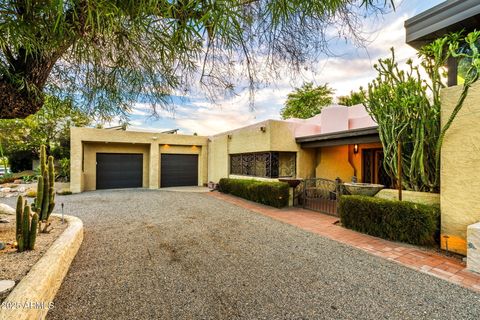
Active
$925,000
3
bds
|
3
ba
|
2,682
sqft
|
built
1996
8112 N 10th Pl, Phoenix, AZ 85020
$-1,847
Cash flow
-10.4%
Cash-on-Cash Return
3.3%
Cap rate
0.5%
Rent to Value Ratio
Active
$740,000
3
bds
|
3
ba
|
1,813
sqft
|
built
2017
1717 E Morten Ave, Phoenix, AZ 85020
$-1,488
Cash flow
-10.5%
Cash-on-Cash Return
3.3%
Cap rate
0.5%
Rent to Value Ratio
Active
$599,000
3
bds
|
3
ba
|
1,824
sqft
|
built
1969
1212 E Echo Ln, Phoenix, AZ 85020
$-795
Cash flow
-6.9%
Cash-on-Cash Return
4.1%
Cap rate
0.5%
Rent to Value Ratio
Active
$675,000
bds
|
0
ba
|
0
sqft
|
built
1973
733 E Hatcher Rd, Phoenix, AZ 85020
$-1,760
Cash flow
-13.6%
Cash-on-Cash Return
2.5%
Cap rate
0.3%
Rent to Value Ratio
Active
$475,000
3
bds
|
2
ba
|
1,440
sqft
|
built
1973
811 E Brown St, Phoenix, AZ 85020
$-1,032
Cash flow
-11.3%
Cash-on-Cash Return
3.1%
Cap rate
0.4%
Rent to Value Ratio
Active
$245,000
3
bds
|
2
ba
|
952
sqft
|
built
1972
1130 E Butler Dr, Phoenix, AZ 85020
$-420
Cash flow
-8.9%
Cash-on-Cash Return
3.6%
Cap rate
0.7%
Rent to Value Ratio

Active
$745,900
3
bds
|
3
ba
|
2,430
sqft
|
built
1994
8101 N 13th Pl, Phoenix, AZ 85020
$-1,103
Cash flow
-7.7%
Cash-on-Cash Return
3.9%
Cap rate
0.5%
Rent to Value Ratio
Active
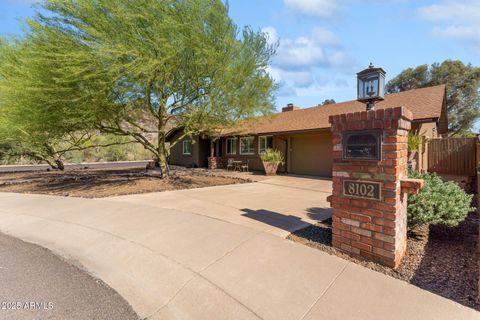
$799,999
3
bds
|
2
ba
|
2,327
sqft
|
built
1979
8102 N Dreamy Draw Dr, Phoenix, AZ 85020
$-1,962
Cash flow
-12.8%
Cash-on-Cash Return
2.7%
Cap rate
0.4%
Rent to Value Ratio
Active
$538,000
4
bds
|
2
ba
|
1,970
sqft
|
built
1962
1340 E Golden Ln, Phoenix, AZ 85020
$-779
Cash flow
-7.6%
Cash-on-Cash Return
3.9%
Cap rate
0.5%
Rent to Value Ratio
Active
$308,000
3
bds
|
2
ba
|
1,220
sqft
|
built
1992
750 E Northern Ave, Phoenix, AZ 85020
$-334
Cash flow
-5.7%
Cash-on-Cash Return
4.4%
Cap rate
0.7%
Rent to Value Ratio
Active
$399,995
3
bds
|
1
ba
|
999
sqft
|
built
1987
1407 E Mountain View Rd, Phoenix, AZ 85020
$-588
Cash flow
-7.7%
Cash-on-Cash Return
3.9%
Cap rate
0.5%
Rent to Value Ratio

Active
$327,200
2
bds
|
2
ba
|
881
sqft
|
built
1965
8145 N Central Ave, Phoenix, AZ 85020
$-830
Cash flow
-13.2%
Cash-on-Cash Return
2.6%
Cap rate
0.5%
Rent to Value Ratio
Active
$725,000
3
bds
|
4
ba
|
2,109
sqft
|
built
2018
1717 E Morten Ave, Phoenix, AZ 85020
$-1,920
Cash flow
-13.8%
Cash-on-Cash Return
2.5%
Cap rate
0.4%
Rent to Value Ratio
Active
$1,749,000
4
bds
|
4
ba
|
2,701
sqft
|
built
2021
513 E Hayward Ave, Phoenix, AZ 85020
$-6,297
Cash flow
-18.8%
Cash-on-Cash Return
1.4%
Cap rate
0.2%
Rent to Value Ratio
Active
$394,500
2
bds
|
1
ba
|
1,079
sqft
|
built
1947
9520 N Central Ave, Phoenix, AZ 85020
$-346
Cash flow
-4.6%
Cash-on-Cash Return
4.6%
Cap rate
0.6%
Rent to Value Ratio
Active
$675,000
3
bds
|
3
ba
|
3,044
sqft
|
built
2005
13 E Foothill Dr, Phoenix, AZ 85020
$-1,101
Cash flow
-8.5%
Cash-on-Cash Return
3.7%
Cap rate
0.5%
Rent to Value Ratio
Active
$305,000
2
bds
|
2
ba
|
1,017
sqft
|
built
2004
9820 N Central Ave, Phoenix, AZ 85020
$-736
Cash flow
-12.6%
Cash-on-Cash Return
2.8%
Cap rate
0.5%
Rent to Value Ratio

Active
$660,000
3
bds
|
3
ba
|
1,900
sqft
|
built
1997
9932 N 16th Pl E, Phoenix, AZ 85020
$-1,379
Cash flow
-10.9%
Cash-on-Cash Return
3.2%
Cap rate
0.4%
Rent to Value Ratio
Active
$999,000
3
bds
|
3
ba
|
3,062
sqft
|
built
1956
709 E Hayward Ave, Phoenix, AZ 85020
$-1,766
Cash flow
-9.2%
Cash-on-Cash Return
3.6%
Cap rate
0.5%
Rent to Value Ratio

Active
$935,000
4
bds
|
3
ba
|
2,859
sqft
|
built
1975
7232 N 22nd St, Phoenix, AZ 85020
$-1,892
Cash flow
-10.6%
Cash-on-Cash Return
3.3%
Cap rate
0.5%
Rent to Value Ratio
Active
$749,900
4
bds
|
3
ba
|
2,288
sqft
|
built
1964
8436 N 13th Pl, Phoenix, AZ 85020
$-2,210
Cash flow
-15.4%
Cash-on-Cash Return
2.1%
Cap rate
0.3%
Rent to Value Ratio

Active
$2,300,000
5
bds
|
6
ba
|
3,704
sqft
|
built
2023
7851 N Central Ave, Phoenix, AZ 85020
$-8,375
Cash flow
-19.0%
Cash-on-Cash Return
1.3%
Cap rate
0.2%
Rent to Value Ratio
Active
$719,000
3
bds
|
2
ba
|
2,302
sqft
|
built
1970
1302 E Nicolet Ave, Phoenix, AZ 85020
$-1,001
Cash flow
-7.3%
Cash-on-Cash Return
4.0%
Cap rate
0.6%
Rent to Value Ratio
Active
$357,000
3
bds
|
3
ba
|
1,308
sqft
|
built
1974
8414 N Central Ave, Phoenix, AZ 85020
$-779
Cash flow
-11.4%
Cash-on-Cash Return
3.1%
Cap rate
0.6%
Rent to Value Ratio
Active
$825,000
4
bds
|
3
ba
|
2,110
sqft
|
built
1954
710 E Hayward Ave, Phoenix, AZ 85020
$-1,107
Cash flow
-7.0%
Cash-on-Cash Return
4.1%
Cap rate
0.6%
Rent to Value Ratio

Active
$320,000
2
bds
|
2
ba
|
1,017
sqft
|
built
2004
9820 N Central Ave, Phoenix, AZ 85020
$-382
Cash flow
-6.2%
Cash-on-Cash Return
4.2%
Cap rate
0.7%
Rent to Value Ratio
Active
$900,000
3
bds
|
3
ba
|
2,470
sqft
|
built
1959
7042 N 13th St, Phoenix, AZ 85020
$-2,090
Cash flow
-12.1%
Cash-on-Cash Return
2.9%
Cap rate
0.4%
Rent to Value Ratio

Active
$750,000
3
bds
|
2
ba
|
2,077
sqft
|
built
1956
735 E Northern Ave, Phoenix, AZ 85020
$-711
Cash flow
-4.9%
Cash-on-Cash Return
4.5%
Cap rate
0.6%
Rent to Value Ratio
Active
$674,990
4
bds
|
3
ba
|
2,826
sqft
|
built
2004
8149 N 13th Pl, Phoenix, AZ 85020
$-1,164
Cash flow
-9.0%
Cash-on-Cash Return
3.6%
Cap rate
0.5%
Rent to Value Ratio
Active
$850,000
4
bds
|
2
ba
|
2,155
sqft
|
built
1959
609 E Winter Dr, Phoenix, AZ 85020
$-1,963
Cash flow
-12.0%
Cash-on-Cash Return
2.9%
Cap rate
0.4%
Rent to Value Ratio
Active
$365,000
3
bds
|
2
ba
|
1,260
sqft
|
built
1944
8915 N 9th Pl, Phoenix, AZ 85020
$-519
Cash flow
-7.4%
Cash-on-Cash Return
4.0%
Cap rate
0.5%
Rent to Value Ratio