85028 Investment Properties for Sale
Browse homes for sale and investment properties in 85028. Refine your search by price, property type, or more.
Best cash flowing properties in 85028

Active
$449,999
2
bds
|
2
ba
|
1,234
sqft
|
built
2007
11640 N Tatum Blvd, Phoenix, AZ 85028
$-446
Cash flow
-5.2%
Cash-on-Cash Return
4.5%
Cap rate
0.7%
Rent to Value Ratio
Active
$655,000
4
bds
|
3
ba
|
2,235
sqft
|
built
1970
2850 E Cortez St, Phoenix, AZ 85028
$-503
Cash flow
-4.0%
Cash-on-Cash Return
4.8%
Cap rate
0.6%
Rent to Value Ratio
39 out of 42 properties for sale in 85028
Limited Results Shown
Create a free account, or log in to reveal all property listings and enjoy the complete experience.
Active
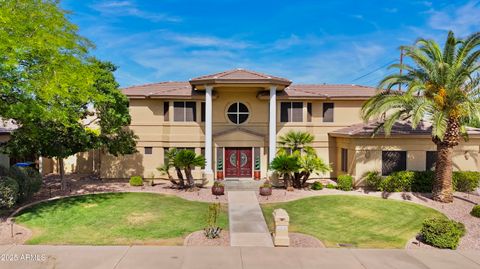
$1,474,000
5
bds
|
3
ba
|
2,844
sqft
|
built
1974
9046 N 28th St, Phoenix, AZ 85028
$-4,042
Cash flow
-14.3%
Cash-on-Cash Return
2.4%
Cap rate
0.3%
Rent to Value Ratio
Active
$730,000
4
bds
|
2
ba
|
2,294
sqft
|
built
1978
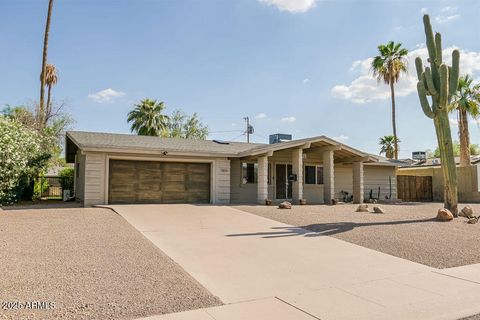
2320 E Shangri La Rd, Phoenix, AZ 85028
$-937
Cash flow
-6.7%
Cash-on-Cash Return
4.1%
Cap rate
0.5%
Rent to Value Ratio
Active
$849,000
4
bds
|
3
ba
|
2,349
sqft
|
built
1969
11841 N 24th St, Phoenix, AZ 85028
$-2,270
Cash flow
-13.9%
Cash-on-Cash Return
2.5%
Cap rate
0.3%
Rent to Value Ratio

Active
$764,900
3
bds
|
2
ba
|
2,307
sqft
|
built
1974
2330 E Sahuaro Dr, Phoenix, AZ 85028
$-1,815
Cash flow
-12.4%
Cash-on-Cash Return
2.8%
Cap rate
0.4%
Rent to Value Ratio

Active
$319,000
1
bds
|
1
ba
|
866
sqft
|
built
2008
11640 N Tatum Blvd, Phoenix, AZ 85028
$-645
Cash flow
-10.5%
Cash-on-Cash Return
3.3%
Cap rate
0.6%
Rent to Value Ratio
Active
$748,500
3
bds
|
2
ba
|
1,965
sqft
|
built
1964
2611 E Cheryl Dr, Phoenix, AZ 85028
$-1,560
Cash flow
-10.9%
Cash-on-Cash Return
3.2%
Cap rate
0.4%
Rent to Value Ratio
Active
$1,890,000
5
bds
|
6
ba
|
4,459
sqft
|
built
2001
10434 N 44th St, Phoenix, AZ 85028
$-4,556
Cash flow
-12.6%
Cash-on-Cash Return
2.8%
Cap rate
0.4%
Rent to Value Ratio

Active
$699,999
3
bds
|
2
ba
|
2,107
sqft
|
built
1972
11035 N 37th St, Phoenix, AZ 85028
$-1,372
Cash flow
-10.2%
Cash-on-Cash Return
3.3%
Cap rate
0.4%
Rent to Value Ratio
Active
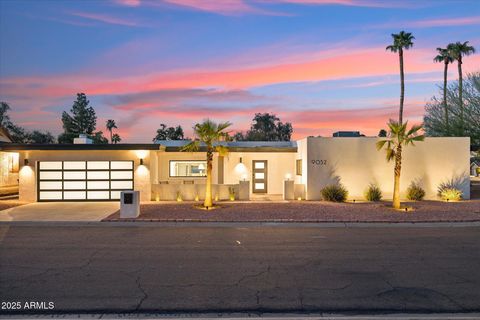
$1,195,000
4
bds
|
3
ba
|
2,413
sqft
|
built
1976
9052 N 29th St, Phoenix, AZ 85028
$-1,823
Cash flow
-8.0%
Cash-on-Cash Return
3.8%
Cap rate
0.5%
Rent to Value Ratio
Active
$930,000
4
bds
|
2
ba
|
2,231
sqft
|
built
1975
4114 E Desert Cove Ave, Phoenix, AZ 85028
$-1,142
Cash flow
-6.4%
Cash-on-Cash Return
4.2%
Cap rate
0.5%
Rent to Value Ratio
Active
$645,000
2
bds
|
2
ba
|
1,566
sqft
|
built
1987
11840 N 40th Way, Phoenix, AZ 85028
$-1,745
Cash flow
-14.1%
Cash-on-Cash Return
2.4%
Cap rate
0.4%
Rent to Value Ratio
Active
$895,000
4
bds
|
2
ba
|
2,022
sqft
|
built
1974
2818 E Malapai Dr, Phoenix, AZ 85028
$-1,272
Cash flow
-7.4%
Cash-on-Cash Return
4.0%
Cap rate
0.5%
Rent to Value Ratio
Active
$695,000
4
bds
|
2
ba
|
1,766
sqft
|
built
1968
11020 N 39th St, Phoenix, AZ 85028
$-1,514
Cash flow
-11.4%
Cash-on-Cash Return
3.1%
Cap rate
0.4%
Rent to Value Ratio
Active
$1,450,000
4
bds
|
3
ba
|
2,186
sqft
|
built
2023
11039 N 42nd St, Phoenix, AZ 85028
$-2,717
Cash flow
-9.8%
Cash-on-Cash Return
3.4%
Cap rate
0.4%
Rent to Value Ratio
Active
$725,000
4
bds
|
3
ba
|
2,004
sqft
|
built
1961
2809 E Shangri La Rd, Phoenix, AZ 85028
$-1,594
Cash flow
-11.5%
Cash-on-Cash Return
3.0%
Cap rate
0.4%
Rent to Value Ratio
Active
$650,000
3
bds
|
2
ba
|
1,906
sqft
|
built
1970
3926 E Cortez St, Phoenix, AZ 85028
$-1,324
Cash flow
-10.6%
Cash-on-Cash Return
3.2%
Cap rate
0.4%
Rent to Value Ratio
Active
$624,900
4
bds
|
2
ba
|
1,890
sqft
|
built
1965
3710 E Altadena Ave, Phoenix, AZ 85028
$-1,475
Cash flow
-12.3%
Cash-on-Cash Return
2.8%
Cap rate
0.4%
Rent to Value Ratio
Active
$654,500
3
bds
|
2
ba
|
1,958
sqft
|
built
1958
11011 N 39th St, Phoenix, AZ 85028
$-1,054
Cash flow
-8.4%
Cash-on-Cash Return
3.7%
Cap rate
0.5%
Rent to Value Ratio
Active
$759,900
3
bds
|
2
ba
|
2,249
sqft
|
built
1978
2366 E Becker Ln, Phoenix, AZ 85028
$-780
Cash flow
-5.4%
Cash-on-Cash Return
4.4%
Cap rate
0.6%
Rent to Value Ratio
Active
$785,000
3
bds
|
2
ba
|
1,841
sqft
|
built
1975
4079 E Shangri La Rd, Phoenix, AZ 85028
$-2,158
Cash flow
-14.3%
Cash-on-Cash Return
2.4%
Cap rate
0.3%
Rent to Value Ratio
Active
$615,000
3
bds
|
2
ba
|
2,431
sqft
|
built
1970
3924 E Cortez St, Phoenix, AZ 85028
$-642
Cash flow
-5.4%
Cash-on-Cash Return
4.4%
Cap rate
0.6%
Rent to Value Ratio
Active
$645,000
4
bds
|
2
ba
|
1,972
sqft
|
built
1970
3010 E Cortez St, Phoenix, AZ 85028
$-1,219
Cash flow
-9.9%
Cash-on-Cash Return
3.4%
Cap rate
0.4%
Rent to Value Ratio
Active
$675,000
3
bds
|
2
ba
|
1,618
sqft
|
built
1960
3010 E Yucca St, Phoenix, AZ 85028
$-1,605
Cash flow
-12.4%
Cash-on-Cash Return
2.8%
Cap rate
0.4%
Rent to Value Ratio
Active
$775,000
3
bds
|
2
ba
|
1,939
sqft
|
built
1974
2426 E Sahuaro Dr, Phoenix, AZ 85028
$-1,739
Cash flow
-11.7%
Cash-on-Cash Return
3.0%
Cap rate
0.4%
Rent to Value Ratio
Active
$675,000
3
bds
|
3
ba
|
1,861
sqft
|
built
1987
4020 E Laurel Ln, Phoenix, AZ 85028
$-1,601
Cash flow
-12.4%
Cash-on-Cash Return
2.8%
Cap rate
0.4%
Rent to Value Ratio
Active
$895,000
3
bds
|
2
ba
|
2,247
sqft
|
built
1974
9412 N 33rd Way, Phoenix, AZ 85028
$-1,178
Cash flow
-6.9%
Cash-on-Cash Return
4.1%
Cap rate
0.5%
Rent to Value Ratio
Active
$1,050,000
5
bds
|
3
ba
|
2,693
sqft
|
built
1970
10240 N 34th Pl, Phoenix, AZ 85028
$-1,485
Cash flow
-7.4%
Cash-on-Cash Return
4.0%
Cap rate
0.5%
Rent to Value Ratio

Active
$625,000
3
bds
|
2
ba
|
1,513
sqft
|
built
1971
3507 E Cortez St, Phoenix, AZ 85028
$-711
Cash flow
-5.9%
Cash-on-Cash Return
4.3%
Cap rate
0.6%
Rent to Value Ratio
Active
$724,900
3
bds
|
2
ba
|
2,147
sqft
|
built
1979
2324 E Cortez St, Phoenix, AZ 85028
$-1,525
Cash flow
-11.0%
Cash-on-Cash Return
3.2%
Cap rate
0.4%
Rent to Value Ratio
Active
$444,900
2
bds
|
2
ba
|
1,147
sqft
|
built
2007
11640 N Tatum Blvd, Phoenix, AZ 85028
$-1,182
Cash flow
-13.9%
Cash-on-Cash Return
2.5%
Cap rate
0.5%
Rent to Value Ratio
Active
$645,000
3
bds
|
2
ba
|
1,687
sqft
|
built
1960
3050 E Cholla St, Phoenix, AZ 85028
$-1,496
Cash flow
-12.1%
Cash-on-Cash Return
2.9%
Cap rate
0.4%
Rent to Value Ratio
Active
$850,000
4
bds
|
2
ba
|
2,097
sqft
|
built
1973
2550 E Sahuaro Dr, Phoenix, AZ 85028
$-785
Cash flow
-4.8%
Cash-on-Cash Return
4.6%
Cap rate
0.6%
Rent to Value Ratio
Active
$599,900
4
bds
|
3
ba
|
2,195
sqft
|
built
2019
3128 E Cheryl Dr, Phoenix, AZ 85028
$-929
Cash flow
-8.1%
Cash-on-Cash Return
3.8%
Cap rate
0.6%
Rent to Value Ratio
Active
$695,000
4
bds
|
2
ba
|
2,047
sqft
|
built
1970
3033 E Sierra St, Phoenix, AZ 85028
$-1,014
Cash flow
-7.6%
Cash-on-Cash Return
3.9%
Cap rate
0.5%
Rent to Value Ratio
Active
$830,000
2
bds
|
3
ba
|
2,802
sqft
|
built
1986
2537 E Vogel Ave, Phoenix, AZ 85028
$-1,983
Cash flow
-12.5%
Cash-on-Cash Return
2.8%
Cap rate
0.4%
Rent to Value Ratio
Active
$825,000
3
bds
|
3
ba
|
2,365
sqft
|
built
1971
3529 E Cannon Dr, Phoenix, AZ 85028
$-1,133
Cash flow
-7.2%
Cash-on-Cash Return
4.0%
Cap rate
0.5%
Rent to Value Ratio
Active
$1,450,000
5
bds
|
3
ba
|
2,360
sqft
|
built
1975
11018 N 42nd St, Phoenix, AZ 85028
$-4,589
Cash flow
-16.5%
Cash-on-Cash Return
1.9%
Cap rate
0.2%
Rent to Value Ratio