85032 Investment Properties for Sale
Browse homes for sale and investment properties in 85032. Refine your search by price, property type, or more.
Best cash flowing properties in 85032

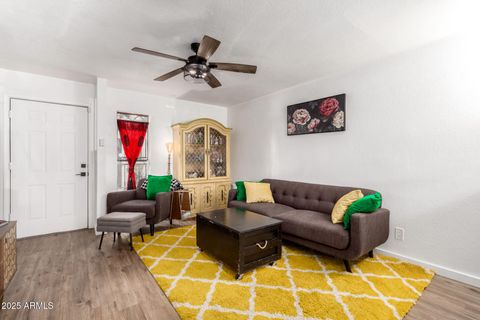
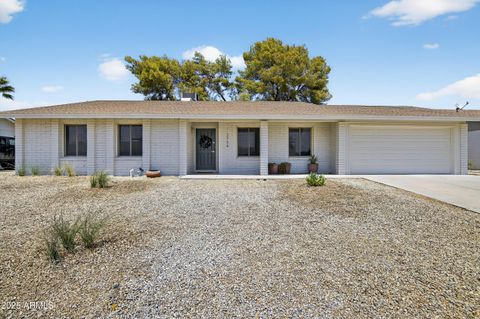
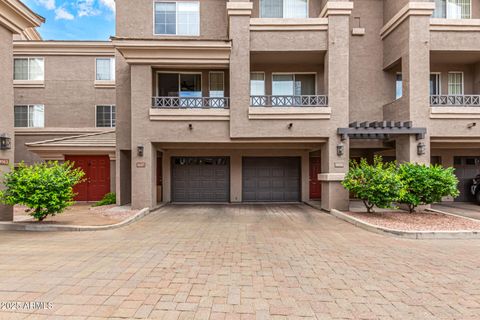
Active
$155,000
3
bds
|
2
ba
|
836
sqft
|
built
1983
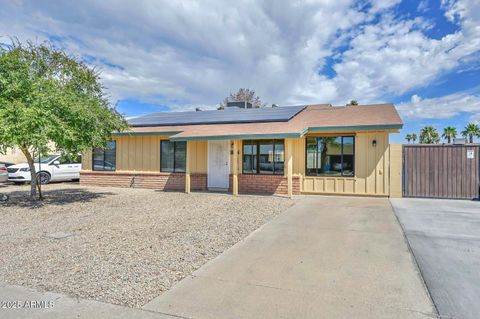
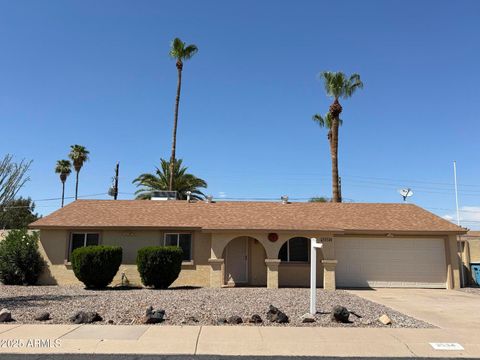
18202 N Cave Creek Rd, Phoenix, AZ 85032
$-134
Cash flow
-4.5%
Cash-on-Cash Return
4.6%
Cap rate
0.9%
Rent to Value Ratio
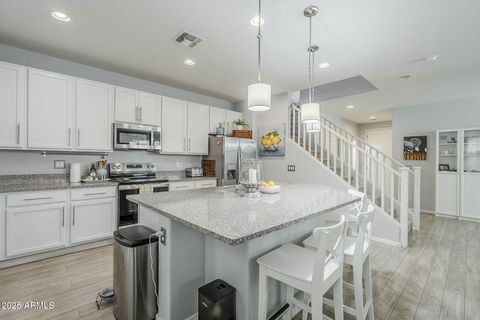
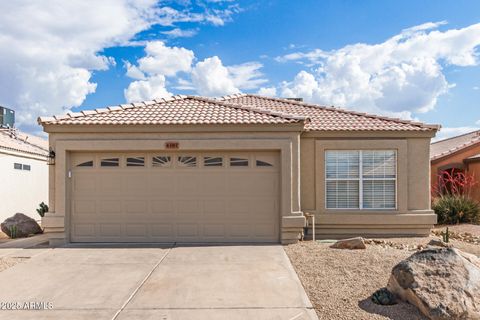
Active
$223,750
2
bds
|
2
ba
|
952
sqft
|
built
1984
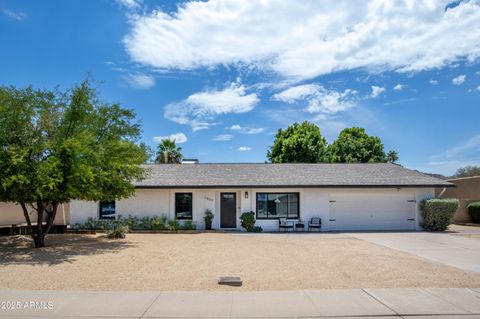
2431 E Tracy Ln, Phoenix, AZ 85032
$-221
Cash flow
-5.2%
Cash-on-Cash Return
4.5%
Cap rate
0.7%
Rent to Value Ratio
164 out of 172 properties for sale in 85032
Limited Results Shown
Create a free account, or log in to reveal all property listings and enjoy the complete experience.
Active
$575,000
3
bds
|
3
ba
|
2,020
sqft
|
built
2014
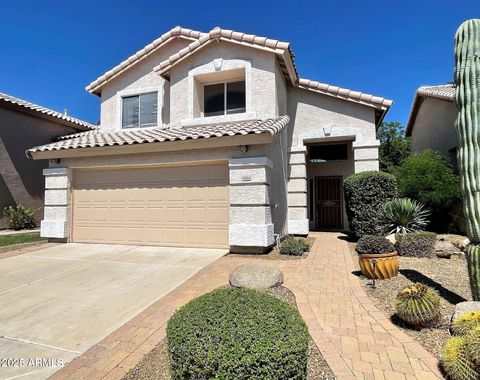
4727 E Betty Elyse Ln, Phoenix, AZ 85032
$-1,135
Cash flow
-10.3%
Cash-on-Cash Return
3.3%
Cap rate
0.5%
Rent to Value Ratio
Active
$224,900
2
bds
|
2
ba
|
952
sqft
|
built
1984
2437 E Tracy Ln, Phoenix, AZ 85032
$-369
Cash flow
-8.6%
Cash-on-Cash Return
3.7%
Cap rate
0.6%
Rent to Value Ratio
Active
$174,900
1
bds
|
1
ba
|
705
sqft
|
built
1981
15601 N 27th St, Phoenix, AZ 85032
$-339
Cash flow
-10.1%
Cash-on-Cash Return
3.4%
Cap rate
0.6%
Rent to Value Ratio

Active
$699,900
4
bds
|
3
ba
|
2,105
sqft
|
built
1990
4536 E Michigan Ave, Phoenix, AZ 85032
$-1,048
Cash flow
-7.8%
Cash-on-Cash Return
3.9%
Cap rate
0.5%
Rent to Value Ratio
Active
$674,999
4
bds
|
2
ba
|
1,890
sqft
|
built
1976
3754 E Wethersfield Rd, Phoenix, AZ 85032
$-1,674
Cash flow
-12.9%
Cash-on-Cash Return
2.7%
Cap rate
0.4%
Rent to Value Ratio

Active
$745,000
3
bds
|
2
ba
|
2,181
sqft
|
built
1985
4407 E Le Marche Ave, Phoenix, AZ 85032
$-1,443
Cash flow
-10.1%
Cash-on-Cash Return
3.4%
Cap rate
0.5%
Rent to Value Ratio

Active
$649,900
3
bds
|
2
ba
|
2,041
sqft
|
built
1995
4357 E Angela Dr, Phoenix, AZ 85032
$-1,290
Cash flow
-10.4%
Cash-on-Cash Return
3.3%
Cap rate
0.4%
Rent to Value Ratio

Active
$690,000
3
bds
|
2
ba
|
2,238
sqft
|
built
1977
14848 N 29th St, Phoenix, AZ 85032
$-1,541
Cash flow
-11.7%
Cash-on-Cash Return
3.0%
Cap rate
0.4%
Rent to Value Ratio

Active
$597,200
4
bds
|
3
ba
|
2,020
sqft
|
built
1979
3908 E Marilyn Rd, Phoenix, AZ 85032
$-1,380
Cash flow
-12.1%
Cash-on-Cash Return
2.9%
Cap rate
0.4%
Rent to Value Ratio
Active
$675,000
bds
|
0
ba
|
0
sqft
|
built
1982
2819 E Monte Cristo Ave, Phoenix, AZ 85032
$-2,067
Cash flow
-16.0%
Cash-on-Cash Return
2.0%
Cap rate
0.3%
Rent to Value Ratio

Active
$760,000
4
bds
|
2
ba
|
2,541
sqft
|
built
1979
14616 N 28th Pl, Phoenix, AZ 85032
$-1,359
Cash flow
-9.3%
Cash-on-Cash Return
3.5%
Cap rate
0.5%
Rent to Value Ratio
Active
$499,999
3
bds
|
2
ba
|
1,762
sqft
|
built
1979
16801 N 45th Pl, Phoenix, AZ 85032
$-846
Cash flow
-8.8%
Cash-on-Cash Return
3.6%
Cap rate
0.5%
Rent to Value Ratio

Active
$800,000
5
bds
|
3
ba
|
2,686
sqft
|
built
1990
14019 N 29th Pl, Phoenix, AZ 85032
$-1,886
Cash flow
-12.3%
Cash-on-Cash Return
2.9%
Cap rate
0.4%
Rent to Value Ratio
Active
$222,500
2
bds
|
2
ba
|
888
sqft
|
built
1983
15601 N 27th St, Phoenix, AZ 85032
$-430
Cash flow
-10.1%
Cash-on-Cash Return
3.4%
Cap rate
0.6%
Rent to Value Ratio

Active
$529,900
4
bds
|
3
ba
|
2,105
sqft
|
built
1990
4506 E Michigan Ave, Phoenix, AZ 85032
$-826
Cash flow
-8.1%
Cash-on-Cash Return
3.8%
Cap rate
0.5%
Rent to Value Ratio
Active
$459,500
3
bds
|
2
ba
|
1,570
sqft
|
built
1983
2732 E Villa Rita Dr, Phoenix, AZ 85032
$-762
Cash flow
-8.7%
Cash-on-Cash Return
3.7%
Cap rate
0.5%
Rent to Value Ratio

Active
$290,000
3
bds
|
3
ba
|
1,275
sqft
|
built
2006
15818 N 25th St, Phoenix, AZ 85032
$-468
Cash flow
-8.4%
Cash-on-Cash Return
3.7%
Cap rate
0.6%
Rent to Value Ratio
Active
$685,000
4
bds
|
2
ba
|
2,015
sqft
|
built
1978
2809 E Hillery Dr, Phoenix, AZ 85032
$-1,240
Cash flow
-9.4%
Cash-on-Cash Return
3.5%
Cap rate
0.5%
Rent to Value Ratio
Active
$335,000
2
bds
|
2
ba
|
1,000
sqft
|
built
1980
4554 E Paradise Village Pkwy N, Phoenix, AZ 85032
$-712
Cash flow
-11.1%
Cash-on-Cash Return
3.1%
Cap rate
0.5%
Rent to Value Ratio
Active
$589,000
3
bds
|
3
ba
|
1,596
sqft
|
built
1995
4034 E Anderson Dr, Phoenix, AZ 85032
$-1,102
Cash flow
-9.8%
Cash-on-Cash Return
3.4%
Cap rate
0.5%
Rent to Value Ratio

Active
$605,000
4
bds
|
2
ba
|
2,029
sqft
|
built
1974
2826 E Cactus Rd, Phoenix, AZ 85032
$-1,241
Cash flow
-10.7%
Cash-on-Cash Return
3.2%
Cap rate
0.4%
Rent to Value Ratio

Active
$689,900
4
bds
|
2
ba
|
2,204
sqft
|
built
1978
14830 N 28th Pl, Phoenix, AZ 85032
$-1,571
Cash flow
-11.9%
Cash-on-Cash Return
2.9%
Cap rate
0.4%
Rent to Value Ratio

Active
$800,000
3
bds
|
2
ba
|
1,953
sqft
|
built
1989
4340 E Nisbet Rd, Phoenix, AZ 85032
$-1,610
Cash flow
-10.5%
Cash-on-Cash Return
3.3%
Cap rate
0.4%
Rent to Value Ratio

Active
$400,000
3
bds
|
3
ba
|
1,618
sqft
|
built
2014
3113 E Danbury Rd, Phoenix, AZ 85032
$-688
Cash flow
-9.0%
Cash-on-Cash Return
3.6%
Cap rate
0.5%
Rent to Value Ratio

Active
$245,000
2
bds
|
2
ba
|
1,108
sqft
|
built
1985
15801 N 29th St, Phoenix, AZ 85032
$-358
Cash flow
-7.6%
Cash-on-Cash Return
3.9%
Cap rate
0.7%
Rent to Value Ratio
Active
$292,000
1
bds
|
1
ba
|
844
sqft
|
built
2001
4455 E Paradise Village Pkwy S, Phoenix, AZ 85032
$-585
Cash flow
-10.5%
Cash-on-Cash Return
3.3%
Cap rate
0.5%
Rent to Value Ratio

Active
$599,950
4
bds
|
2
ba
|
1,989
sqft
|
built
1969
4240 E Bluefield Ave, Phoenix, AZ 85032
$-864
Cash flow
-7.5%
Cash-on-Cash Return
4.0%
Cap rate
0.5%
Rent to Value Ratio
Active
$539,900
3
bds
|
2
ba
|
1,401
sqft
|
built
1995
4387 E Hartford Ave, Phoenix, AZ 85032
$-995
Cash flow
-9.6%
Cash-on-Cash Return
3.5%
Cap rate
0.5%
Rent to Value Ratio
Active
$539,000
4
bds
|
3
ba
|
1,937
sqft
|
built
1971
2902 E Corrine Dr, Phoenix, AZ 85032
$-1,080
Cash flow
-10.5%
Cash-on-Cash Return
3.3%
Cap rate
0.4%
Rent to Value Ratio

Active
$194,000
2
bds
|
2
ba
|
1,134
sqft
|
built
1984
16635 N Cave Creek Rd, Phoenix, AZ 85032
$-235
Cash flow
-6.3%
Cash-on-Cash Return
4.2%
Cap rate
0.7%
Rent to Value Ratio

Active
$289,999
1
bds
|
1
ba
|
850
sqft
|
built
1983
4303 E Cactus Rd, Phoenix, AZ 85032
$-918
Cash flow
-16.5%
Cash-on-Cash Return
1.9%
Cap rate
0.6%
Rent to Value Ratio

Active
$695,000
3
bds
|
2
ba
|
2,352
sqft
|
built
1994
3022 E Emile Zola Ave, Phoenix, AZ 85032
$-1,744
Cash flow
-13.1%
Cash-on-Cash Return
2.7%
Cap rate
0.4%
Rent to Value Ratio

Active
$2,495,000
6
bds
|
5
ba
|
4,604
sqft
|
built
2018
16224 N 43rd St, Phoenix, AZ 85032
$-9,224
Cash flow
-19.3%
Cash-on-Cash Return
1.2%
Cap rate
0.2%
Rent to Value Ratio
Active
$225,500
1
bds
|
1
ba
|
748
sqft
|
built
2005
18416 N Cave Creek Rd, Phoenix, AZ 85032
$-306
Cash flow
-7.1%
Cash-on-Cash Return
4.0%
Cap rate
0.7%
Rent to Value Ratio
Active
$425,000
3
bds
|
3
ba
|
1,292
sqft
|
built
1969
3534 E Friess Dr, Phoenix, AZ 85032
$-601
Cash flow
-7.4%
Cash-on-Cash Return
4.0%
Cap rate
0.5%
Rent to Value Ratio

Active
$749,999
4
bds
|
3
ba
|
2,145
sqft
|
built
1971
12444 N 33rd St, Phoenix, AZ 85032
$-1,779
Cash flow
-12.4%
Cash-on-Cash Return
2.8%
Cap rate
0.4%
Rent to Value Ratio
Active
$609,900
3
bds
|
3
ba
|
2,322
sqft
|
built
2014
4744 E Tierra Buena Ln, Phoenix, AZ 85032
$-1,324
Cash flow
-11.3%
Cash-on-Cash Return
3.1%
Cap rate
0.5%
Rent to Value Ratio
Active
$209,900
2
bds
|
2
ba
|
934
sqft
|
built
1986
16402 N 31st St, Phoenix, AZ 85032
$-404
Cash flow
-10.0%
Cash-on-Cash Return
3.4%
Cap rate
0.7%
Rent to Value Ratio