85051 Investment Properties for Sale
Browse homes for sale and investment properties in 85051. Refine your search by price, property type, or more.
Best cash flowing properties in 85051
Active
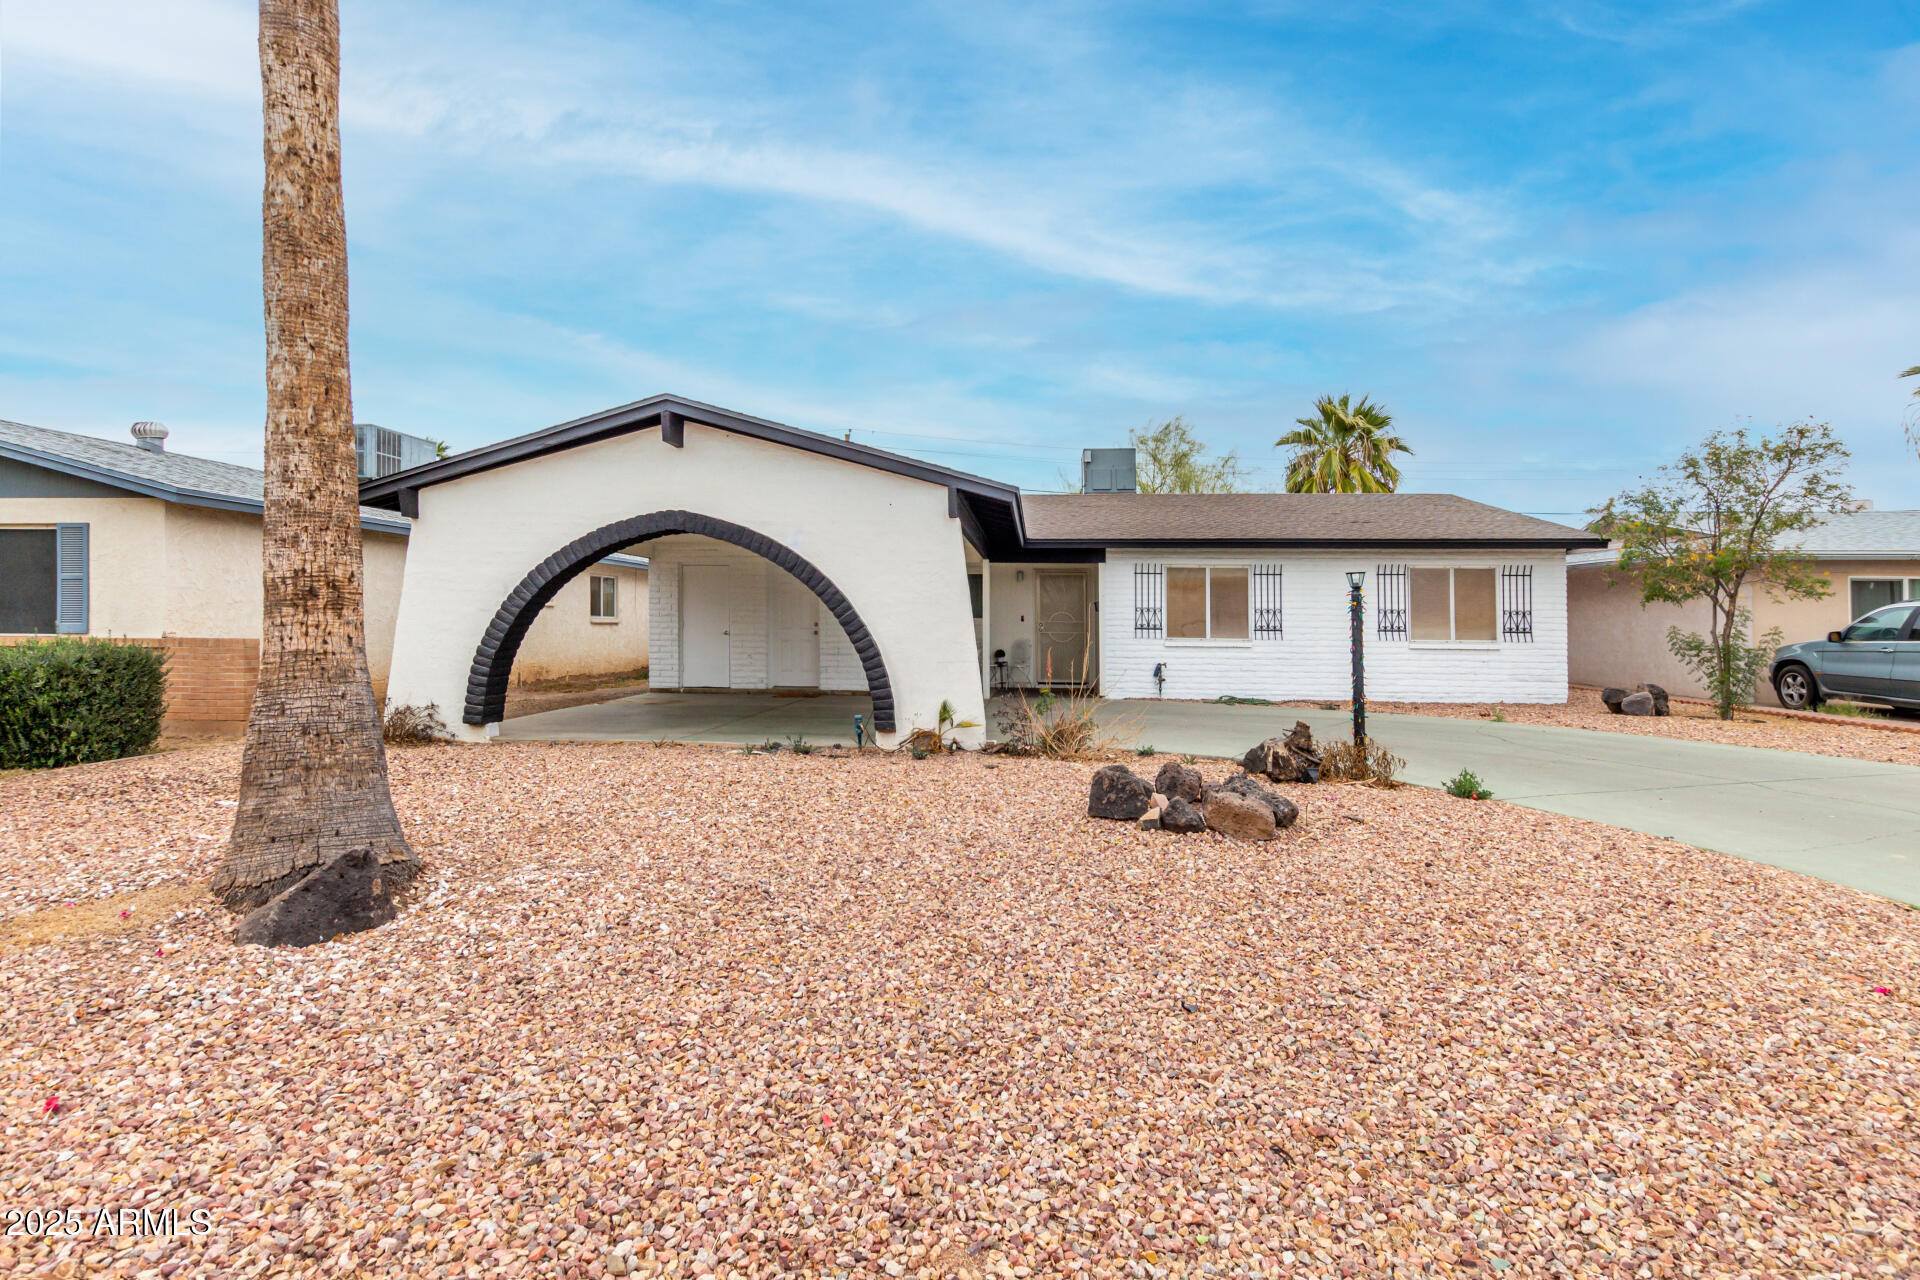
$162,360
2
bds
|
2
ba
|
960
sqft
|
built
1962
7101 N 36th Ave, Phoenix, AZ 85051
$-28
Cash flow
-0.9%
Cash-on-Cash Return
5.5%
Cap rate
1.0%
Rent to Value Ratio
Active
$169,900
2
bds
|
2
ba
|
922
sqft
|
built
1983
3131 W Cochise Dr, Phoenix, AZ 85051
$-113
Cash flow
-3.5%
Cash-on-Cash Return
4.9%
Cap rate
0.9%
Rent to Value Ratio
76 out of 78 properties for sale in 85051
Limited Results Shown
Create a free account, or log in to reveal all property listings and enjoy the complete experience.
Active
$419,999
4
bds
|
2
ba
|
1,777
sqft
|
built
1970
9615 N 34th Ave, Phoenix, AZ 85051
$-296
Cash flow
-3.7%
Cash-on-Cash Return
4.8%
Cap rate
0.6%
Rent to Value Ratio
Active
$409,900
3
bds
|
2
ba
|
1,808
sqft
|
built
1968
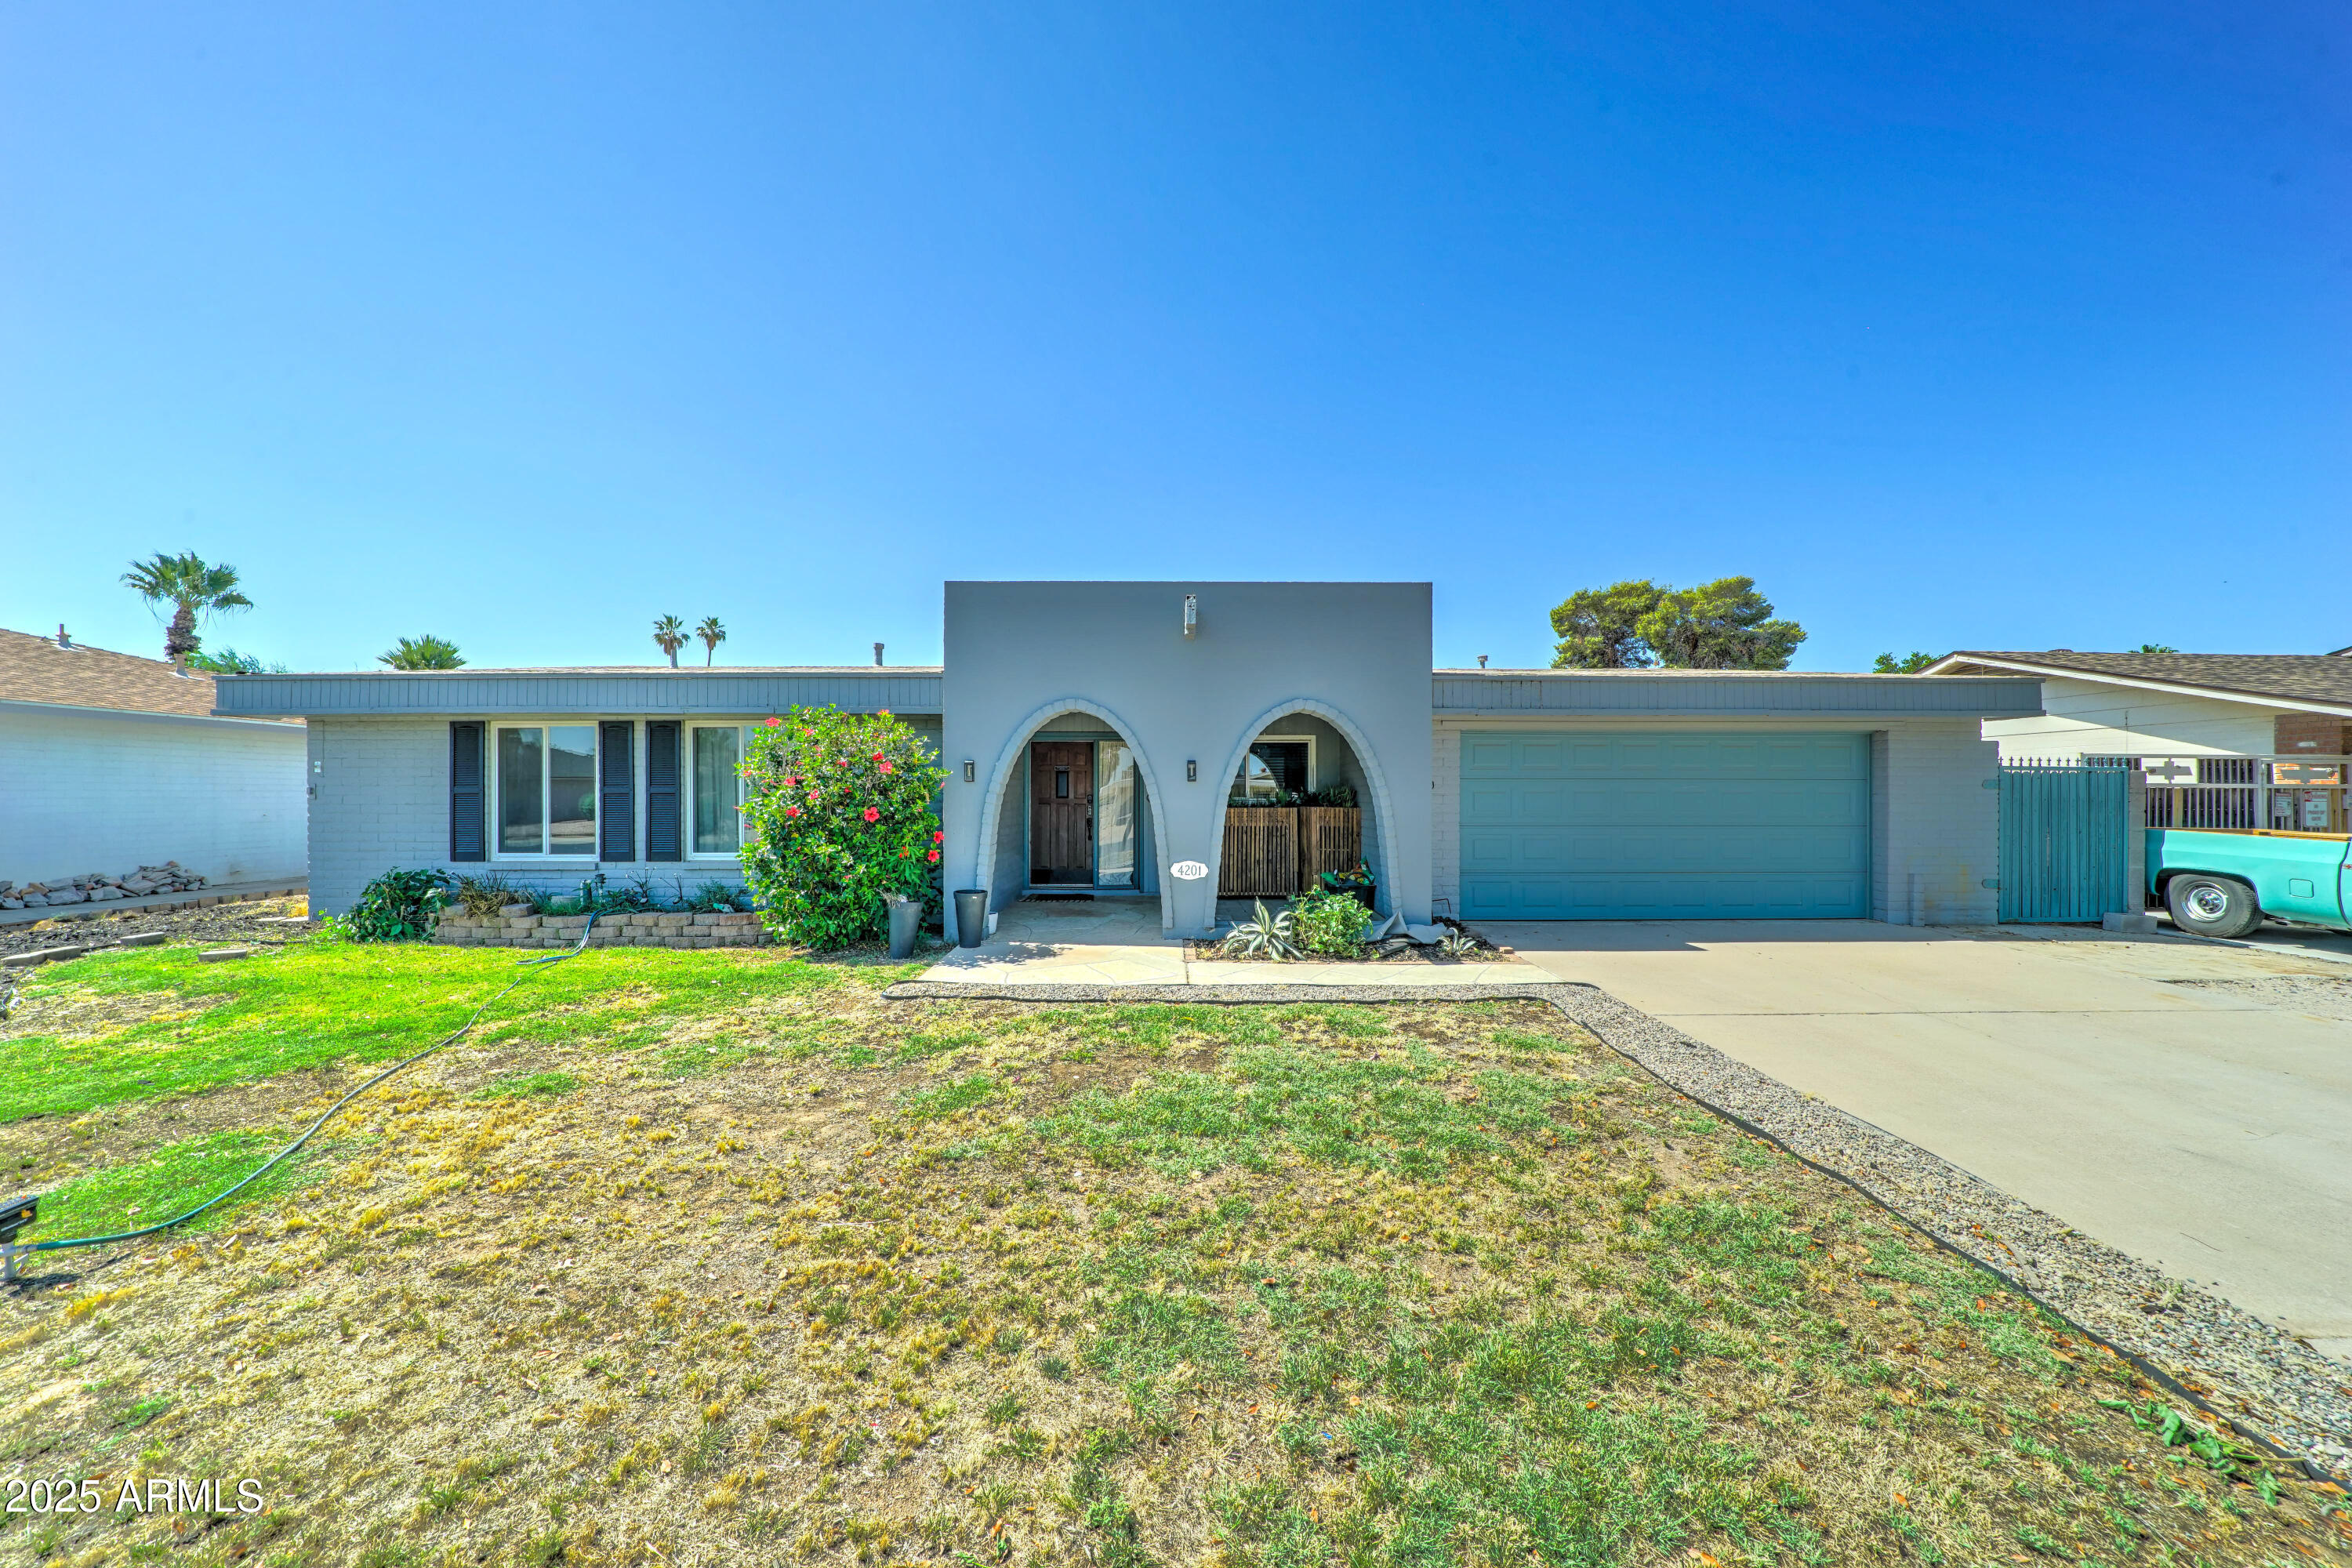
4201 W Hatcher Rd, Phoenix, AZ 85051
$-664
Cash flow
-8.5%
Cash-on-Cash Return
3.7%
Cap rate
0.5%
Rent to Value Ratio
Active
$394,990
4
bds
|
2
ba
|
2,027
sqft
|
built
1965
3627 W Hayward Ave, Phoenix, AZ 85051
$-615
Cash flow
-8.1%
Cash-on-Cash Return
3.8%
Cap rate
0.5%
Rent to Value Ratio

Active
$290,000
3
bds
|
2
ba
|
1,176
sqft
|
built
1955
8724 N 28th Ave, Phoenix, AZ 85051
$-184
Cash flow
-3.3%
Cash-on-Cash Return
4.9%
Cap rate
0.6%
Rent to Value Ratio
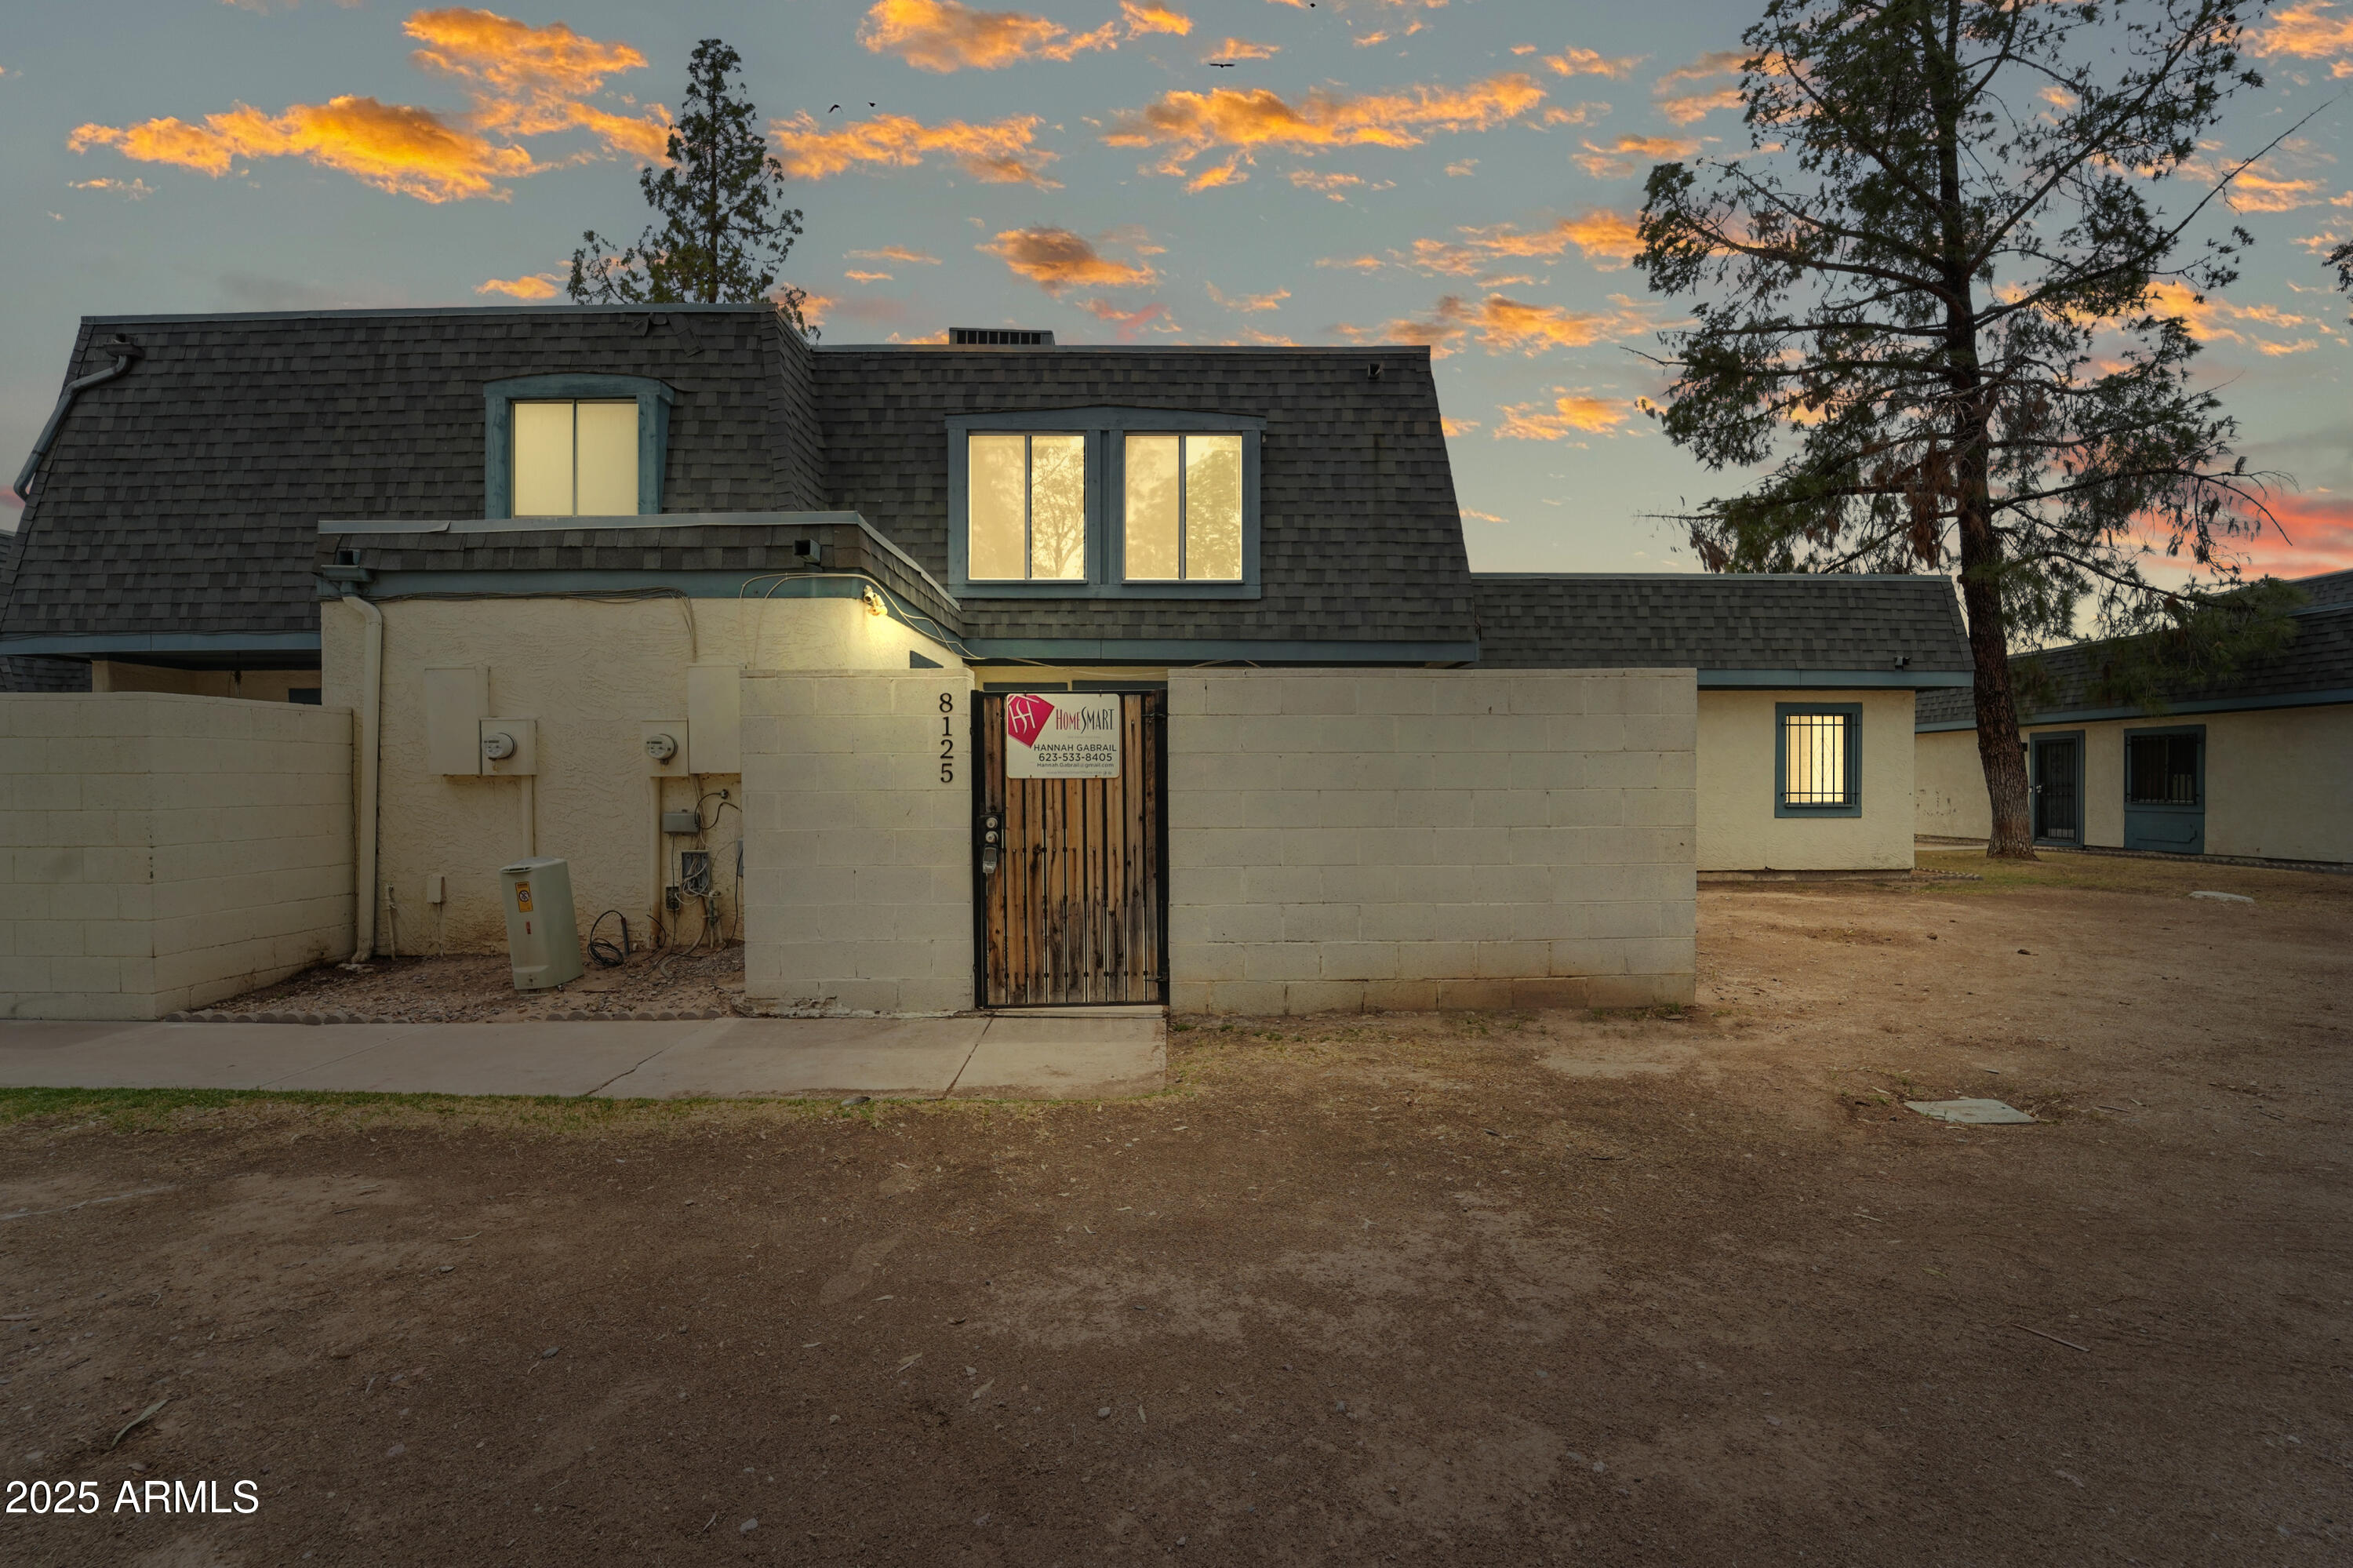
Active
$219,000
2
bds
|
1
ba
|
924
sqft
|
built
1980
8125 N 32nd Dr, Phoenix, AZ 85051
$-426
Cash flow
-10.1%
Cash-on-Cash Return
3.3%
Cap rate
0.6%
Rent to Value Ratio
Active
$574,900
5
bds
|
3
ba
|
2,065
sqft
|
built
1969
4202 W Purdue Ave, Phoenix, AZ 85051
$-1,046
Cash flow
-9.5%
Cash-on-Cash Return
3.5%
Cap rate
0.5%
Rent to Value Ratio
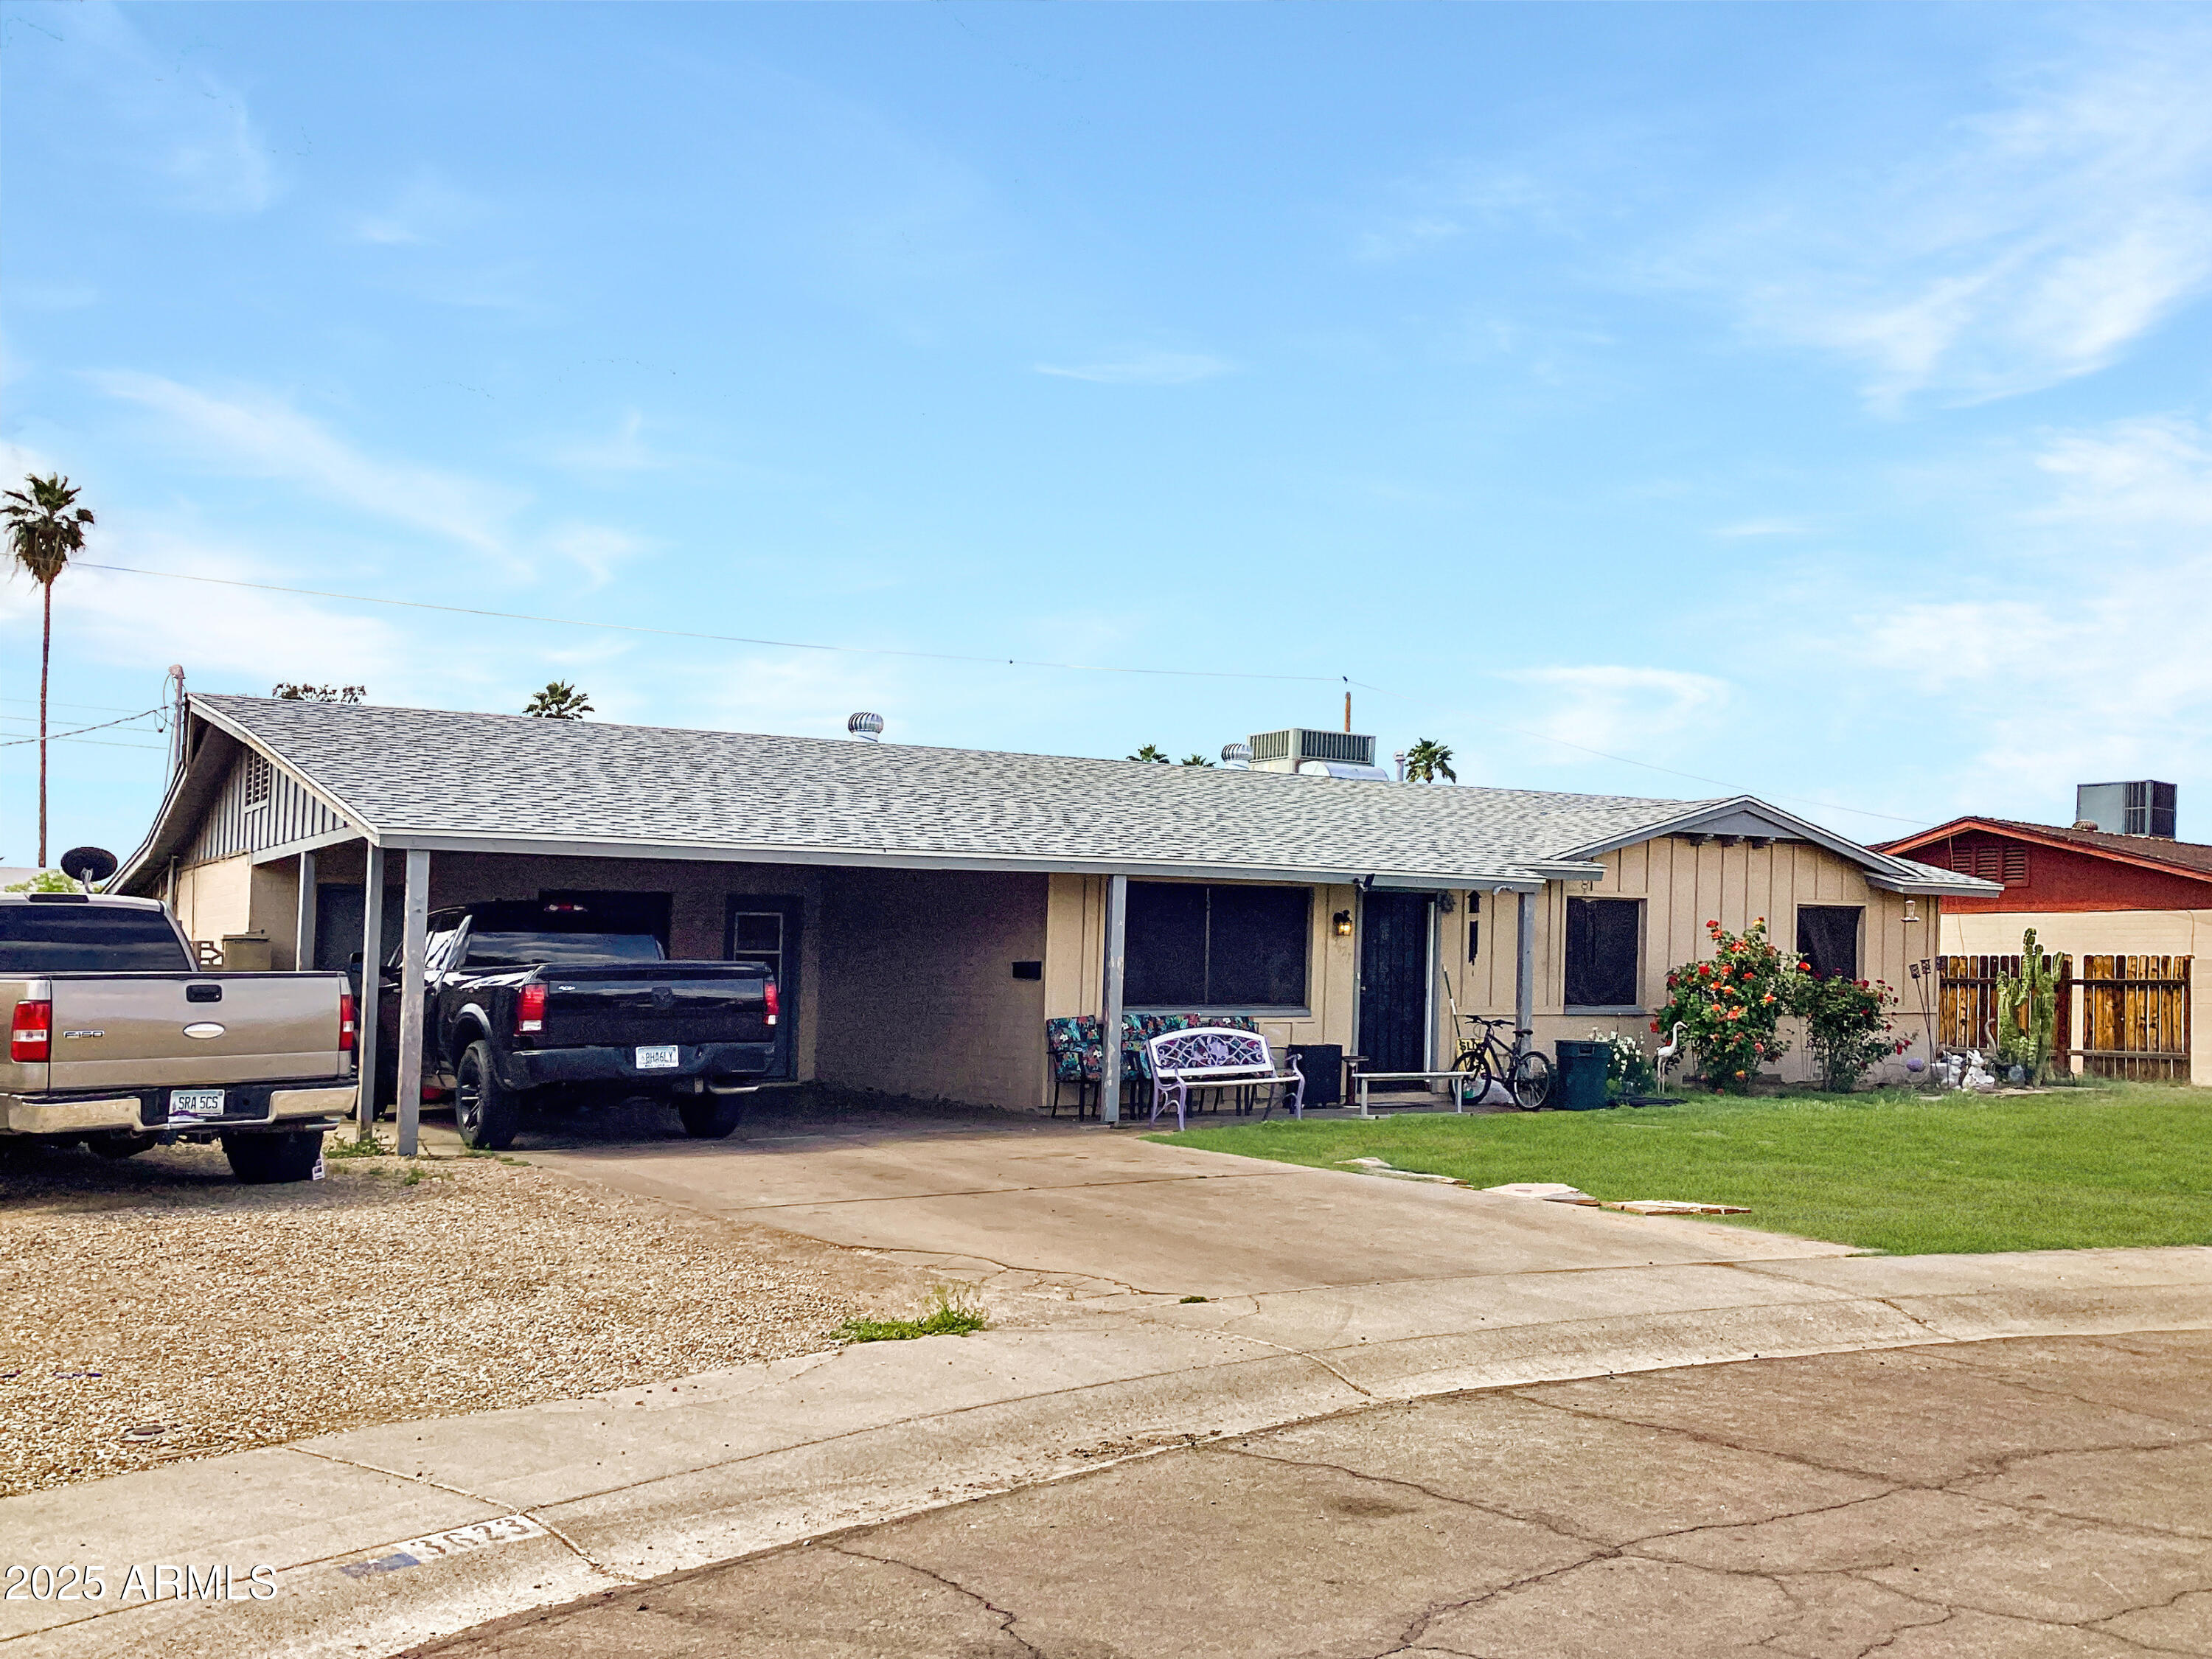
Active
$360,000
3
bds
|
2
ba
|
1,516
sqft
|
built
1957
7202 N 36th Ave, Phoenix, AZ 85051
$-531
Cash flow
-7.7%
Cash-on-Cash Return
3.9%
Cap rate
0.5%
Rent to Value Ratio
Active
$395,000
3
bds
|
2
ba
|
1,923
sqft
|
built
1979
9601 N 35th Dr, Phoenix, AZ 85051
$-378
Cash flow
-5.0%
Cash-on-Cash Return
4.5%
Cap rate
0.6%
Rent to Value Ratio
Active
$475,000
3
bds
|
2
ba
|
1,673
sqft
|
built
1970
3516 W Brown St, Phoenix, AZ 85051
$-619
Cash flow
-6.8%
Cash-on-Cash Return
4.1%
Cap rate
0.5%
Rent to Value Ratio
Active
$429,900
3
bds
|
2
ba
|
1,763
sqft
|
built
1972
10016 N 39th Dr, Phoenix, AZ 85051
$-397
Cash flow
-4.8%
Cash-on-Cash Return
4.6%
Cap rate
0.6%
Rent to Value Ratio
Active
$465,000
4
bds
|
3
ba
|
2,038
sqft
|
built
1967
4225 W Echo Ln, Phoenix, AZ 85051
$-641
Cash flow
-7.2%
Cash-on-Cash Return
4.0%
Cap rate
0.5%
Rent to Value Ratio
Active
$518,900
3
bds
|
2
ba
|
2,310
sqft
|
built
1963
7811 N 32nd Ave, Phoenix, AZ 85051
$-924
Cash flow
-9.3%
Cash-on-Cash Return
3.5%
Cap rate
0.5%
Rent to Value Ratio
Active
$438,900
4
bds
|
2
ba
|
2,199
sqft
|
built
1970
4111 W Hayward Ave, Phoenix, AZ 85051
$-673
Cash flow
-8.0%
Cash-on-Cash Return
3.8%
Cap rate
0.5%
Rent to Value Ratio
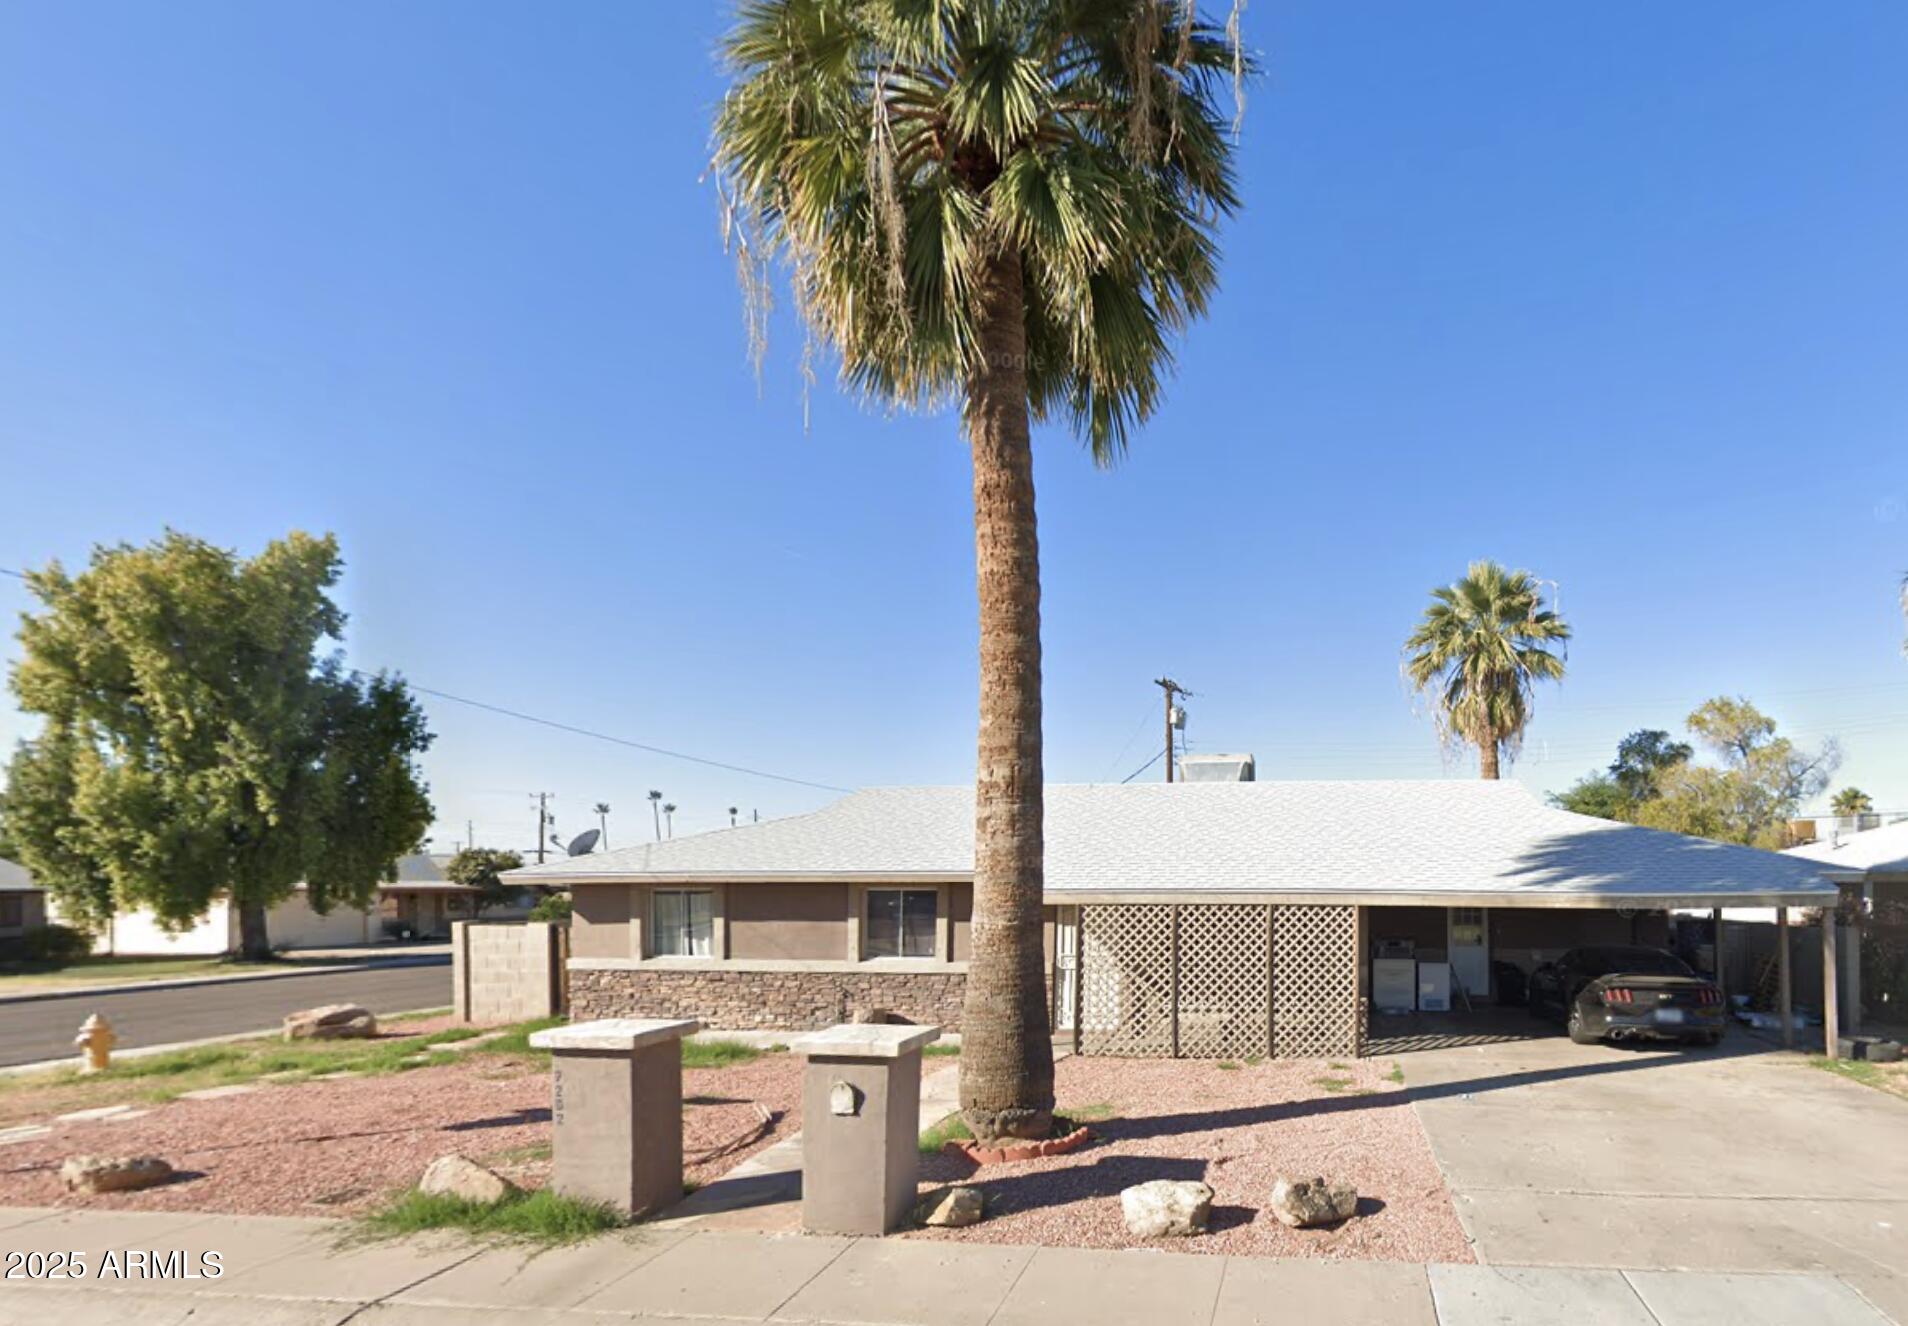
Active
$336,750
3
bds
|
1
ba
|
1,168
sqft
|
built
1951
7109 N 25th Dr, Phoenix, AZ 85051
$-449
Cash flow
-7.0%
Cash-on-Cash Return
4.1%
Cap rate
0.5%
Rent to Value Ratio
Active
$439,990
4
bds
|
3
ba
|
1,808
sqft
|
built
1968
4227 W Hatcher Rd, Phoenix, AZ 85051
$-462
Cash flow
-5.5%
Cash-on-Cash Return
4.4%
Cap rate
0.6%
Rent to Value Ratio

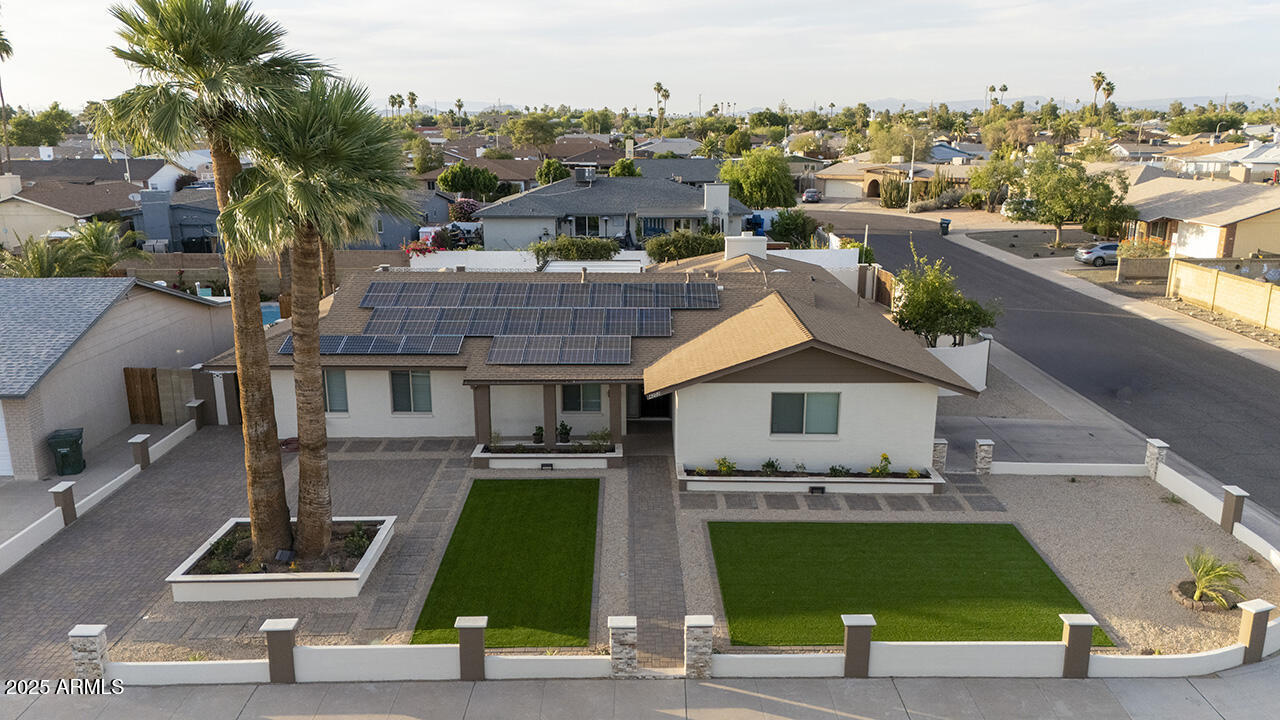
Active
$415,000
3
bds
|
4
ba
|
1,987
sqft
|
built
2019
3218 W Glendale Ave, Phoenix, AZ 85051
$-560
Cash flow
-7.0%
Cash-on-Cash Return
4.1%
Cap rate
0.6%
Rent to Value Ratio

Active
$415,000
4
bds
|
2
ba
|
2,052
sqft
|
built
1979
3135 W Echo Ln, Phoenix, AZ 85051
$-567
Cash flow
-7.1%
Cash-on-Cash Return
4.0%
Cap rate
0.5%
Rent to Value Ratio
Active
$264,500
3
bds
|
3
ba
|
1,696
sqft
|
built
1973
8428 N 33rd Dr, Phoenix, AZ 85051
$-271
Cash flow
-5.3%
Cash-on-Cash Return
4.5%
Cap rate
0.7%
Rent to Value Ratio
Active
$347,500
3
bds
|
2
ba
|
1,588
sqft
|
built
1968
4022 W Kaler Dr, Phoenix, AZ 85051
$-342
Cash flow
-5.1%
Cash-on-Cash Return
4.5%
Cap rate
0.6%
Rent to Value Ratio
Active
$368,000
3
bds
|
2
ba
|
1,825
sqft
|
built
1960
4004 W Myrtle Ave, Phoenix, AZ 85051
$-523
Cash flow
-7.4%
Cash-on-Cash Return
4.0%
Cap rate
0.5%
Rent to Value Ratio
Active
$150,000
1
bds
|
1
ba
|
728
sqft
|
built
1981
3131 W Cochise Dr, Phoenix, AZ 85051
$-174
Cash flow
-6.1%
Cash-on-Cash Return
4.3%
Cap rate
0.8%
Rent to Value Ratio
Active
$375,000
4
bds
|
2
ba
|
2,172
sqft
|
built
1968
3639 W Beryl Ave, Phoenix, AZ 85051
$-429
Cash flow
-6.0%
Cash-on-Cash Return
4.3%
Cap rate
0.6%
Rent to Value Ratio
Active
$453,400
4
bds
|
2
ba
|
1,912
sqft
|
built
1960
7745 N 33rd Ave, Phoenix, AZ 85051
$-847
Cash flow
-9.7%
Cash-on-Cash Return
3.4%
Cap rate
0.4%
Rent to Value Ratio
Active
$169,900
2
bds
|
2
ba
|
922
sqft
|
built
1983
3131 W Cochise Dr, Phoenix, AZ 85051
$-113
Cash flow
-3.5%
Cash-on-Cash Return
4.9%
Cap rate
0.9%
Rent to Value Ratio
Active
$244,900
2
bds
|
3
ba
|
1,686
sqft
|
built
1979
8027 N 32nd Ave, Phoenix, AZ 85051
$-338
Cash flow
-7.2%
Cash-on-Cash Return
4.0%
Cap rate
0.7%
Rent to Value Ratio
Pending
$399,900
3
bds
|
2
ba
|
1,778
sqft
|
built
1966
3716 W Griswold Rd, Phoenix, AZ 85051
$-196
Cash flow
-2.6%
Cash-on-Cash Return
5.1%
Cap rate
0.7%
Rent to Value Ratio
Active
$400,000
3
bds
|
2
ba
|
1,793
sqft
|
built
1976
3825 W Royal Palm Rd, Phoenix, AZ 85051
$-615
Cash flow
-8.0%
Cash-on-Cash Return
3.8%
Cap rate
0.5%
Rent to Value Ratio
Active
$162,360
2
bds
|
2
ba
|
960
sqft
|
built
1962
7101 N 36th Ave, Phoenix, AZ 85051
$-28
Cash flow
-0.9%
Cash-on-Cash Return
5.5%
Cap rate
1.0%
Rent to Value Ratio

Active
$345,000
3
bds
|
2
ba
|
1,280
sqft
|
built
1952
3012 W Butler Dr, Phoenix, AZ 85051
$-576
Cash flow
-8.7%
Cash-on-Cash Return
3.7%
Cap rate
0.5%
Rent to Value Ratio
Active
$239,000
2
bds
|
3
ba
|
1,696
sqft
|
built
1979
8226 N 32nd Dr, Phoenix, AZ 85051
$-293
Cash flow
-6.4%
Cash-on-Cash Return
4.2%
Cap rate
0.7%
Rent to Value Ratio
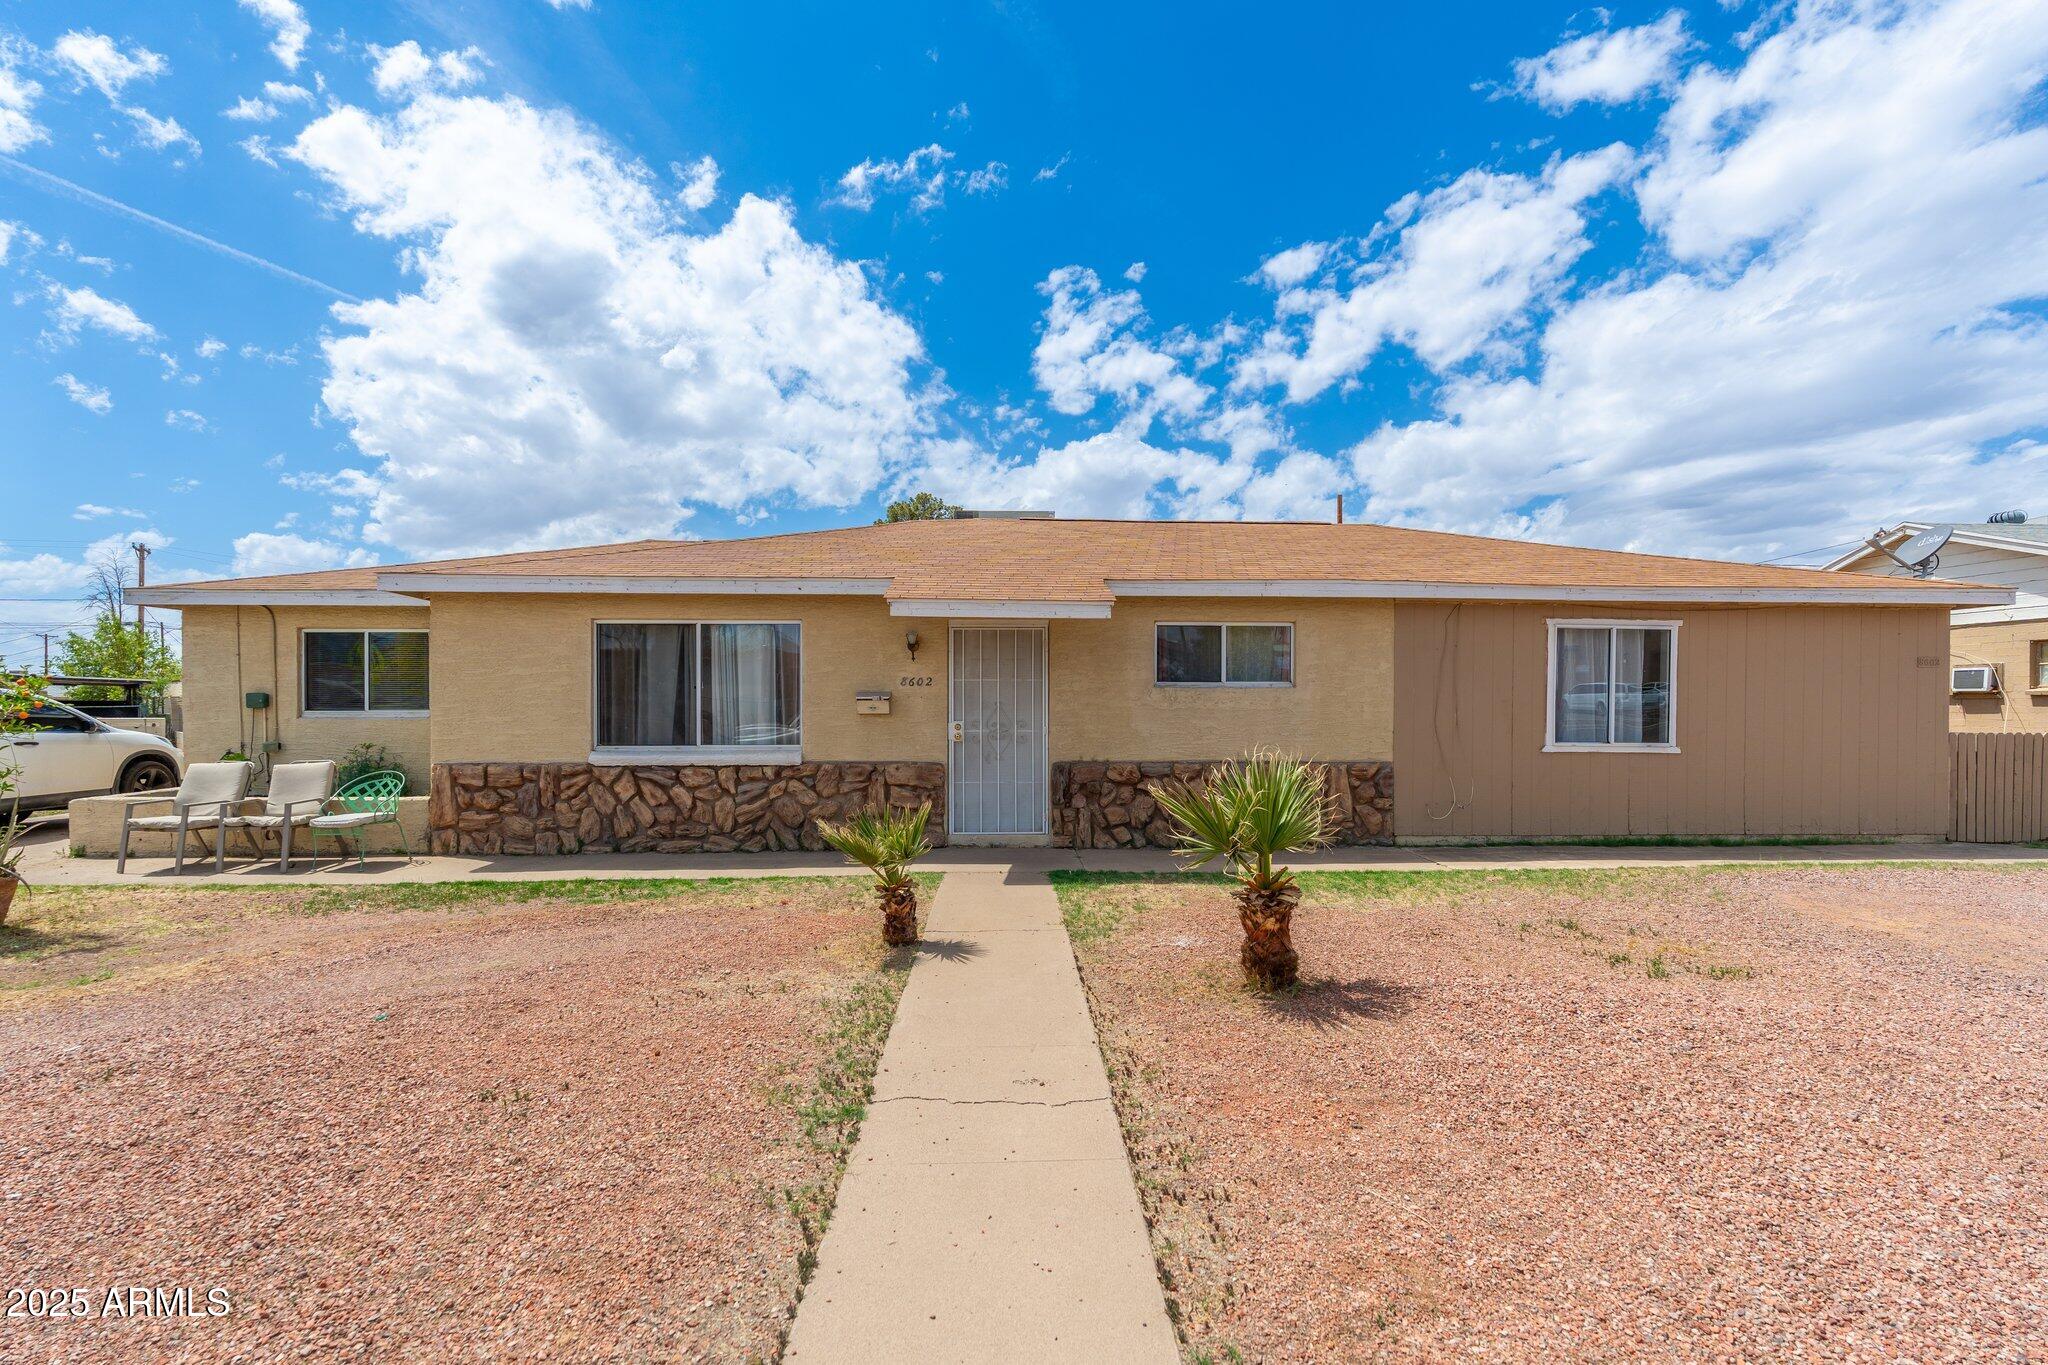
Active
$365,000
4
bds
|
3
ba
|
1,712
sqft
|
built
1954
8602 N 27th Ave, Phoenix, AZ 85051
$-411
Cash flow
-5.9%
Cash-on-Cash Return
4.3%
Cap rate
0.5%
Rent to Value Ratio
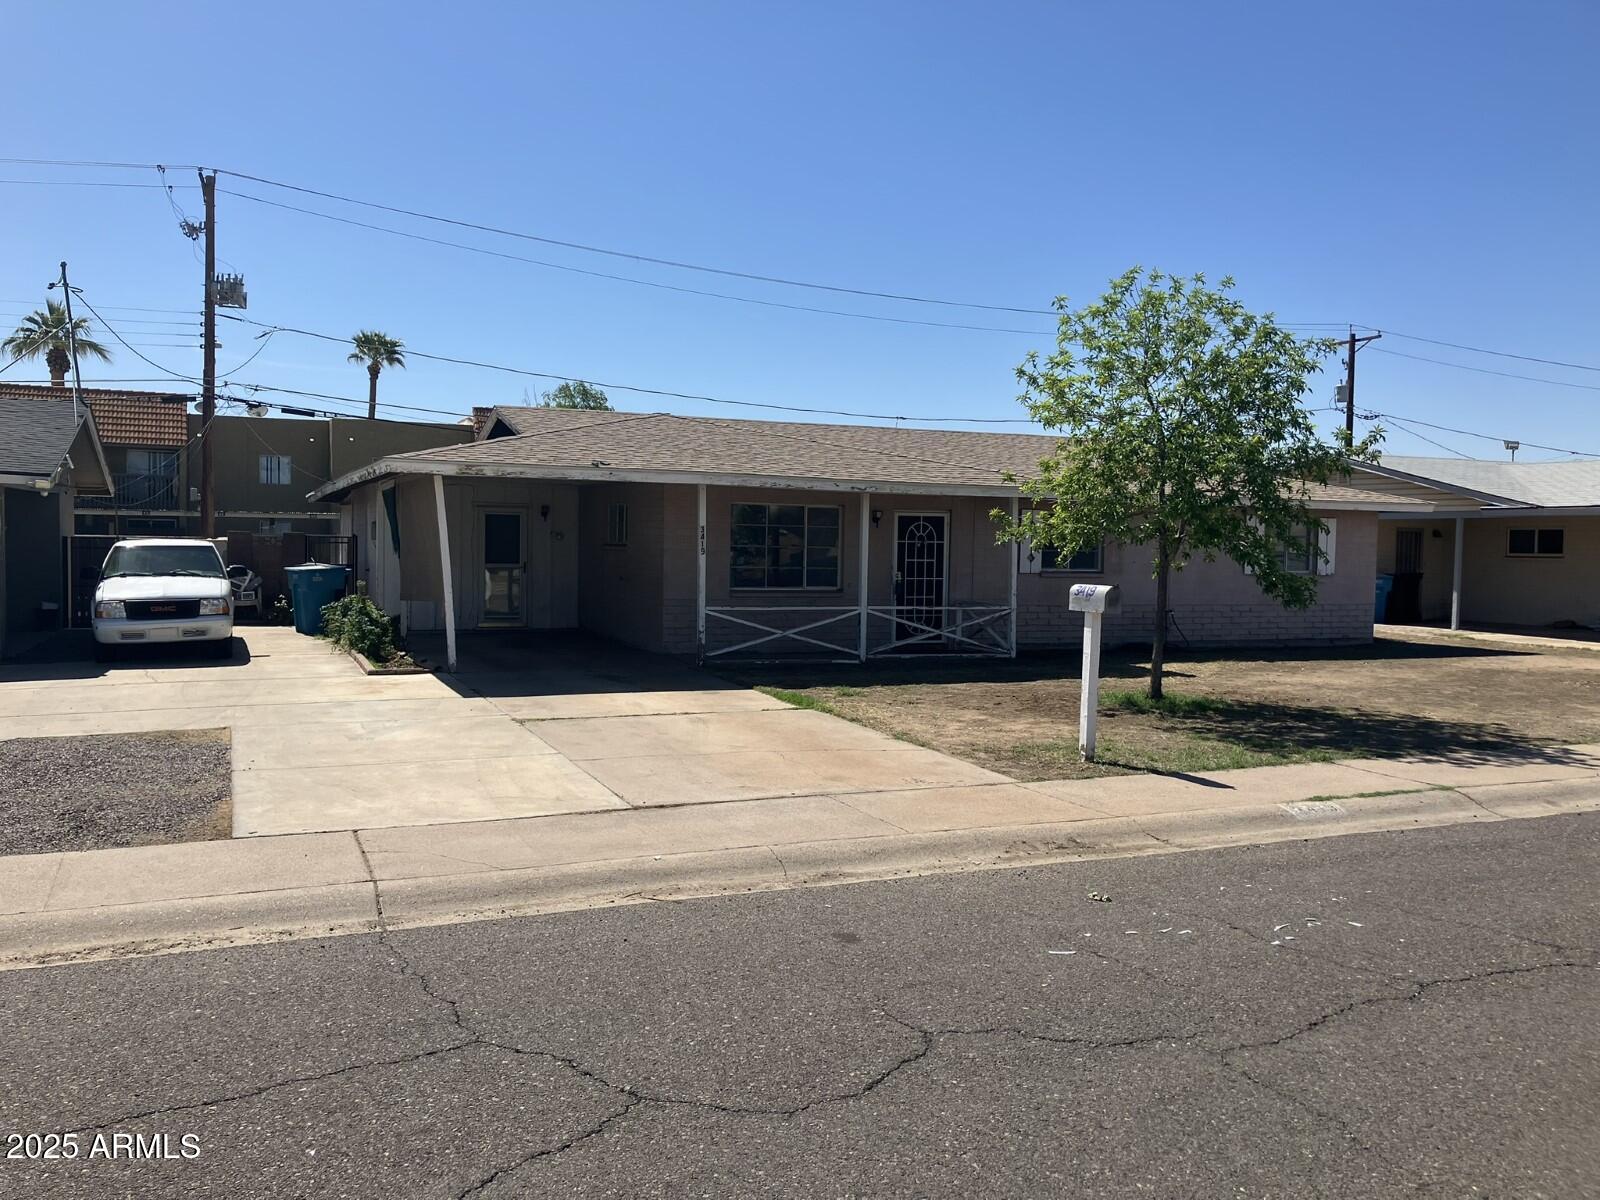
Active
$374,900
3
bds
|
2
ba
|
1,443
sqft
|
built
1959
3419 W Glenn Dr, Phoenix, AZ 85051
$-666
Cash flow
-9.3%
Cash-on-Cash Return
3.5%
Cap rate
0.5%
Rent to Value Ratio
Active
$223,000
3
bds
|
1
ba
|
1,008
sqft
|
built
1973
8225 N 34th Dr, Phoenix, AZ 85051
$-201
Cash flow
-4.7%
Cash-on-Cash Return
4.6%
Cap rate
0.7%
Rent to Value Ratio
Active
$238,000
2
bds
|
1
ba
|
986
sqft
|
built
1974
3331 W Del Monico Ln, Phoenix, AZ 85051
$-253
Cash flow
-5.5%
Cash-on-Cash Return
4.4%
Cap rate
0.6%
Rent to Value Ratio
Active
$415,000
3
bds
|
3
ba
|
1,693
sqft
|
built
1991
7110 N 28th Dr, Phoenix, AZ 85051
$-678
Cash flow
-8.5%
Cash-on-Cash Return
3.7%
Cap rate
0.5%
Rent to Value Ratio
Active
$215,000
2
bds
|
1
ba
|
986
sqft
|
built
1974
3404 W Tangerine Ln, Phoenix, AZ 85051
$-201
Cash flow
-4.9%
Cash-on-Cash Return
4.6%
Cap rate
0.7%
Rent to Value Ratio
Active
$359,850
3
bds
|
2
ba
|
1,612
sqft
|
built
1968
3741 W Davidson Ln, Phoenix, AZ 85051
$-428
Cash flow
-6.2%
Cash-on-Cash Return
4.3%
Cap rate
0.6%
Rent to Value Ratio

Active
$380,000
3
bds
|
2
ba
|
1,359
sqft
|
built
1965
4102 W Golden Ln, Phoenix, AZ 85051
$-580
Cash flow
-8.0%
Cash-on-Cash Return
3.8%
Cap rate
0.5%
Rent to Value Ratio
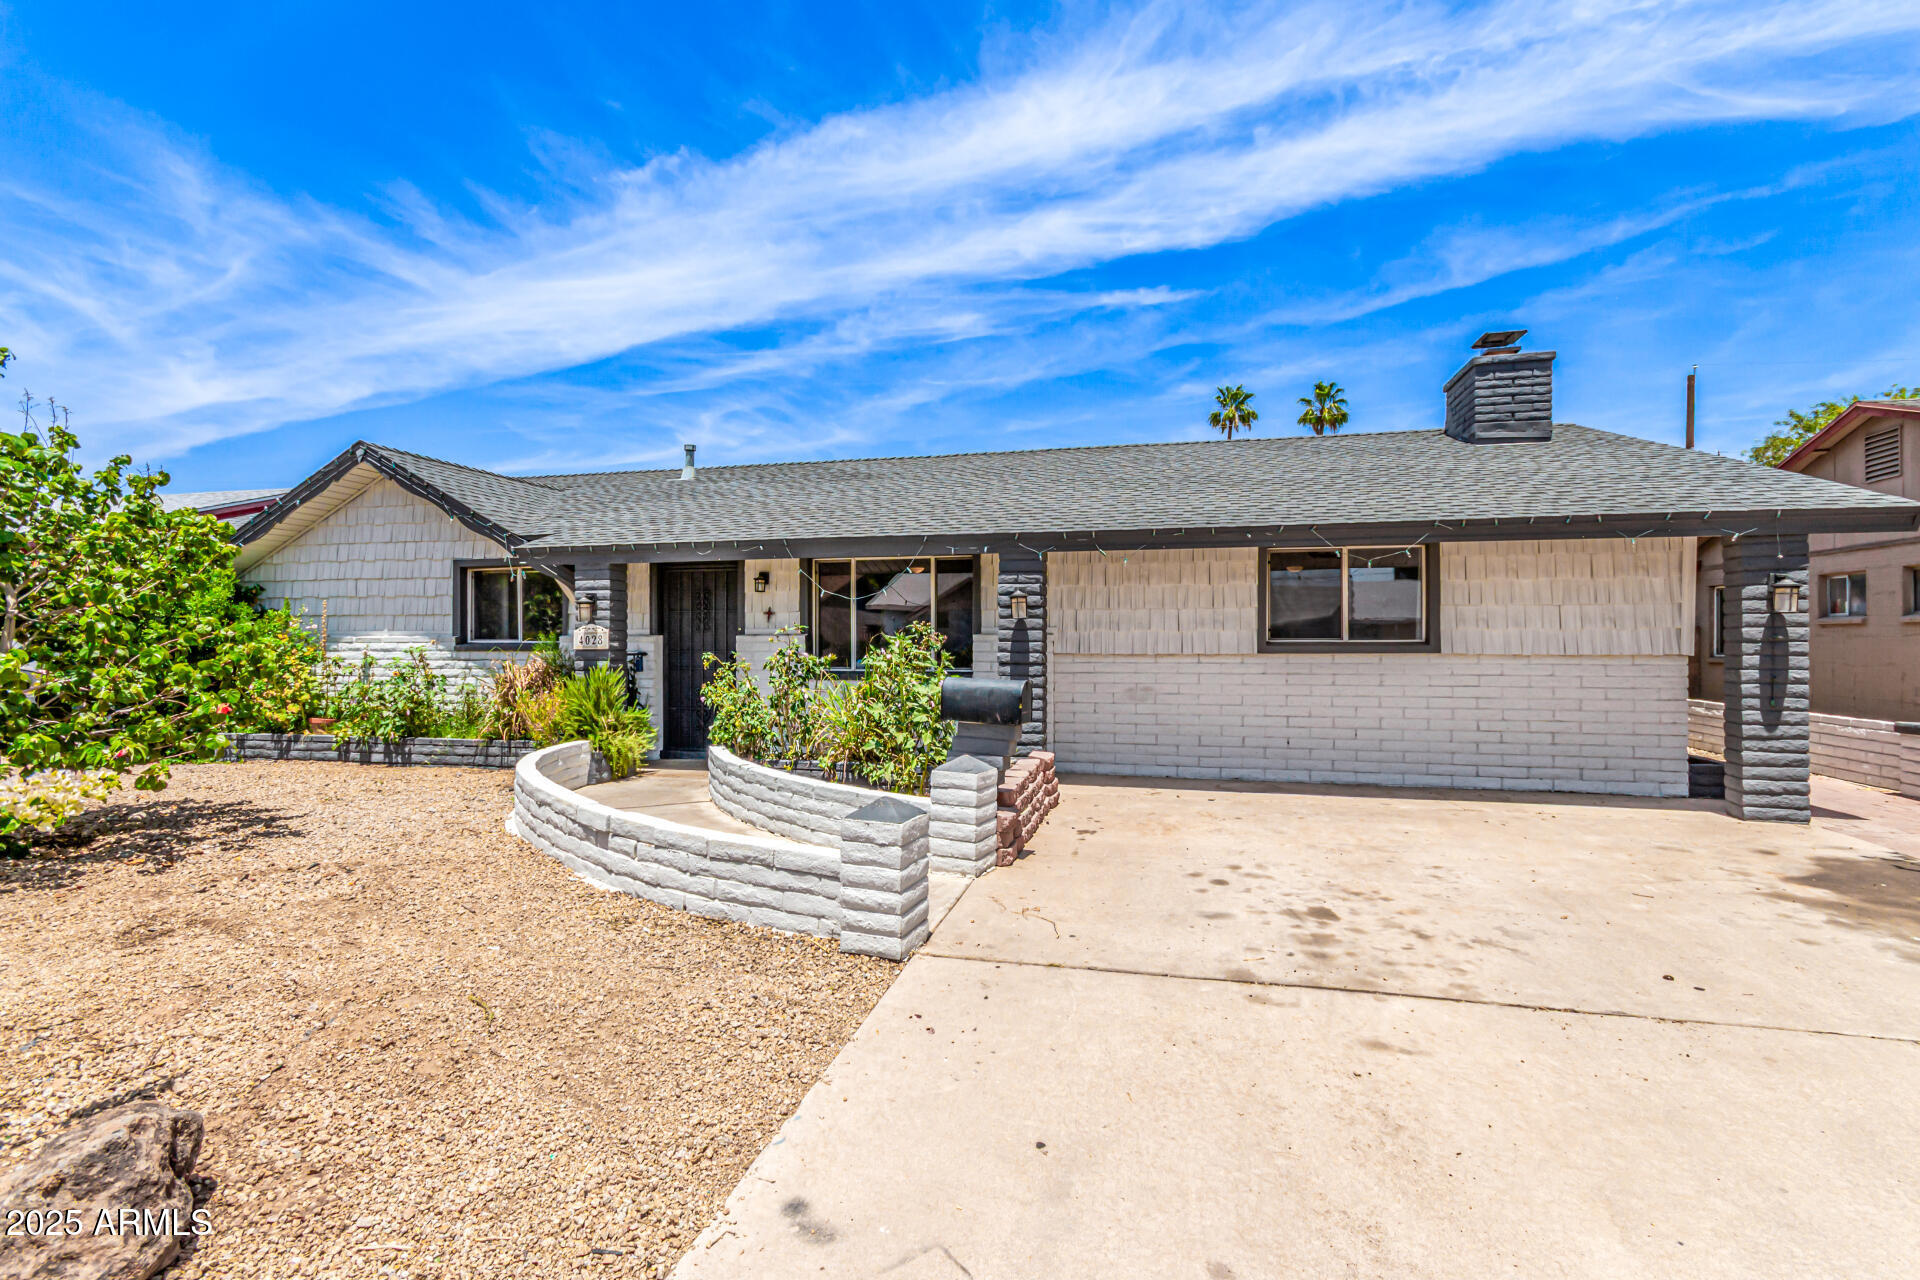
Active
$465,000
3
bds
|
2
ba
|
1,945
sqft
|
built
1966
4028 W El Camino Dr, Phoenix, AZ 85051
$-607
Cash flow
-6.8%
Cash-on-Cash Return
4.1%
Cap rate
0.5%
Rent to Value Ratio

Active
$365,000
3
bds
|
2
ba
|
1,574
sqft
|
built
1979
9641 N 36th Dr, Phoenix, AZ 85051
$-438
Cash flow
-6.3%
Cash-on-Cash Return
4.2%
Cap rate
0.5%
Rent to Value Ratio