89084 Investment Properties for Sale
Browse homes for sale and investment properties in 89084. Refine your search by price, property type, or more.
Best cash flowing properties in 89084

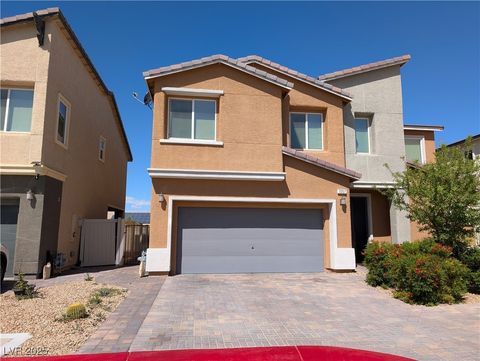
Pending
$314,900
3
bds
|
2
ba
|
1,454
sqft
|
built
2006
4725 Basilicata Ln, North Las Vegas, NV 89084
$-588
Cash flow
-9.7%
Cash-on-Cash Return
3.4%
Cap rate
0.6%
Rent to Value Ratio
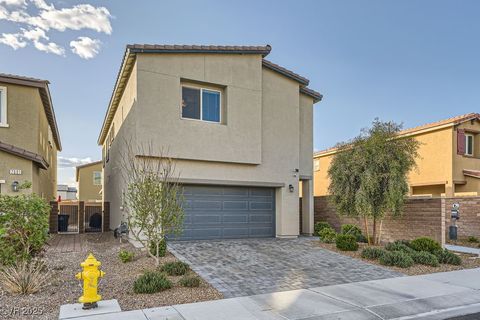
Active
$359,000
3
bds
|
3
ba
|
1,655
sqft
|
built
2019
105 Pollentia Ave, North Las Vegas, NV 89084
$-667
Cash flow
-9.7%
Cash-on-Cash Return
3.4%
Cap rate
0.6%
Rent to Value Ratio
132 out of 142 properties for sale in 89084
Limited Results Shown
Create a free account, or log in to reveal all property listings and enjoy the complete experience.

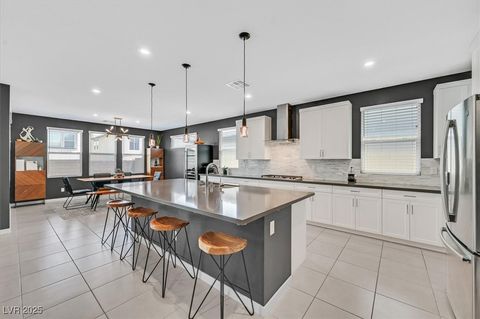
Active
$485,000
4
bds
|
3
ba
|
1,997
sqft
|
built
2020
7702 Candle Rock St, North Las Vegas, NV 89084
$-953
Cash flow
-10.3%
Cash-on-Cash Return
3.3%
Cap rate
0.5%
Rent to Value Ratio
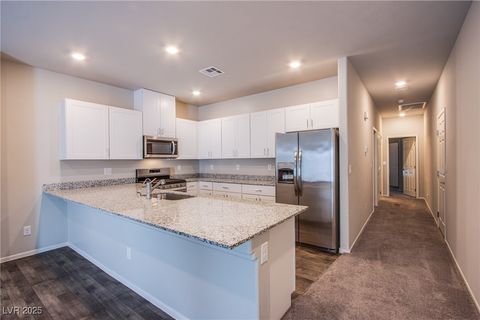
Active
$654,999
3
bds
|
3
ba
|
2,712
sqft
|
built
2007
7332 Redhead Dr, North Las Vegas, NV 89084
$-1,829
Cash flow
-14.6%
Cash-on-Cash Return
2.3%
Cap rate
0.4%
Rent to Value Ratio

Active
$649,900
5
bds
|
3
ba
|
3,752
sqft
|
built
2004
2112 Merganser Ct, North Las Vegas, NV 89084
$-1,252
Cash flow
-10.1%
Cash-on-Cash Return
3.4%
Cap rate
0.5%
Rent to Value Ratio

Active under contract
$415,000
3
bds
|
2
ba
|
1,685
sqft
|
built
2005
4124 Gliding Gulls Ave, North Las Vegas, NV 89084
$-748
Cash flow
-9.4%
Cash-on-Cash Return
3.5%
Cap rate
0.5%
Rent to Value Ratio

Active under contract
$699,900
3
bds
|
3
ba
|
2,711
sqft
|
built
2004
6423 Grayback Dr, North Las Vegas, NV 89084
$-1,848
Cash flow
-13.8%
Cash-on-Cash Return
2.5%
Cap rate
0.4%
Rent to Value Ratio

Active
$750,000
5
bds
|
5
ba
|
4,277
sqft
|
built
2016
1004 Bluebird Ridge Ct, North Las Vegas, NV 89084
$-1,742
Cash flow
-12.1%
Cash-on-Cash Return
2.9%
Cap rate
0.5%
Rent to Value Ratio

Active
$600,000
5
bds
|
4
ba
|
3,752
sqft
|
built
2005
6916 Snow Finch St, North Las Vegas, NV 89084
$-1,019
Cash flow
-8.9%
Cash-on-Cash Return
3.6%
Cap rate
0.5%
Rent to Value Ratio
Active
$480,000
3
bds
|
3
ba
|
1,997
sqft
|
built
2019
4323 Creekside Cavern Ave, North Las Vegas, NV 89084
$-888
Cash flow
-9.7%
Cash-on-Cash Return
3.5%
Cap rate
0.5%
Rent to Value Ratio

Active
$699,900
4
bds
|
3
ba
|
3,050
sqft
|
built
2005
1505 Barrington Oaks St, North Las Vegas, NV 89084
$-1,566
Cash flow
-11.7%
Cash-on-Cash Return
3.0%
Cap rate
0.4%
Rent to Value Ratio
Active
$549,900
4
bds
|
3
ba
|
2,678
sqft
|
built
2004
2312 Scissortail Ct, North Las Vegas, NV 89084
$-1,122
Cash flow
-10.6%
Cash-on-Cash Return
3.2%
Cap rate
0.5%
Rent to Value Ratio

Active
$579,999
3
bds
|
2
ba
|
2,196
sqft
|
built
2005
7513 Java Sparrow St, North Las Vegas, NV 89084
$-1,538
Cash flow
-13.8%
Cash-on-Cash Return
2.5%
Cap rate
0.4%
Rent to Value Ratio

Active
$350,000
3
bds
|
3
ba
|
1,588
sqft
|
built
2005
3208 Regal Swan Pl, North Las Vegas, NV 89084
$-761
Cash flow
-11.3%
Cash-on-Cash Return
3.1%
Cap rate
0.5%
Rent to Value Ratio
Active
$443,000
3
bds
|
3
ba
|
2,053
sqft
|
built
2014
7057 Millers Run St, North Las Vegas, NV 89084
$-911
Cash flow
-10.7%
Cash-on-Cash Return
3.2%
Cap rate
0.5%
Rent to Value Ratio

Active under contract
$409,950
3
bds
|
2
ba
|
1,512
sqft
|
built
2008
448 Bright Moon Ave, North Las Vegas, NV 89084
$-824
Cash flow
-10.5%
Cash-on-Cash Return
3.3%
Cap rate
0.5%
Rent to Value Ratio
Active
$459,995
4
bds
|
3
ba
|
1,855
sqft
|
built
2023
7605 Moore Creek Ln, North Las Vegas, NV 89084
$-1,124
Cash flow
-12.7%
Cash-on-Cash Return
2.7%
Cap rate
0.5%
Rent to Value Ratio
Active
$645,000
3
bds
|
3
ba
|
2,582
sqft
|
built
2019
6834 Empire Cliff St, North Las Vegas, NV 89084
$-1,312
Cash flow
-10.6%
Cash-on-Cash Return
3.2%
Cap rate
0.5%
Rent to Value Ratio
Active
$354,999
3
bds
|
2
ba
|
1,265
sqft
|
built
2020
7517 Crested Moon St, North Las Vegas, NV 89084
$-851
Cash flow
-12.5%
Cash-on-Cash Return
2.8%
Cap rate
0.5%
Rent to Value Ratio

Active
$500,000
4
bds
|
3
ba
|
2,415
sqft
|
built
2019
4512 Moon Hill Rock Ave, North Las Vegas, NV 89084
$-1,130
Cash flow
-11.8%
Cash-on-Cash Return
3.0%
Cap rate
0.5%
Rent to Value Ratio

Pending
$315,000
2
bds
|
2
ba
|
1,162
sqft
|
built
2021
7505 Emerald Stars Ave, North Las Vegas, NV 89084
$-803
Cash flow
-13.3%
Cash-on-Cash Return
2.6%
Cap rate
0.5%
Rent to Value Ratio
Active
$460,000
4
bds
|
3
ba
|
2,217
sqft
|
built
2020
7002 Fossil Rim St, North Las Vegas, NV 89084
$-1,134
Cash flow
-12.9%
Cash-on-Cash Return
2.7%
Cap rate
0.5%
Rent to Value Ratio

Active under contract
$439,000
4
bds
|
3
ba
|
2,205
sqft
|
built
2005
6480 Chebec St, North Las Vegas, NV 89084
$-794
Cash flow
-9.4%
Cash-on-Cash Return
3.5%
Cap rate
0.5%
Rent to Value Ratio

Active
$608,995
3
bds
|
3
ba
|
2,610
sqft
|
built
2005
7225 Millerbird St, North Las Vegas, NV 89084
$-1,718
Cash flow
-14.7%
Cash-on-Cash Return
2.3%
Cap rate
0.4%
Rent to Value Ratio
Active
$355,000
3
bds
|
3
ba
|
1,399
sqft
|
built
2020
7455 Snowy Owl St, North Las Vegas, NV 89084
$-776
Cash flow
-11.4%
Cash-on-Cash Return
3.1%
Cap rate
0.6%
Rent to Value Ratio

Active
$459,950
4
bds
|
2
ba
|
1,816
sqft
|
built
2021
7910 Silky Ct, North Las Vegas, NV 89084
$-1,262
Cash flow
-14.3%
Cash-on-Cash Return
2.4%
Cap rate
0.4%
Rent to Value Ratio
Active
$699,999
5
bds
|
4
ba
|
3,732
sqft
|
built
2006
3425 Fledgling Dr, North Las Vegas, NV 89084
$-1,542
Cash flow
-11.5%
Cash-on-Cash Return
3.0%
Cap rate
0.5%
Rent to Value Ratio
Active
$534,000
4
bds
|
3
ba
|
1,914
sqft
|
built
2005
4329 Skimmers Ct, North Las Vegas, NV 89084
$-928
Cash flow
-9.1%
Cash-on-Cash Return
3.6%
Cap rate
0.5%
Rent to Value Ratio
Active
$359,000
3
bds
|
3
ba
|
1,655
sqft
|
built
2019
105 Pollentia Ave, North Las Vegas, NV 89084
$-667
Cash flow
-9.7%
Cash-on-Cash Return
3.4%
Cap rate
0.6%
Rent to Value Ratio
Active
$649,900
5
bds
|
3
ba
|
2,799
sqft
|
built
2006
7073 Seabirds Pl, North Las Vegas, NV 89084
$-1,675
Cash flow
-13.4%
Cash-on-Cash Return
2.6%
Cap rate
0.4%
Rent to Value Ratio

Active
$367,900
3
bds
|
2
ba
|
1,371
sqft
|
built
2022
4145 Venus Falls Ave, North Las Vegas, NV 89084
$-797
Cash flow
-11.3%
Cash-on-Cash Return
3.1%
Cap rate
0.5%
Rent to Value Ratio
Active
$440,000
4
bds
|
3
ba
|
1,796
sqft
|
built
2023
1783 Matteo Cove Pl, North Las Vegas, NV 89084
$-1,122
Cash flow
-13.3%
Cash-on-Cash Return
2.6%
Cap rate
0.5%
Rent to Value Ratio

Active
$539,000
5
bds
|
3
ba
|
2,950
sqft
|
built
2019
4511 Stardusk Falls Ave, North Las Vegas, NV 89084
$-1,102
Cash flow
-10.7%
Cash-on-Cash Return
3.2%
Cap rate
0.5%
Rent to Value Ratio

Active
$599,000
4
bds
|
3
ba
|
2,611
sqft
|
built
2020
1321 Hudson Creek Pl, North Las Vegas, NV 89084
$-1,335
Cash flow
-11.6%
Cash-on-Cash Return
3.0%
Cap rate
0.5%
Rent to Value Ratio

Active
$674,900
4
bds
|
3
ba
|
2,712
sqft
|
built
2005
7404 Eggshell Dr, North Las Vegas, NV 89084
$-1,924
Cash flow
-14.9%
Cash-on-Cash Return
2.3%
Cap rate
0.4%
Rent to Value Ratio
Pending
$314,900
3
bds
|
2
ba
|
1,454
sqft
|
built
2006
4725 Basilicata Ln, North Las Vegas, NV 89084
$-588
Cash flow
-9.7%
Cash-on-Cash Return
3.4%
Cap rate
0.6%
Rent to Value Ratio

Active
$730,000
4
bds
|
3
ba
|
2,660
sqft
|
built
2021
4510 Rubious Ave, North Las Vegas, NV 89084
$-2,064
Cash flow
-14.8%
Cash-on-Cash Return
2.3%
Cap rate
0.4%
Rent to Value Ratio

Closed
$685,000
5
bds
|
3
ba
|
3,508
sqft
|
built
2005
2117 Mountain Rail Dr, North Las Vegas, NV 89084
$-1,058
Cash flow
-8.1%
Cash-on-Cash Return
3.8%
Cap rate
0.5%
Rent to Value Ratio
Active
$729,000
6
bds
|
4
ba
|
3,939
sqft
|
built
2010
1777 Gentle Brook St, North Las Vegas, NV 89084
$-1,754
Cash flow
-12.6%
Cash-on-Cash Return
2.8%
Cap rate
0.4%
Rent to Value Ratio

Active
$650,000
5
bds
|
4
ba
|
3,628
sqft
|
built
2006
3728 White Lion Ln, North Las Vegas, NV 89084
$-1,110
Cash flow
-8.9%
Cash-on-Cash Return
3.6%
Cap rate
0.5%
Rent to Value Ratio

Active
$615,000
3
bds
|
2
ba
|
2,196
sqft
|
built
2006
7264 Summer Duck Way, North Las Vegas, NV 89084
$-1,564
Cash flow
-13.3%
Cash-on-Cash Return
2.6%
Cap rate
0.5%
Rent to Value Ratio

Active
$779,000
5
bds
|
4
ba
|
3,732
sqft
|
built
2007
7416 Redhead Dr, North Las Vegas, NV 89084
$-1,898
Cash flow
-12.7%
Cash-on-Cash Return
2.8%
Cap rate
0.5%
Rent to Value Ratio