89084 Investment Properties for Sale
Browse homes for sale and investment properties in 89084. Refine your search by price, property type, or more.
Best cash flowing properties in 89084
Active
$297,000
2
bds
|
2
ba
|
1,128
sqft
|
built
2004
3521 Hazelnut Pine Pl, North Las Vegas, NV 89084
$-608
Cash flow
-10.7%
Cash-on-Cash Return
3.2%
Cap rate
0.5%
Rent to Value Ratio
Active
$398,900
4
bds
|
3
ba
|
1,976
sqft
|
built
2003
6525 Bismark Hills St, North Las Vegas, NV 89084
$-615
Cash flow
-8.0%
Cash-on-Cash Return
3.8%
Cap rate
0.6%
Rent to Value Ratio
118 out of 125 properties for sale in 89084
Limited Results Shown
Create a free account, or log in to reveal all property listings and enjoy the complete experience.
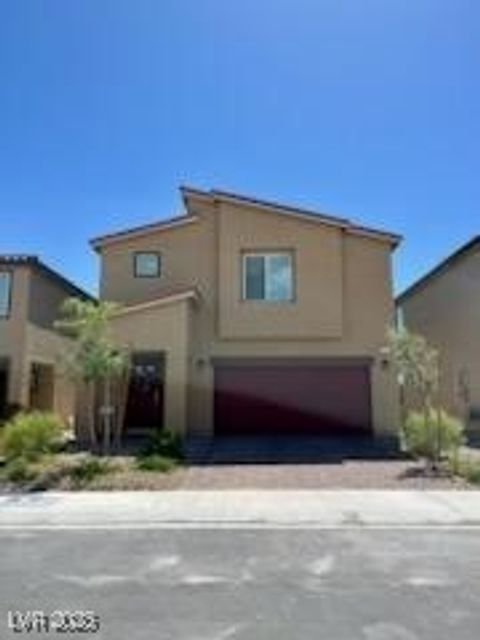
Active
$360,000
3
bds
|
2
ba
|
1,265
sqft
|
built
2020
7550 Cooks Meadow St, North Las Vegas, NV 89084
$-910
Cash flow
-13.2%
Cash-on-Cash Return
2.6%
Cap rate
0.5%
Rent to Value Ratio
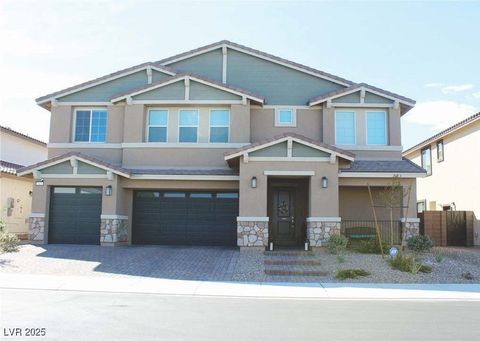
Active
$499,900
5
bds
|
3
ba
|
2,462
sqft
|
built
2019
1230 Indigo Bluff Ave, North Las Vegas, NV 89084
$-1,053
Cash flow
-11.0%
Cash-on-Cash Return
3.2%
Cap rate
0.5%
Rent to Value Ratio

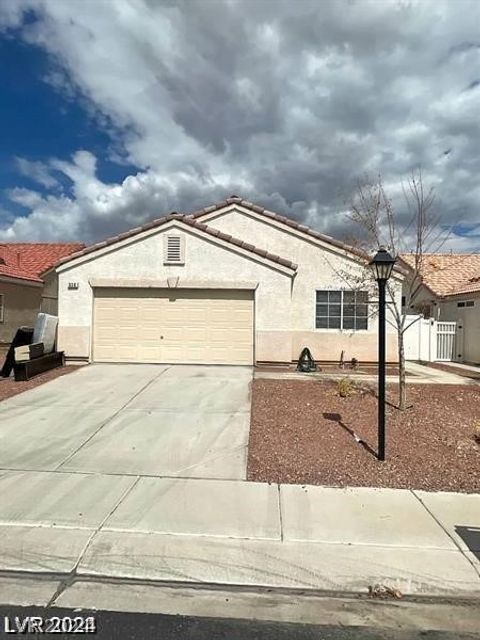
Active
$365,000
3
bds
|
3
ba
|
1,588
sqft
|
built
2005
3209 Orange Orchid Pl, North Las Vegas, NV 89084
$-823
Cash flow
-11.8%
Cash-on-Cash Return
3.0%
Cap rate
0.5%
Rent to Value Ratio
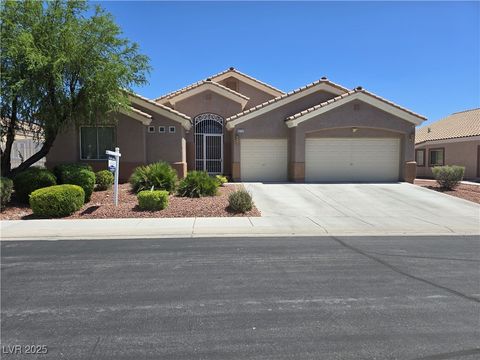
Active
$459,999
4
bds
|
3
ba
|
1,833
sqft
|
built
2021
4438 Lantern Point Ave, North Las Vegas, NV 89084
$-1,069
Cash flow
-12.1%
Cash-on-Cash Return
2.9%
Cap rate
0.5%
Rent to Value Ratio
Active
$479,999
4
bds
|
3
ba
|
2,187
sqft
|
built
2019
6955 Nash Tracks St, North Las Vegas, NV 89084
$-1,138
Cash flow
-12.4%
Cash-on-Cash Return
2.8%
Cap rate
0.5%
Rent to Value Ratio
Active
$439,900
3
bds
|
3
ba
|
1,781
sqft
|
built
2020
4423 Creekside Cavern Ave, North Las Vegas, NV 89084
$-1,012
Cash flow
-12.0%
Cash-on-Cash Return
2.9%
Cap rate
0.5%
Rent to Value Ratio
Active
$794,000
5
bds
|
5
ba
|
4,825
sqft
|
built
2006
2208 Cactus Desert Ct, North Las Vegas, NV 89084
$-1,948
Cash flow
-12.8%
Cash-on-Cash Return
2.7%
Cap rate
0.4%
Rent to Value Ratio
Active
$639,999
3
bds
|
3
ba
|
2,582
sqft
|
built
2019
1609 Dream Canyon Ave, North Las Vegas, NV 89084
$-1,736
Cash flow
-14.2%
Cash-on-Cash Return
2.4%
Cap rate
0.4%
Rent to Value Ratio
Active
$755,000
5
bds
|
4
ba
|
3,732
sqft
|
built
2007
7416 Redhead Dr, North Las Vegas, NV 89084
$-1,785
Cash flow
-12.3%
Cash-on-Cash Return
2.8%
Cap rate
0.5%
Rent to Value Ratio
Active
$500,000
3
bds
|
3
ba
|
2,329
sqft
|
built
2023
7111 Stockton Dunes St, North Las Vegas, NV 89084
$-1,086
Cash flow
-11.3%
Cash-on-Cash Return
3.1%
Cap rate
0.5%
Rent to Value Ratio
Active
$465,000
3
bds
|
3
ba
|
1,795
sqft
|
built
2023
7107 Tilligerry St, North Las Vegas, NV 89084
$-1,075
Cash flow
-12.1%
Cash-on-Cash Return
2.9%
Cap rate
0.5%
Rent to Value Ratio
Active
$420,000
3
bds
|
3
ba
|
1,556
sqft
|
built
2019
7636 Bandon Cliffs St, North Las Vegas, NV 89084
$-1,038
Cash flow
-12.9%
Cash-on-Cash Return
2.7%
Cap rate
0.5%
Rent to Value Ratio
Active
$649,000
5
bds
|
3
ba
|
3,671
sqft
|
built
2013
6659 Alder Flower Ct, North Las Vegas, NV 89084
$-1,310
Cash flow
-10.5%
Cash-on-Cash Return
3.3%
Cap rate
0.5%
Rent to Value Ratio
Active
$740,000
5
bds
|
5
ba
|
3,905
sqft
|
built
2020
6830 Empire Cliff St, North Las Vegas, NV 89084
$-2,042
Cash flow
-14.4%
Cash-on-Cash Return
2.4%
Cap rate
0.4%
Rent to Value Ratio
Active
$379,900
3
bds
|
2
ba
|
1,521
sqft
|
built
2001
6642 Cinnabar Coast Ln, North Las Vegas, NV 89084
$-769
Cash flow
-10.6%
Cash-on-Cash Return
3.3%
Cap rate
0.5%
Rent to Value Ratio
Active
$725,000
5
bds
|
4
ba
|
3,225
sqft
|
built
2011
7113 Bluebird Wing St, North Las Vegas, NV 89084
$-1,499
Cash flow
-10.8%
Cash-on-Cash Return
3.2%
Cap rate
0.5%
Rent to Value Ratio
Active
$341,990
3
bds
|
3
ba
|
1,399
sqft
|
built
2021
4650 Blaise Ave, North Las Vegas, NV 89084
$-865
Cash flow
-13.2%
Cash-on-Cash Return
2.6%
Cap rate
0.5%
Rent to Value Ratio
Active
$719,000
5
bds
|
5
ba
|
3,360
sqft
|
built
2022
3726 Snow Fawn Ave, North Las Vegas, NV 89084
$-1,739
Cash flow
-12.6%
Cash-on-Cash Return
2.8%
Cap rate
0.5%
Rent to Value Ratio
Active
$575,000
4
bds
|
3
ba
|
3,134
sqft
|
built
2006
3721 Alcantara Ln, North Las Vegas, NV 89084
$-1,133
Cash flow
-10.3%
Cash-on-Cash Return
3.3%
Cap rate
0.5%
Rent to Value Ratio
Active
$410,000
3
bds
|
2
ba
|
1,821
sqft
|
built
2004
6720 Sand Swallow St, North Las Vegas, NV 89084
$-780
Cash flow
-9.9%
Cash-on-Cash Return
3.4%
Cap rate
0.5%
Rent to Value Ratio
Active
$343,000
3
bds
|
2
ba
|
1,290
sqft
|
built
2020
7541 Garnet Moon St, North Las Vegas, NV 89084
$-795
Cash flow
-12.1%
Cash-on-Cash Return
2.9%
Cap rate
0.5%
Rent to Value Ratio
Active
$625,000
4
bds
|
3
ba
|
2,329
sqft
|
built
2021
387 Free Fall Ave, North Las Vegas, NV 89084
$-1,847
Cash flow
-15.4%
Cash-on-Cash Return
2.1%
Cap rate
0.4%
Rent to Value Ratio
Active
$536,000
3
bds
|
3
ba
|
2,320
sqft
|
built
2007
6417 Giant Oak St, North Las Vegas, NV 89084
$-1,309
Cash flow
-12.7%
Cash-on-Cash Return
2.7%
Cap rate
0.4%
Rent to Value Ratio
Active
$354,888
3
bds
|
2
ba
|
1,404
sqft
|
built
2022
4125 Venus Falls Ave, North Las Vegas, NV 89084
$-819
Cash flow
-12.0%
Cash-on-Cash Return
2.9%
Cap rate
0.6%
Rent to Value Ratio
Active
$375,000
3
bds
|
2
ba
|
1,198
sqft
|
built
2024
7890 Aurora Sky St, North Las Vegas, NV 89084
$-883
Cash flow
-12.3%
Cash-on-Cash Return
2.9%
Cap rate
0.5%
Rent to Value Ratio
Active
$420,000
3
bds
|
3
ba
|
1,783
sqft
|
built
2021
391 Elks Peak Ave, North Las Vegas, NV 89084
$-999
Cash flow
-12.4%
Cash-on-Cash Return
2.8%
Cap rate
0.5%
Rent to Value Ratio
Active
$620,000
5
bds
|
3
ba
|
3,068
sqft
|
built
2022
4432 Panoramic View Ave, North Las Vegas, NV 89084
$-1,639
Cash flow
-13.8%
Cash-on-Cash Return
2.5%
Cap rate
0.5%
Rent to Value Ratio
Active
$310,000
3
bds
|
2
ba
|
1,454
sqft
|
built
2006
4610 Puglia Ln, North Las Vegas, NV 89084
$-724
Cash flow
-12.2%
Cash-on-Cash Return
2.9%
Cap rate
0.5%
Rent to Value Ratio
Active
$445,000
3
bds
|
3
ba
|
2,011
sqft
|
built
2019
6804 Boulder Canyon St, North Las Vegas, NV 89084
$-910
Cash flow
-10.7%
Cash-on-Cash Return
3.2%
Cap rate
0.5%
Rent to Value Ratio
Active
$639,000
5
bds
|
3
ba
|
3,752
sqft
|
built
2004
2120 Marsh Tern Ct, North Las Vegas, NV 89084
$-1,218
Cash flow
-9.9%
Cash-on-Cash Return
3.4%
Cap rate
0.5%
Rent to Value Ratio
Active
$558,900
4
bds
|
3
ba
|
2,560
sqft
|
built
2004
6437 Boatbill St, North Las Vegas, NV 89084
$-960
Cash flow
-9.0%
Cash-on-Cash Return
3.6%
Cap rate
0.5%
Rent to Value Ratio
Active
$545,000
5
bds
|
3
ba
|
2,946
sqft
|
built
2023
1885 Vass Springs Pl, North Las Vegas, NV 89084
$-1,415
Cash flow
-13.5%
Cash-on-Cash Return
2.6%
Cap rate
0.5%
Rent to Value Ratio
Active
$750,000
6
bds
|
5
ba
|
4,443
sqft
|
built
2024
7855 Skyler Falls Ln, North Las Vegas, NV 89084
$-2,520
Cash flow
-17.5%
Cash-on-Cash Return
1.6%
Cap rate
0.3%
Rent to Value Ratio
Active
$429,900
3
bds
|
2
ba
|
1,374
sqft
|
built
2001
336 River Glider Ave, North Las Vegas, NV 89084
$-916
Cash flow
-11.1%
Cash-on-Cash Return
3.1%
Cap rate
0.4%
Rent to Value Ratio
Active
$659,990
4
bds
|
3
ba
|
2,562
sqft
|
built
2004
6712 Tattler Dr, North Las Vegas, NV 89084
$-1,593
Cash flow
-12.6%
Cash-on-Cash Return
2.8%
Cap rate
0.4%
Rent to Value Ratio
Active
$453,000
3
bds
|
3
ba
|
2,036
sqft
|
built
2017
7175 Steubling Glen St, North Las Vegas, NV 89084
$-1,058
Cash flow
-12.2%
Cash-on-Cash Return
2.9%
Cap rate
0.5%
Rent to Value Ratio
Active
$645,000
4
bds
|
3
ba
|
2,582
sqft
|
built
2018
6834 Moorland St, North Las Vegas, NV 89084
$-1,788
Cash flow
-14.5%
Cash-on-Cash Return
2.4%
Cap rate
0.4%
Rent to Value Ratio
Active
$530,000
5
bds
|
3
ba
|
2,946
sqft
|
built
2024
1885 Jamie Brook Pl, North Las Vegas, NV 89084
$-1,689
Cash flow
-16.6%
Cash-on-Cash Return
1.9%
Cap rate
0.4%
Rent to Value Ratio