92113 Investment Properties for Sale
Browse homes for sale and investment properties in 92113. Refine your search by price, property type, or more.
Best cash flowing properties in 92113
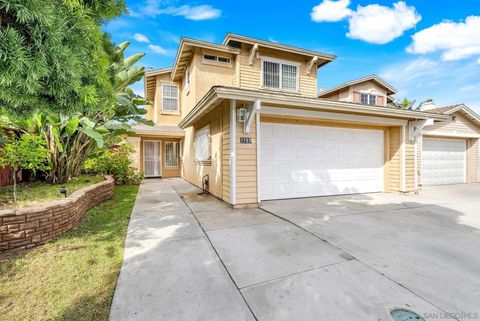
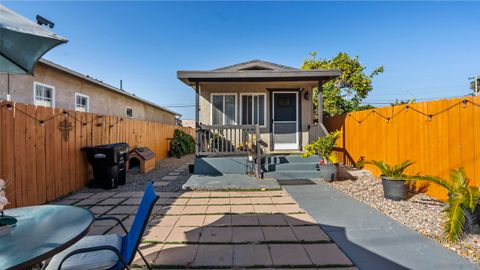
Active
$350,000
3
bds
|
2
ba
|
1,240
sqft
|
built
1980
1149 S 41st St, San Diego, CA 92113
$139
Cash flow
2.1%
Cash-on-Cash Return
6.5%
Cap rate
0.9%
Rent to Value Ratio

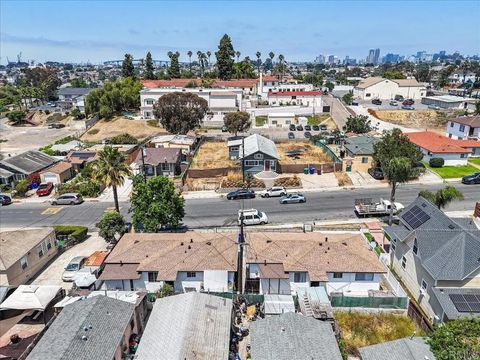
Active
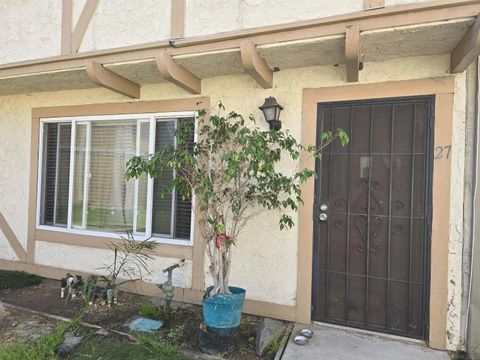
$625,000
3
bds
|
1
ba
|
919
sqft
|
built
2018
3203 Webster Ave, San Diego, CA 92113
$-745
Cash flow
-6.2%
Cash-on-Cash Return
4.6%
Cap rate
0.6%
Rent to Value Ratio
18 out of 39 properties for sale in 92113
Limited Results Shown
Create a free account, or log in to reveal all property listings and enjoy the complete experience.

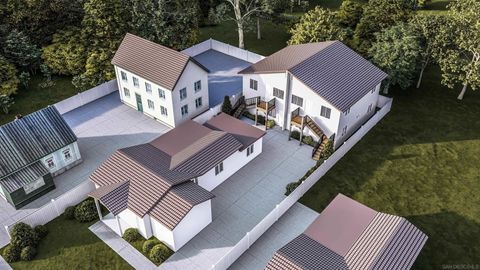
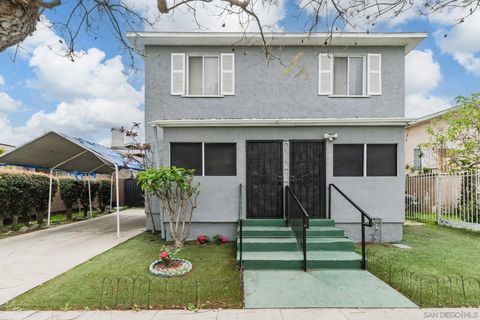
Active
$799,900
3
bds
|
2
ba
|
969
sqft
|
built
2018
425 S Bancroft St, San Diego, CA 92113
$-1,906
Cash flow
-12.4%
Cash-on-Cash Return
3.2%
Cap rate
0.4%
Rent to Value Ratio

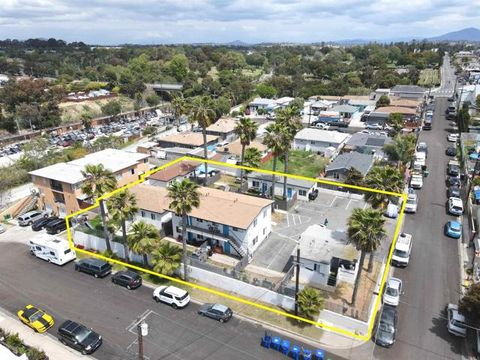
Active
$777,000
2
bds
|
2
ba
|
891
sqft
|
built
1935
1038 Sicard St, San Diego, CA 92113
$-1,721
Cash flow
-11.6%
Cash-on-Cash Return
3.4%
Cap rate
0.4%
Rent to Value Ratio

Active
$775,000
3
bds
|
3
ba
|
1,639
sqft
|
built
1951
812 West St, San Diego, CA 92113
$-1,159
Cash flow
-7.8%
Cash-on-Cash Return
4.3%
Cap rate
0.5%
Rent to Value Ratio
Active
$1,130,000
3
bds
|
2
ba
|
1,011
sqft
|
built
1940
325 Gloria St, San Diego, CA 92113
$-3,023
Cash flow
-14.0%
Cash-on-Cash Return
2.9%
Cap rate
0.3%
Rent to Value Ratio

Active
$1,150,000
3
bds
|
0
ba
|
0
sqft
|
built
1956
3964 Delta St, San Diego, CA 92113
$-3,607
Cash flow
-16.4%
Cash-on-Cash Return
2.3%
Cap rate
0.3%
Rent to Value Ratio
Active
$849,000
4
bds
|
3
ba
|
1,453
sqft
|
built
2004
3585 Acacia St, San Diego, CA 92113
$-1,809
Cash flow
-11.1%
Cash-on-Cash Return
3.5%
Cap rate
0.4%
Rent to Value Ratio
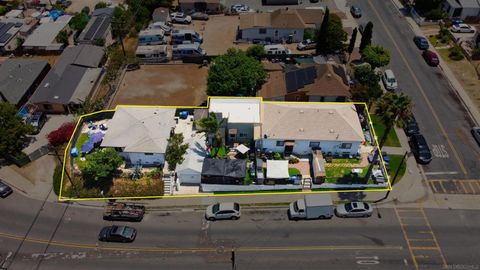
Active
$1,249,000
6
bds
|
4
ba
|
0
sqft
|
built
1956
853 S 32nd St, San Diego, CA 92113
$-4,108
Cash flow
-17.2%
Cash-on-Cash Return
2.1%
Cap rate
0.3%
Rent to Value Ratio

Active
$685,000
4
bds
|
3
ba
|
1,469
sqft
|
built
2006
4300 Newton Ave, San Diego, CA 92113
$-1,339
Cash flow
-10.2%
Cash-on-Cash Return
3.7%
Cap rate
0.5%
Rent to Value Ratio
Active
$925,000
6
bds
|
2
ba
|
0
sqft
|
built
1961
539 S 36th St, San Diego, CA 92113
$-2,538
Cash flow
-14.3%
Cash-on-Cash Return
2.8%
Cap rate
0.3%
Rent to Value Ratio
Active
$675,000
3
bds
|
2
ba
|
858
sqft
|
built
1924
3730 Birch St, San Diego, CA 92113
$-998
Cash flow
-7.7%
Cash-on-Cash Return
4.3%
Cap rate
0.5%
Rent to Value Ratio
Active
$949,000
6
bds
|
4
ba
|
0
sqft
|
built
1908
2925 Franklin Ave, San Diego, CA 92113
$-2,039
Cash flow
-11.2%
Cash-on-Cash Return
3.5%
Cap rate
0.4%
Rent to Value Ratio
Active
$2,500,000
4
bds
|
4
ba
|
0
sqft
|
built
1960
21 S 35th St, San Diego, CA 92113
$-9,260
Cash flow
-19.3%
Cash-on-Cash Return
1.6%
Cap rate
0.2%
Rent to Value Ratio
Active
$1,699,999
8
bds
|
4
ba
|
0
sqft
|
built
1987
1990 Harrison Ave, San Diego, CA 92113
$-6,457
Cash flow
-19.8%
Cash-on-Cash Return
1.5%
Cap rate
0.2%
Rent to Value Ratio

Active
$770,000
2
bds
|
2
ba
|
884
sqft
|
built
1945
420 S 45th St, San Diego, CA 92113
$-1,755
Cash flow
-11.9%
Cash-on-Cash Return
3.3%
Cap rate
0.4%
Rent to Value Ratio

Active
$1,150,000
4
bds
|
2
ba
|
0
sqft
|
built
1960
444 S 36th St, San Diego, CA 92113
$-2,434
Cash flow
-11.0%
Cash-on-Cash Return
3.5%
Cap rate
0.4%
Rent to Value Ratio
Active
$740,000
3
bds
|
2
ba
|
1,054
sqft
|
built
1957
5017 Reynolds St, San Diego, CA 92113
$-1,258
Cash flow
-8.9%
Cash-on-Cash Return
4.0%
Cap rate
0.5%
Rent to Value Ratio