95110 Investment Properties for Sale
Browse homes for sale and investment properties in 95110. Refine your search by price, property type, or more.
Best cash flowing properties in 95110
Active
$470,000
2
bds
|
1
ba
|
870
sqft
|
built
1988
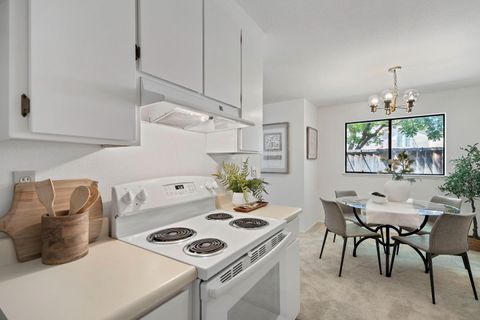
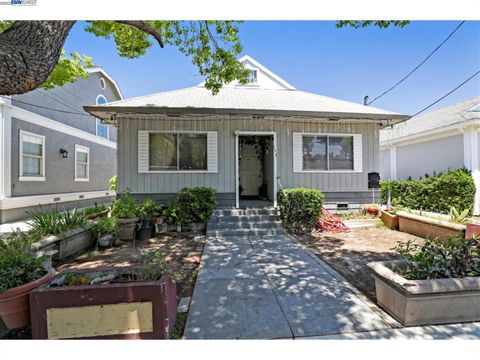
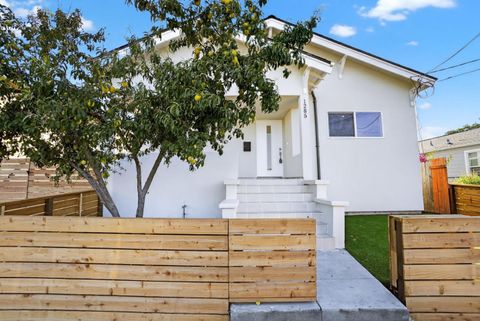
1396 Palm St, San Jose, CA 95110
$-783
Cash flow
-8.7%
Cash-on-Cash Return
4.1%
Cap rate
0.6%
Rent to Value Ratio
Active
$450,000
1
bds
|
1
ba
|
688
sqft
|
built
1988
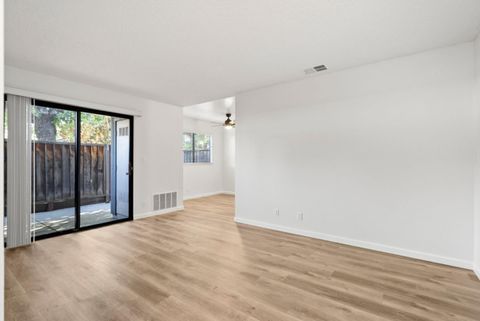
1376 Palm St, San Jose, CA 95110
$-888
Cash flow
-10.3%
Cash-on-Cash Return
3.7%
Cap rate
0.6%
Rent to Value Ratio
17 out of 18 properties for sale in 95110
Limited Results Shown
Create a free account, or log in to reveal all property listings and enjoy the complete experience.
Active
$899,000
2
bds
|
1
ba
|
928
sqft
|
built
1910
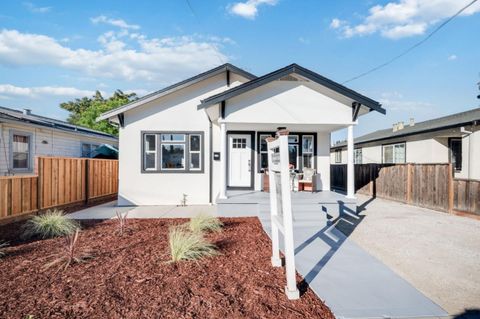
1536 Little Orchard St, San Jose, CA 95110
$-2,407
Cash flow
-14.0%
Cash-on-Cash Return
2.9%
Cap rate
0.3%
Rent to Value Ratio
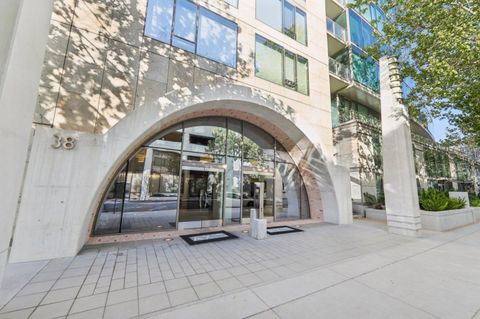
Active
$740,000
1
bds
|
1
ba
|
975
sqft
|
built
2008
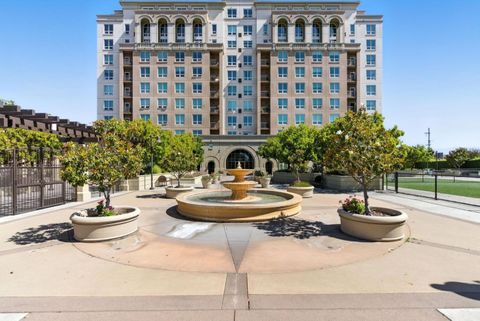
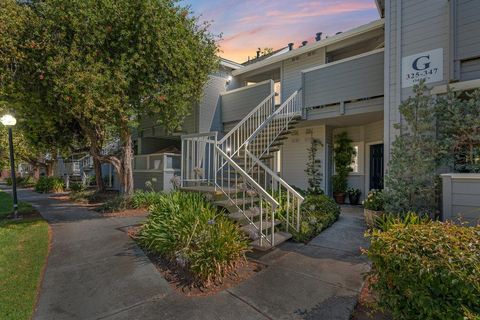
38 N Almaden Blvd, San Jose, CA 95110
$-2,242
Cash flow
-15.8%
Cash-on-Cash Return
2.4%
Cap rate
0.4%
Rent to Value Ratio
Active
$749,000
2
bds
|
2
ba
|
1,024
sqft
|
built
2009
1375 Lick Ave, San Jose, CA 95110
$-2,275
Cash flow
-15.8%
Cash-on-Cash Return
2.4%
Cap rate
0.4%
Rent to Value Ratio
Active
$1,699,999
6
bds
|
0
ba
|
2,525
sqft
|
built
1910
173 Clayton Ave, San Jose, CA 95110
$-5,146
Cash flow
-15.8%
Cash-on-Cash Return
2.4%
Cap rate
0.3%
Rent to Value Ratio
Active
$1,200,000
2
bds
|
2
ba
|
1,296
sqft
|
built
2008
38 N Almaden Blvd, San Jose, CA 95110
$-4,131
Cash flow
-18.0%
Cash-on-Cash Return
1.9%
Cap rate
0.3%
Rent to Value Ratio
Active
$599,000
2
bds
|
2
ba
|
871
sqft
|
built
1987
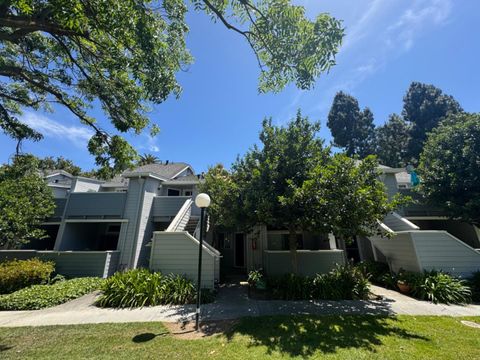
482 Shadowgraph Dr, San Jose, CA 95110
$-1,428
Cash flow
-12.4%
Cash-on-Cash Return
3.2%
Cap rate
0.5%
Rent to Value Ratio
Active
$1,078,888
2
bds
|
2
ba
|
1,306
sqft
|
built
2008
38 N Almaden Blvd, San Jose, CA 95110
$-2,352
Cash flow
-11.4%
Cash-on-Cash Return
3.5%
Cap rate
0.5%
Rent to Value Ratio
Active
$638,000
2
bds
|
2
ba
|
871
sqft
|
built
1987
500 Shadowgraph Dr, San Jose, CA 95110
$-1,625
Cash flow
-13.3%
Cash-on-Cash Return
3.0%
Cap rate
0.5%
Rent to Value Ratio
Active
$459,000
1
bds
|
1
ba
|
560
sqft
|
built
1984
316 Stonegate Cir, San Jose, CA 95110
$-1,341
Cash flow
-15.2%
Cash-on-Cash Return
2.6%
Cap rate
0.4%
Rent to Value Ratio

Active
$599,000
2
bds
|
2
ba
|
955
sqft
|
built
2006
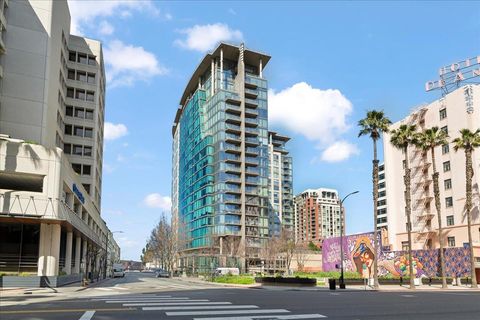
175 W Saint James St, San Jose, CA 95110
$-1,645
Cash flow
-14.3%
Cash-on-Cash Return
2.8%
Cap rate
0.5%
Rent to Value Ratio
Active
$849,000
2
bds
|
1
ba
|
896
sqft
|
built
1939
1157 Plum St, San Jose, CA 95110
$-1,878
Cash flow
-11.5%
Cash-on-Cash Return
3.4%
Cap rate
0.4%
Rent to Value Ratio
Active
$1,099,000
3
bds
|
2
ba
|
1,324
sqft
|
built
1915
1285 Vine St, San Jose, CA 95110
$-3,349
Cash flow
-15.9%
Cash-on-Cash Return
2.4%
Cap rate
0.3%
Rent to Value Ratio
Active
$598,000
2
bds
|
2
ba
|
871
sqft
|
built
1986
331 Shadow Run Dr, San Jose, CA 95110
$-1,423
Cash flow
-12.4%
Cash-on-Cash Return
3.2%
Cap rate
0.5%
Rent to Value Ratio
Active
$985,000
2
bds
|
1
ba
|
942
sqft
|
built
1935
385 Edwards Ave, San Jose, CA 95110
$-2,221
Cash flow
-11.8%
Cash-on-Cash Return
3.4%
Cap rate
0.4%
Rent to Value Ratio
Active
$899,000
3
bds
|
3
ba
|
1,580
sqft
|
built
2006
59 Bassett St, San Jose, CA 95110
$-1,861
Cash flow
-10.8%
Cash-on-Cash Return
3.6%
Cap rate
0.5%
Rent to Value Ratio