Tuscaloosa County Investment Properties for Sale
Browse homes for sale and investment properties in Tuscaloosa County. Refine your search by price, property type, or more.
Best cash flowing properties in Tuscaloosa County
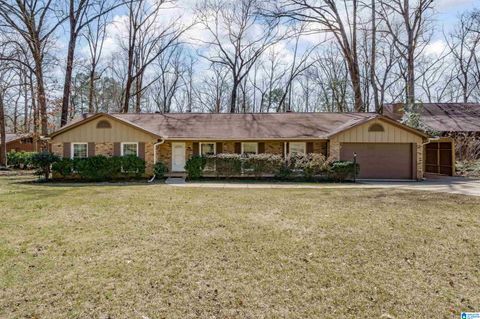
Active
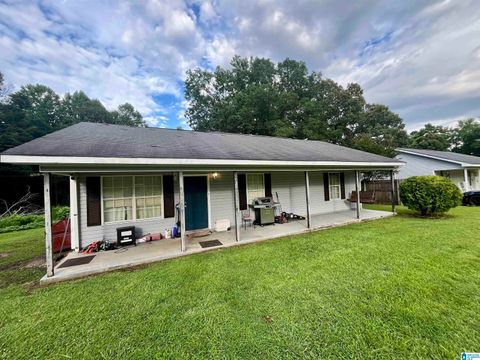
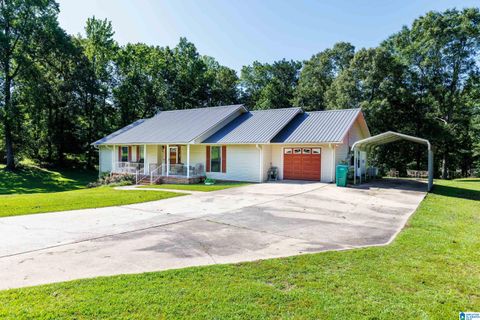
$169,000
3
bds
|
2
ba
|
1,144
sqft
|
built
1999
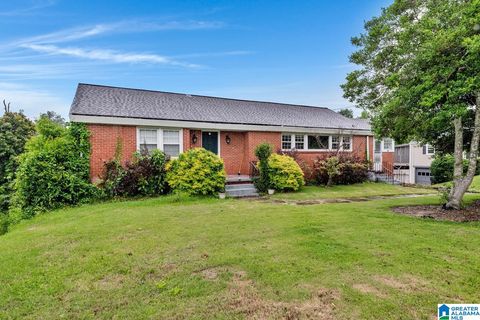
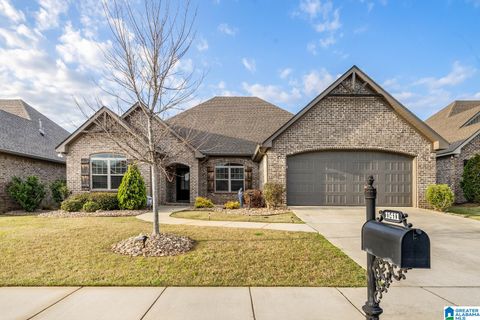
13852 Old Marion Rd, Duncanville, AL 35456
$166
Cash flow
5.1%
Cash-on-Cash Return
6.9%
Cap rate
0.8%
Rent to Value Ratio
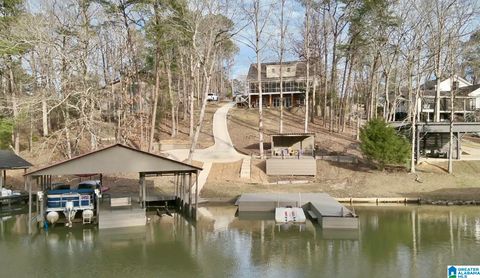
Active
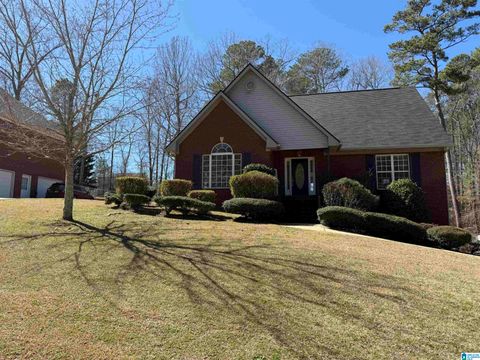
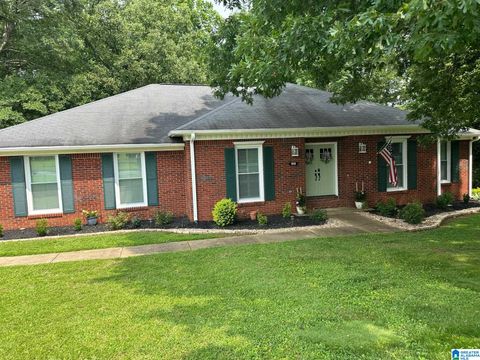
$330,000
3
bds
|
2.5
ba
|
4,260
sqft
|
built
2004
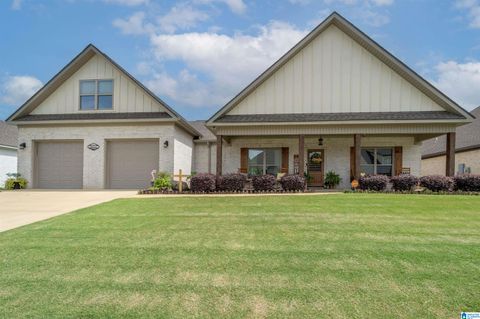
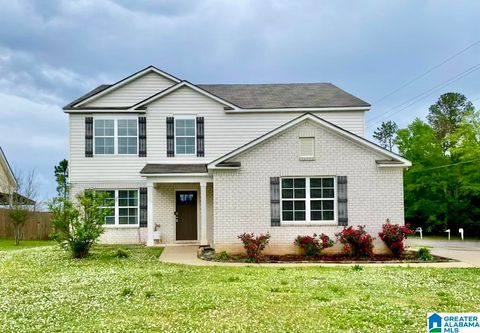
13732 Lisa Dr, Lake View, AL 35111
$25
Cash flow
0.4%
Cash-on-Cash Return
5.8%
Cap rate
0.7%
Rent to Value Ratio
48 out of 85 properties for sale in Tuscaloosa County
Limited Results Shown
Create a free account, or log in to reveal all property listings and enjoy the complete experience.
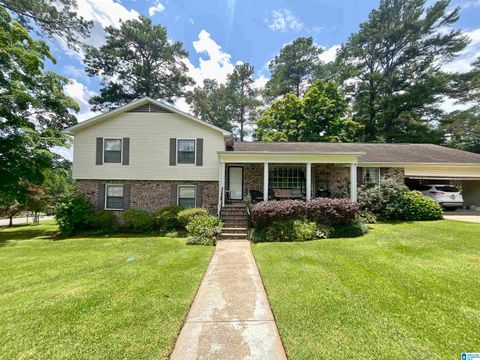
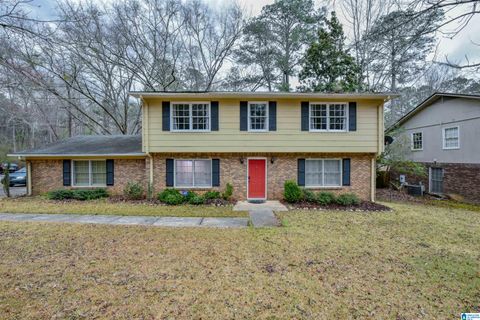
Active
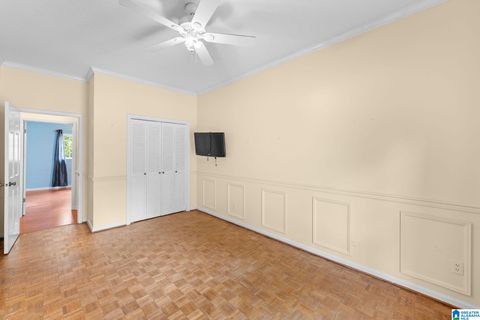
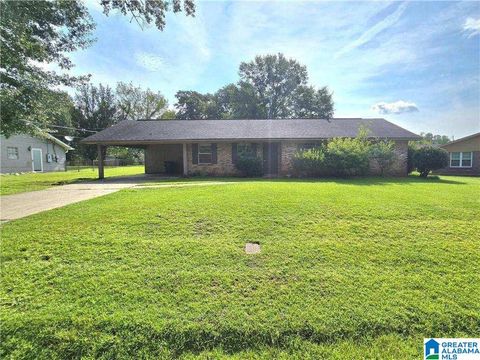
$384,900
6
bds
|
3
ba
|
3,962
sqft
|
built
1970
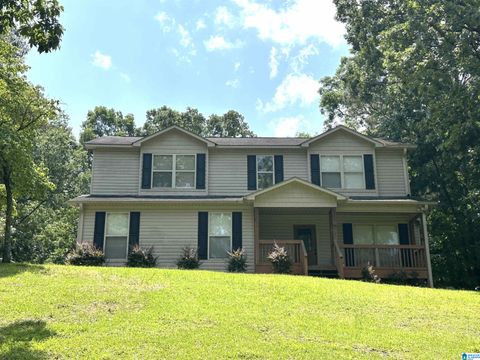
3411 Arcadia Dr, Tuscaloosa, AL 35404
$-441
Cash flow
-6.0%
Cash-on-Cash Return
4.3%
Cap rate
0.5%
Rent to Value Ratio
Active
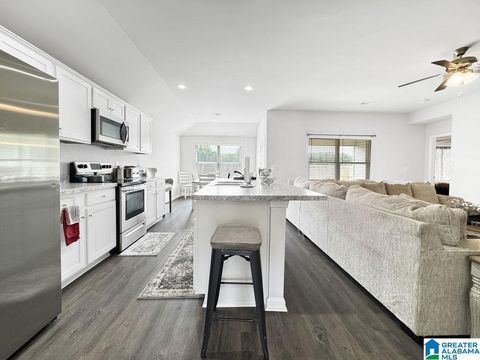
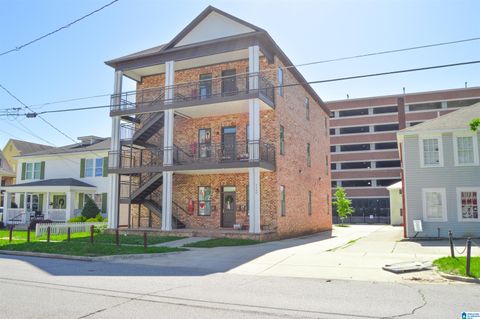
$260,000
4
bds
|
2
ba
|
3,238
sqft
|
built
2023
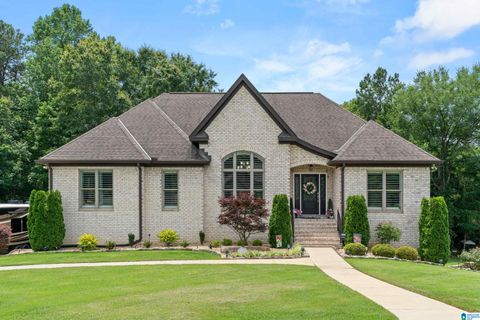
12340 Choctaw Cir, Moundville, AL 35474
$-84
Cash flow
-1.7%
Cash-on-Cash Return
5.3%
Cap rate
0.7%
Rent to Value Ratio
Active
$339,000
5
bds
|
0
ba
|
3,583
sqft
|
built
1976
5043 Pinewood Ln, Tuscaloosa, AL 35405
$-383
Cash flow
-5.9%
Cash-on-Cash Return
4.9%
Cap rate
0.6%
Rent to Value Ratio
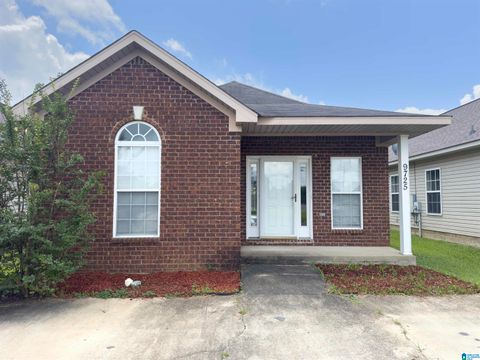
Active
$196,000
3
bds
|
2
ba
|
1,278
sqft
|
built
2005
9725 Moonlight Dr, Tuscaloosa, AL 35405
$-51
Cash flow
-1.4%
Cash-on-Cash Return
5.4%
Cap rate
0.7%
Rent to Value Ratio
Active
$150,000
3
bds
|
0
ba
|
950
sqft
|
built
1969
3504 36th Ct, Tuscaloosa, AL 35401
$-21
Cash flow
-0.7%
Cash-on-Cash Return
6.1%
Cap rate
0.7%
Rent to Value Ratio
Active
$265,000
3
bds
|
0
ba
|
1,424
sqft
|
built
1971
3409 22nd St, Northport, AL 35476
$-288
Cash flow
-5.7%
Cash-on-Cash Return
4.4%
Cap rate
0.5%
Rent to Value Ratio
Active
$279,900
3
bds
|
0
ba
|
1,760
sqft
|
built
1950
14 Windsor Dr, Tuscaloosa, AL 35404
$-152
Cash flow
-2.8%
Cash-on-Cash Return
5.0%
Cap rate
0.6%
Rent to Value Ratio
Active
$437,900
4
bds
|
0
ba
|
2,454
sqft
|
built
2019
11967 Glen Ridge Blvd, Moundville, AL 35474
$-658
Cash flow
-7.8%
Cash-on-Cash Return
3.9%
Cap rate
0.5%
Rent to Value Ratio
Active
$270,000
3
bds
|
0
ba
|
1,653
sqft
|
built
2011
21131 Delmar Dr, Lake View, AL 35111
$-36
Cash flow
-0.7%
Cash-on-Cash Return
5.5%
Cap rate
0.7%
Rent to Value Ratio
Active
$549,000
4
bds
|
0
ba
|
3,178
sqft
|
built
2020
10488 Nicole St, Vance, AL 35490
$-1,011
Cash flow
-9.6%
Cash-on-Cash Return
3.5%
Cap rate
0.4%
Rent to Value Ratio
Active
$295,000
3
bds
|
2
ba
|
2,014
sqft
|
built
1996
20571 Faynell Cir, Woodstock, AL 35188
$-154
Cash flow
-2.7%
Cash-on-Cash Return
5.1%
Cap rate
0.6%
Rent to Value Ratio
Active
$429,000
3
bds
|
0
ba
|
2,218
sqft
|
built
1987
1019 54th Ave E, Tuscaloosa, AL 35404
$-998
Cash flow
-12.1%
Cash-on-Cash Return
3.5%
Cap rate
0.4%
Rent to Value Ratio

Active
$575,000
3
bds
|
0
ba
|
3,360
sqft
|
built
1955
704 Rice Valley Rd N, Tuscaloosa, AL 35406
$-1,760
Cash flow
-16.0%
Cash-on-Cash Return
2.6%
Cap rate
0.3%
Rent to Value Ratio
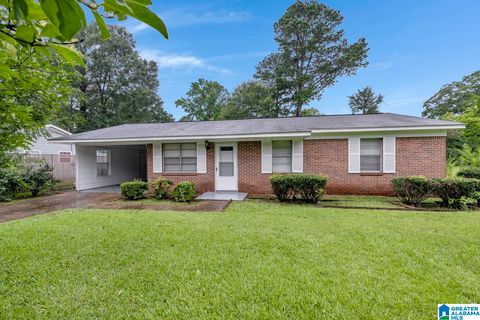
Active
$197,900
3
bds
|
0
ba
|
2,906
sqft
|
built
1986
3835 23rd Ct E, Tuscaloosa, AL 35405
$-67
Cash flow
-1.8%
Cash-on-Cash Return
5.9%
Cap rate
0.7%
Rent to Value Ratio
Active
$2,640,000
4
bds
|
0
ba
|
0
sqft
|
built
2020
1120 8th Ave, Tuscaloosa, AL 35401
$-12,679
Cash flow
-25.1%
Cash-on-Cash Return
0.5%
Cap rate
0.1%
Rent to Value Ratio
Active
$2,640,000
3
bds
|
0
ba
|
0
sqft
|
built
2012
1521 8th St, Tuscaloosa, AL 35401
$-12,403
Cash flow
-24.5%
Cash-on-Cash Return
0.6%
Cap rate
0.1%
Rent to Value Ratio
Active
$5,400,000
3
bds
|
0
ba
|
0
sqft
|
built
2013
1216 14th Ave, Tuscaloosa, AL 35401
$-26,467
Cash flow
-25.6%
Cash-on-Cash Return
0.4%
Cap rate
0.0%
Rent to Value Ratio
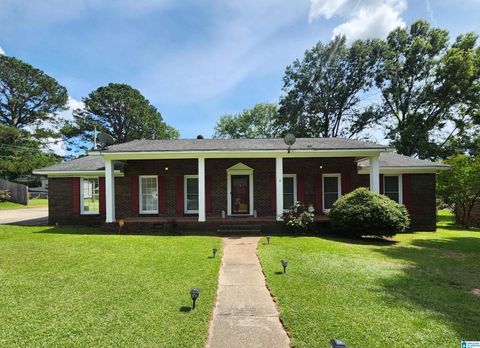
Active
$359,000
4
bds
|
0
ba
|
4,155
sqft
|
built
1963
4233 Hillsboro Dr, Tuscaloosa, AL 35404
$-149
Cash flow
-2.2%
Cash-on-Cash Return
5.8%
Cap rate
0.7%
Rent to Value Ratio
Active
$449,000
4
bds
|
0
ba
|
2,577
sqft
|
built
2017
9452 Crete Cir, Tuscaloosa, AL 35406
$-661
Cash flow
-7.7%
Cash-on-Cash Return
4.5%
Cap rate
0.6%
Rent to Value Ratio
Active
$299,900
5
bds
|
3.5
ba
|
4,128
sqft
|
built
1955
221 Short 24th Ave E, Tuscaloosa, AL 35404
$-39
Cash flow
-0.7%
Cash-on-Cash Return
5.5%
Cap rate
0.7%
Rent to Value Ratio

Active
$539,000
4
bds
|
0
ba
|
3,563
sqft
|
built
1972
5222 Northwood Lake Dr E, Northport, AL 35473
$-855
Cash flow
-8.3%
Cash-on-Cash Return
3.8%
Cap rate
0.5%
Rent to Value Ratio
Active
$439,000
6
bds
|
0
ba
|
4,242
sqft
|
built
2005
10821 Dogwood Cir, Vance, AL 35490
$-360
Cash flow
-4.3%
Cash-on-Cash Return
5.3%
Cap rate
0.6%
Rent to Value Ratio
Active
$275,000
3
bds
|
0
ba
|
2,271
sqft
|
built
1962
4624 14th St E, Tuscaloosa, AL 35404
$-194
Cash flow
-3.7%
Cash-on-Cash Return
5.4%
Cap rate
0.7%
Rent to Value Ratio
Active
$699,900
3
bds
|
0
ba
|
1,985
sqft
|
built
1930
1531 7th St, Tuscaloosa, AL 35401
$-1,722
Cash flow
-12.8%
Cash-on-Cash Return
3.3%
Cap rate
0.4%
Rent to Value Ratio
Active
$350,000
4
bds
|
3.5
ba
|
2,242
sqft
|
built
1988
13563 Date St, Northport, AL 35475
$-276
Cash flow
-4.1%
Cash-on-Cash Return
4.7%
Cap rate
0.6%
Rent to Value Ratio
Active
$279,900
3
bds
|
2
ba
|
1,665
sqft
|
built
1983
841 Olde Mill Trce, Cottondale, AL 35453
$-152
Cash flow
-2.8%
Cash-on-Cash Return
5.0%
Cap rate
0.6%
Rent to Value Ratio
Active
$2,200,000
6
bds
|
0
ba
|
6,596
sqft
|
built
2006
3009 Harbor Ridge Way, Tuscaloosa, AL 35406
$-7,967
Cash flow
-18.9%
Cash-on-Cash Return
1.9%
Cap rate
0.2%
Rent to Value Ratio
Active
$283,000
3
bds
|
0
ba
|
3,136
sqft
|
built
1972
20867 Sharon Dr, Lake View, AL 35111
$-312
Cash flow
-5.8%
Cash-on-Cash Return
4.4%
Cap rate
0.5%
Rent to Value Ratio
Active
$464,900
4
bds
|
0
ba
|
2,384
sqft
|
built
2018
11411 Stella Way, Northport, AL 35475
$-268
Cash flow
-3.0%
Cash-on-Cash Return
5.0%
Cap rate
0.6%
Rent to Value Ratio
Active
$314,900
3
bds
|
0
ba
|
1,410
sqft
|
built
2006
600 13th St E, Tuscaloosa, AL 35401
$-402
Cash flow
-6.7%
Cash-on-Cash Return
4.7%
Cap rate
0.6%
Rent to Value Ratio
Active
$320,000
5
bds
|
0
ba
|
2,862
sqft
|
built
2020
11309 Cedar Glades Dr, Vance, AL 35490
$-291
Cash flow
-4.7%
Cash-on-Cash Return
5.2%
Cap rate
0.6%
Rent to Value Ratio
Active
$159,900
1
bds
|
0
ba
|
708
sqft
|
built
1996
120 15th St E, Tuscaloosa, AL 35401
$-7
Cash flow
-0.2%
Cash-on-Cash Return
6.2%
Cap rate
0.8%
Rent to Value Ratio
Active
$289,900
4
bds
|
0
ba
|
2,288
sqft
|
built
1974
4309 Ridgemont Ave, Northport, AL 35473
$8
Cash flow
0.1%
Cash-on-Cash Return
5.7%
Cap rate
0.7%
Rent to Value Ratio
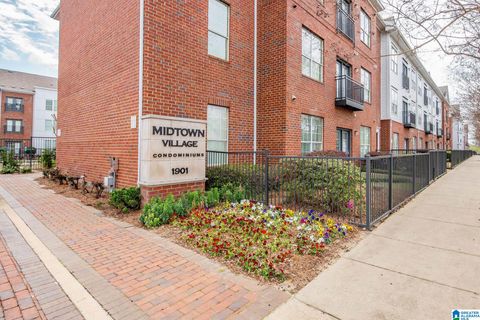
Active
$154,900
1
bds
|
0
ba
|
804
sqft
|
built
2007
1901 5th Ave E, Tuscaloosa, AL 35401
$-130
Cash flow
-4.4%
Cash-on-Cash Return
5.3%
Cap rate
0.9%
Rent to Value Ratio
Active
$349,900
3
bds
|
0
ba
|
2,240
sqft
|
built
1966
64 Cherokee Hls, Tuscaloosa, AL 35404
$-585
Cash flow
-8.7%
Cash-on-Cash Return
4.3%
Cap rate
0.5%
Rent to Value Ratio
Active
$899,000
5
bds
|
0
ba
|
3,680
sqft
|
built
1986
15730 Beacon Point Dr, Northport, AL 35475
$-2,115
Cash flow
-12.3%
Cash-on-Cash Return
2.9%
Cap rate
0.3%
Rent to Value Ratio
Active
$330,000
4
bds
|
0
ba
|
2,346
sqft
|
built
2007
13426 Todd Dr, Lake View, AL 35111
$-182
Cash flow
-2.9%
Cash-on-Cash Return
5.0%
Cap rate
0.6%
Rent to Value Ratio
Active
$459,900
4
bds
|
0
ba
|
3,388
sqft
|
built
1985
863 66th St, Tuscaloosa, AL 35405
$-814
Cash flow
-9.2%
Cash-on-Cash Return
4.1%
Cap rate
0.5%
Rent to Value Ratio