Atlanta, GA Investment Properties for Sale
Browse homes for sale and investment properties in Atlanta, GA. Refine your search by price, property type, or more.
Best cash flowing properties in Atlanta, GA
Active
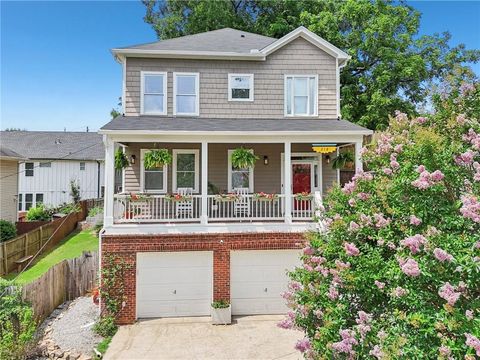
$199,995
3
bds
|
0
ba
|
1,152
sqft
|
built
1943
2803 3rd Ave SW, Atlanta, GA 30315
$167
Cash flow
4.4%
Cash-on-Cash Return
7.3%
Cap rate
1.1%
Rent to Value Ratio
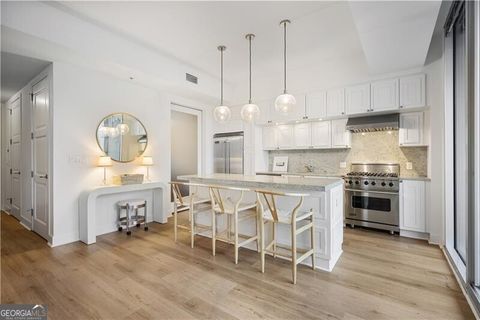
Active
$195,000
3
bds
|
0
ba
|
792
sqft
|
built
1960
1636 Mary George Ave NW, Atlanta, GA 30318
$121
Cash flow
3.2%
Cash-on-Cash Return
7.0%
Cap rate
0.9%
Rent to Value Ratio
3,863 out of 4,543 properties for sale in Atlanta, GA
Limited Results Shown
Create a free account, or log in to reveal all property listings and enjoy the complete experience.
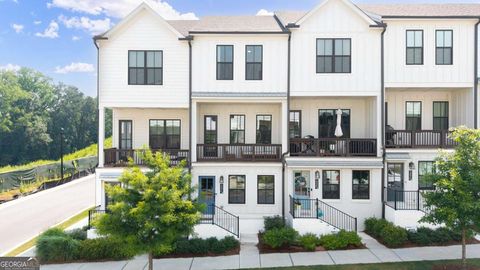
Active
$1,495,000
5
bds
|
0
ba
|
3,010
sqft
|
built
1938
879 Wildwood Rd NE, Atlanta, GA 30324
$-5,941
Cash flow
-20.7%
Cash-on-Cash Return
1.5%
Cap rate
0.3%
Rent to Value Ratio
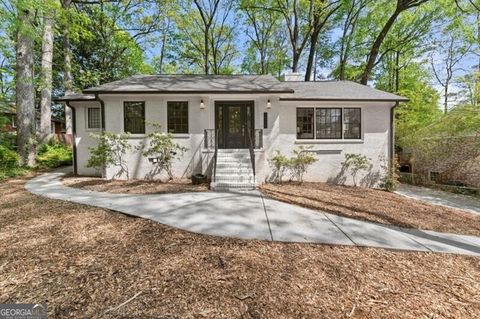
Active
$260,000
2
bds
|
1
ba
|
868
sqft
|
built
1960
1879 Johnson Rd NE, Atlanta, GA 30306
$-556
Cash flow
-11.2%
Cash-on-Cash Return
3.7%
Cap rate
0.7%
Rent to Value Ratio
Active
$430,000
3
bds
|
0
ba
|
1,171
sqft
|
built
2023
1247 Zucchini Cir SE, Atlanta, GA 30315
$-970
Cash flow
-11.8%
Cash-on-Cash Return
3.6%
Cap rate
0.7%
Rent to Value Ratio
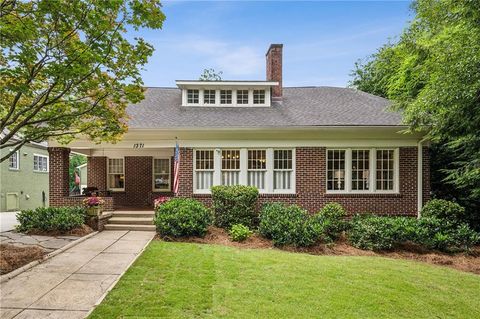
Active
$1,550,000
4
bds
|
5
ba
|
4,736
sqft
|
built
1923
1371 N Highland Ave NE, Atlanta, GA 30306
$-4,886
Cash flow
-16.4%
Cash-on-Cash Return
2.5%
Cap rate
0.4%
Rent to Value Ratio
Active
$199,995
3
bds
|
0
ba
|
1,152
sqft
|
built
1943
2803 3rd Ave SW, Atlanta, GA 30315
$167
Cash flow
4.4%
Cash-on-Cash Return
7.3%
Cap rate
1.1%
Rent to Value Ratio

Active
$4,195,000
6
bds
|
0
ba
|
6,819
sqft
|
built
1935
280 Blackland Rd NW, Atlanta, GA 30342
$-19,913
Cash flow
-24.8%
Cash-on-Cash Return
0.6%
Cap rate
0.2%
Rent to Value Ratio
Active
$749,000
3
bds
|
0
ba
|
1,838
sqft
|
built
1952
3915 Ivy Rd NE, Atlanta, GA 30342
$-1,612
Cash flow
-11.2%
Cash-on-Cash Return
3.7%
Cap rate
0.6%
Rent to Value Ratio
Active
$279,999
3
bds
|
3
ba
|
0
sqft
|
built
2002
3417 Sable Chase Ln, Atlanta, GA 30349
$-597
Cash flow
-11.1%
Cash-on-Cash Return
3.7%
Cap rate
0.6%
Rent to Value Ratio
Active
$475,000
3
bds
|
0
ba
|
2,501
sqft
|
built
2004
3655 Chattahoochee Summit Dr SE, Atlanta, GA 30339
$-780
Cash flow
-8.6%
Cash-on-Cash Return
4.3%
Cap rate
0.7%
Rent to Value Ratio
Active
$425,000
3
bds
|
4
ba
|
1,798
sqft
|
built
1972
13 Ivy Trl NE, Atlanta, GA 30342
$-848
Cash flow
-10.4%
Cash-on-Cash Return
3.9%
Cap rate
0.8%
Rent to Value Ratio
Active
$289,000
3
bds
|
0
ba
|
1,522
sqft
|
built
1955
1977 Wee Kirk Rd SE, Atlanta, GA 30316
$-243
Cash flow
-4.4%
Cash-on-Cash Return
5.3%
Cap rate
0.8%
Rent to Value Ratio

Active
$935,000
5
bds
|
3
ba
|
3,040
sqft
|
built
2021
940 Longley Ave NW, Atlanta, GA 30318
$-2,242
Cash flow
-12.5%
Cash-on-Cash Return
3.4%
Cap rate
0.6%
Rent to Value Ratio
Active
$499,000
5
bds
|
0
ba
|
2,624
sqft
|
built
1963
2468 Dresden Dr, Atlanta, GA 30341
$-1,147
Cash flow
-12.0%
Cash-on-Cash Return
3.5%
Cap rate
0.6%
Rent to Value Ratio
Active
$220,000
1
bds
|
0
ba
|
0
sqft
|
built
1927
320 Martin Luther King Jr Dr SE, Atlanta, GA 30312
$-279
Cash flow
-6.6%
Cash-on-Cash Return
4.7%
Cap rate
0.9%
Rent to Value Ratio
Active
$329,000
2
bds
|
2
ba
|
0
sqft
|
built
2006
3150 Woodwalk Dr SE, Atlanta, GA 30339
$-553
Cash flow
-8.8%
Cash-on-Cash Return
4.2%
Cap rate
0.7%
Rent to Value Ratio
Active under contract
$650,000
3
bds
|
0
ba
|
1,468
sqft
|
built
1954
1494 May Ave SE, Atlanta, GA 30316
$-1,461
Cash flow
-11.7%
Cash-on-Cash Return
3.6%
Cap rate
0.4%
Rent to Value Ratio

Active
$152,500
3
bds
|
0
ba
|
1,295
sqft
|
built
1950
2576 Godfrey Dr NW, Atlanta, GA 30318
$-6
Cash flow
-0.2%
Cash-on-Cash Return
6.2%
Cap rate
1.0%
Rent to Value Ratio
Active
$525,000
2
bds
|
0
ba
|
1,753
sqft
|
built
2005
361 17th St NW, Atlanta, GA 30363
$-1,683
Cash flow
-16.7%
Cash-on-Cash Return
2.4%
Cap rate
0.6%
Rent to Value Ratio
Active
$225,000
2
bds
|
0
ba
|
0
sqft
|
built
1981
3428 Ivys Walk, Atlanta, GA 30340
$-404
Cash flow
-9.4%
Cash-on-Cash Return
4.1%
Cap rate
0.8%
Rent to Value Ratio
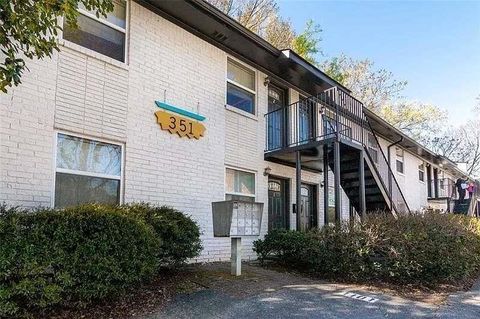
Active
$279,000
2
bds
|
1
ba
|
667
sqft
|
built
1965
351 Cherokee Ave SE, Atlanta, GA 30312
$-742
Cash flow
-13.9%
Cash-on-Cash Return
3.1%
Cap rate
0.7%
Rent to Value Ratio
Active
$2,995,000
5
bds
|
0
ba
|
6,005
sqft
|
built
2025
3680 Tanglewood Dr SE, Atlanta, GA 30339
$-13,521
Cash flow
-23.6%
Cash-on-Cash Return
0.8%
Cap rate
0.1%
Rent to Value Ratio
Active
$237,000
2
bds
|
2
ba
|
1,372
sqft
|
built
1985
2209 N Forest Trl, Atlanta, GA 30338
$-287
Cash flow
-6.3%
Cash-on-Cash Return
4.8%
Cap rate
1.0%
Rent to Value Ratio
Active
$820,000
4
bds
|
4
ba
|
0
sqft
|
built
2004
218 South Ave SE, Atlanta, GA 30315
$-1,860
Cash flow
-11.8%
Cash-on-Cash Return
3.5%
Cap rate
0.5%
Rent to Value Ratio
Active
$590,000
2
bds
|
0
ba
|
1,381
sqft
|
built
2010
1820 Peachtree St NW, Atlanta, GA 30309
$-1,317
Cash flow
-11.6%
Cash-on-Cash Return
3.6%
Cap rate
0.6%
Rent to Value Ratio
Active
$585,000
3
bds
|
2
ba
|
1,450
sqft
|
built
1990
587 Virginia Rd, Atlanta, GA 30338
$-2,038
Cash flow
-18.2%
Cash-on-Cash Return
2.1%
Cap rate
0.5%
Rent to Value Ratio
Active
$285,000
3
bds
|
0
ba
|
1,809
sqft
|
built
1960
3080 Lynhurst Cir SW, Atlanta, GA 30311
$-297
Cash flow
-5.4%
Cash-on-Cash Return
5.0%
Cap rate
0.7%
Rent to Value Ratio
Active under contract
$149,900
4
bds
|
0
ba
|
698
sqft
|
built
1956
2069 Chicago Ave NW, Atlanta, GA 30314
$-89
Cash flow
-3.1%
Cash-on-Cash Return
5.6%
Cap rate
0.9%
Rent to Value Ratio
Active
$1,549,000
5
bds
|
0
ba
|
5,124
sqft
|
built
2018
1099 Vista Trl NE, Atlanta, GA 30324
$-1,804
Cash flow
-6.1%
Cash-on-Cash Return
4.9%
Cap rate
0.7%
Rent to Value Ratio
Active
$850,000
3
bds
|
0
ba
|
2,662
sqft
|
built
2016
2196 Niles Pl NE, Atlanta, GA 30324
$-1,520
Cash flow
-9.3%
Cash-on-Cash Return
4.1%
Cap rate
0.7%
Rent to Value Ratio
Active under contract
$704,900
4
bds
|
0
ba
|
2,496
sqft
|
built
1977
4733 Eidson Rd, Atlanta, GA 30360
$-1,102
Cash flow
-8.2%
Cash-on-Cash Return
4.4%
Cap rate
0.6%
Rent to Value Ratio
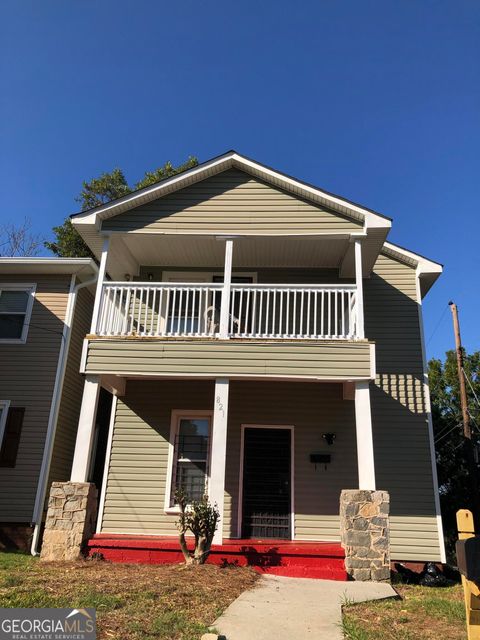
Active
$349,500
5
bds
|
0
ba
|
1,700
sqft
|
built
1920
821 Beckwith St SW, Atlanta, GA 30314
$-777
Cash flow
-11.6%
Cash-on-Cash Return
3.6%
Cap rate
0.6%
Rent to Value Ratio
Active
$399,900
1
bds
|
0
ba
|
0
sqft
|
built
2008
1080 Peachtree St NE, Atlanta, GA 30309
$-7,715
Cash flow
-100.7%
Cash-on-Cash Return
-16.9%
Cap rate
0.6%
Rent to Value Ratio
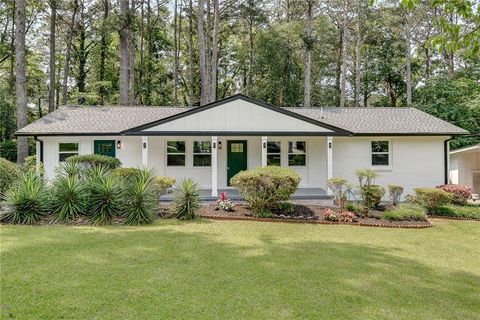
Active
$379,900
4
bds
|
3
ba
|
0
sqft
|
built
1959
1891 Sahara Dr SE, Atlanta, GA 30316
$-839
Cash flow
-11.5%
Cash-on-Cash Return
3.6%
Cap rate
0.5%
Rent to Value Ratio
Active
$195,000
3
bds
|
0
ba
|
792
sqft
|
built
1960
1636 Mary George Ave NW, Atlanta, GA 30318
$121
Cash flow
3.2%
Cash-on-Cash Return
7.0%
Cap rate
0.9%
Rent to Value Ratio
Active
$229,000
3
bds
|
2
ba
|
0
sqft
|
built
1964
4266 Roswell Rd NE, Atlanta, GA 30342
$-211
Cash flow
-4.8%
Cash-on-Cash Return
5.2%
Cap rate
1.0%
Rent to Value Ratio

Active
$335,000
4
bds
|
0
ba
|
1,864
sqft
|
built
2006
125 Redsage Rdg, Atlanta, GA 30349
$-664
Cash flow
-10.3%
Cash-on-Cash Return
3.9%
Cap rate
0.7%
Rent to Value Ratio
Active
$290,000
1
bds
|
0
ba
|
0
sqft
|
built
1992
199 14th St NE, Atlanta, GA 30309
$-909
Cash flow
-16.4%
Cash-on-Cash Return
2.5%
Cap rate
0.7%
Rent to Value Ratio
Active under contract
$389,900
3
bds
|
0
ba
|
1,466
sqft
|
built
2000
901 Winfield Ave SE, Atlanta, GA 30316
$-879
Cash flow
-11.8%
Cash-on-Cash Return
3.6%
Cap rate
0.7%
Rent to Value Ratio
Pending
$424,900
3
bds
|
3
ba
|
2,222
sqft
|
built
1940
458 Holly St NW, Atlanta, GA 30318
$-293
Cash flow
-3.6%
Cash-on-Cash Return
5.4%
Cap rate
0.7%
Rent to Value Ratio
Active
$450,000
3
bds
|
0
ba
|
1,782
sqft
|
built
2019
2023 Yellow Finch Trl SE, Atlanta, GA 30316
$-853
Cash flow
-9.9%
Cash-on-Cash Return
4.0%
Cap rate
0.6%
Rent to Value Ratio