Avon, IN Investment Properties for Sale
Browse homes for sale and investment properties in Avon, IN. Refine your search by price, property type, or more.
Best cash flowing properties in Avon, IN
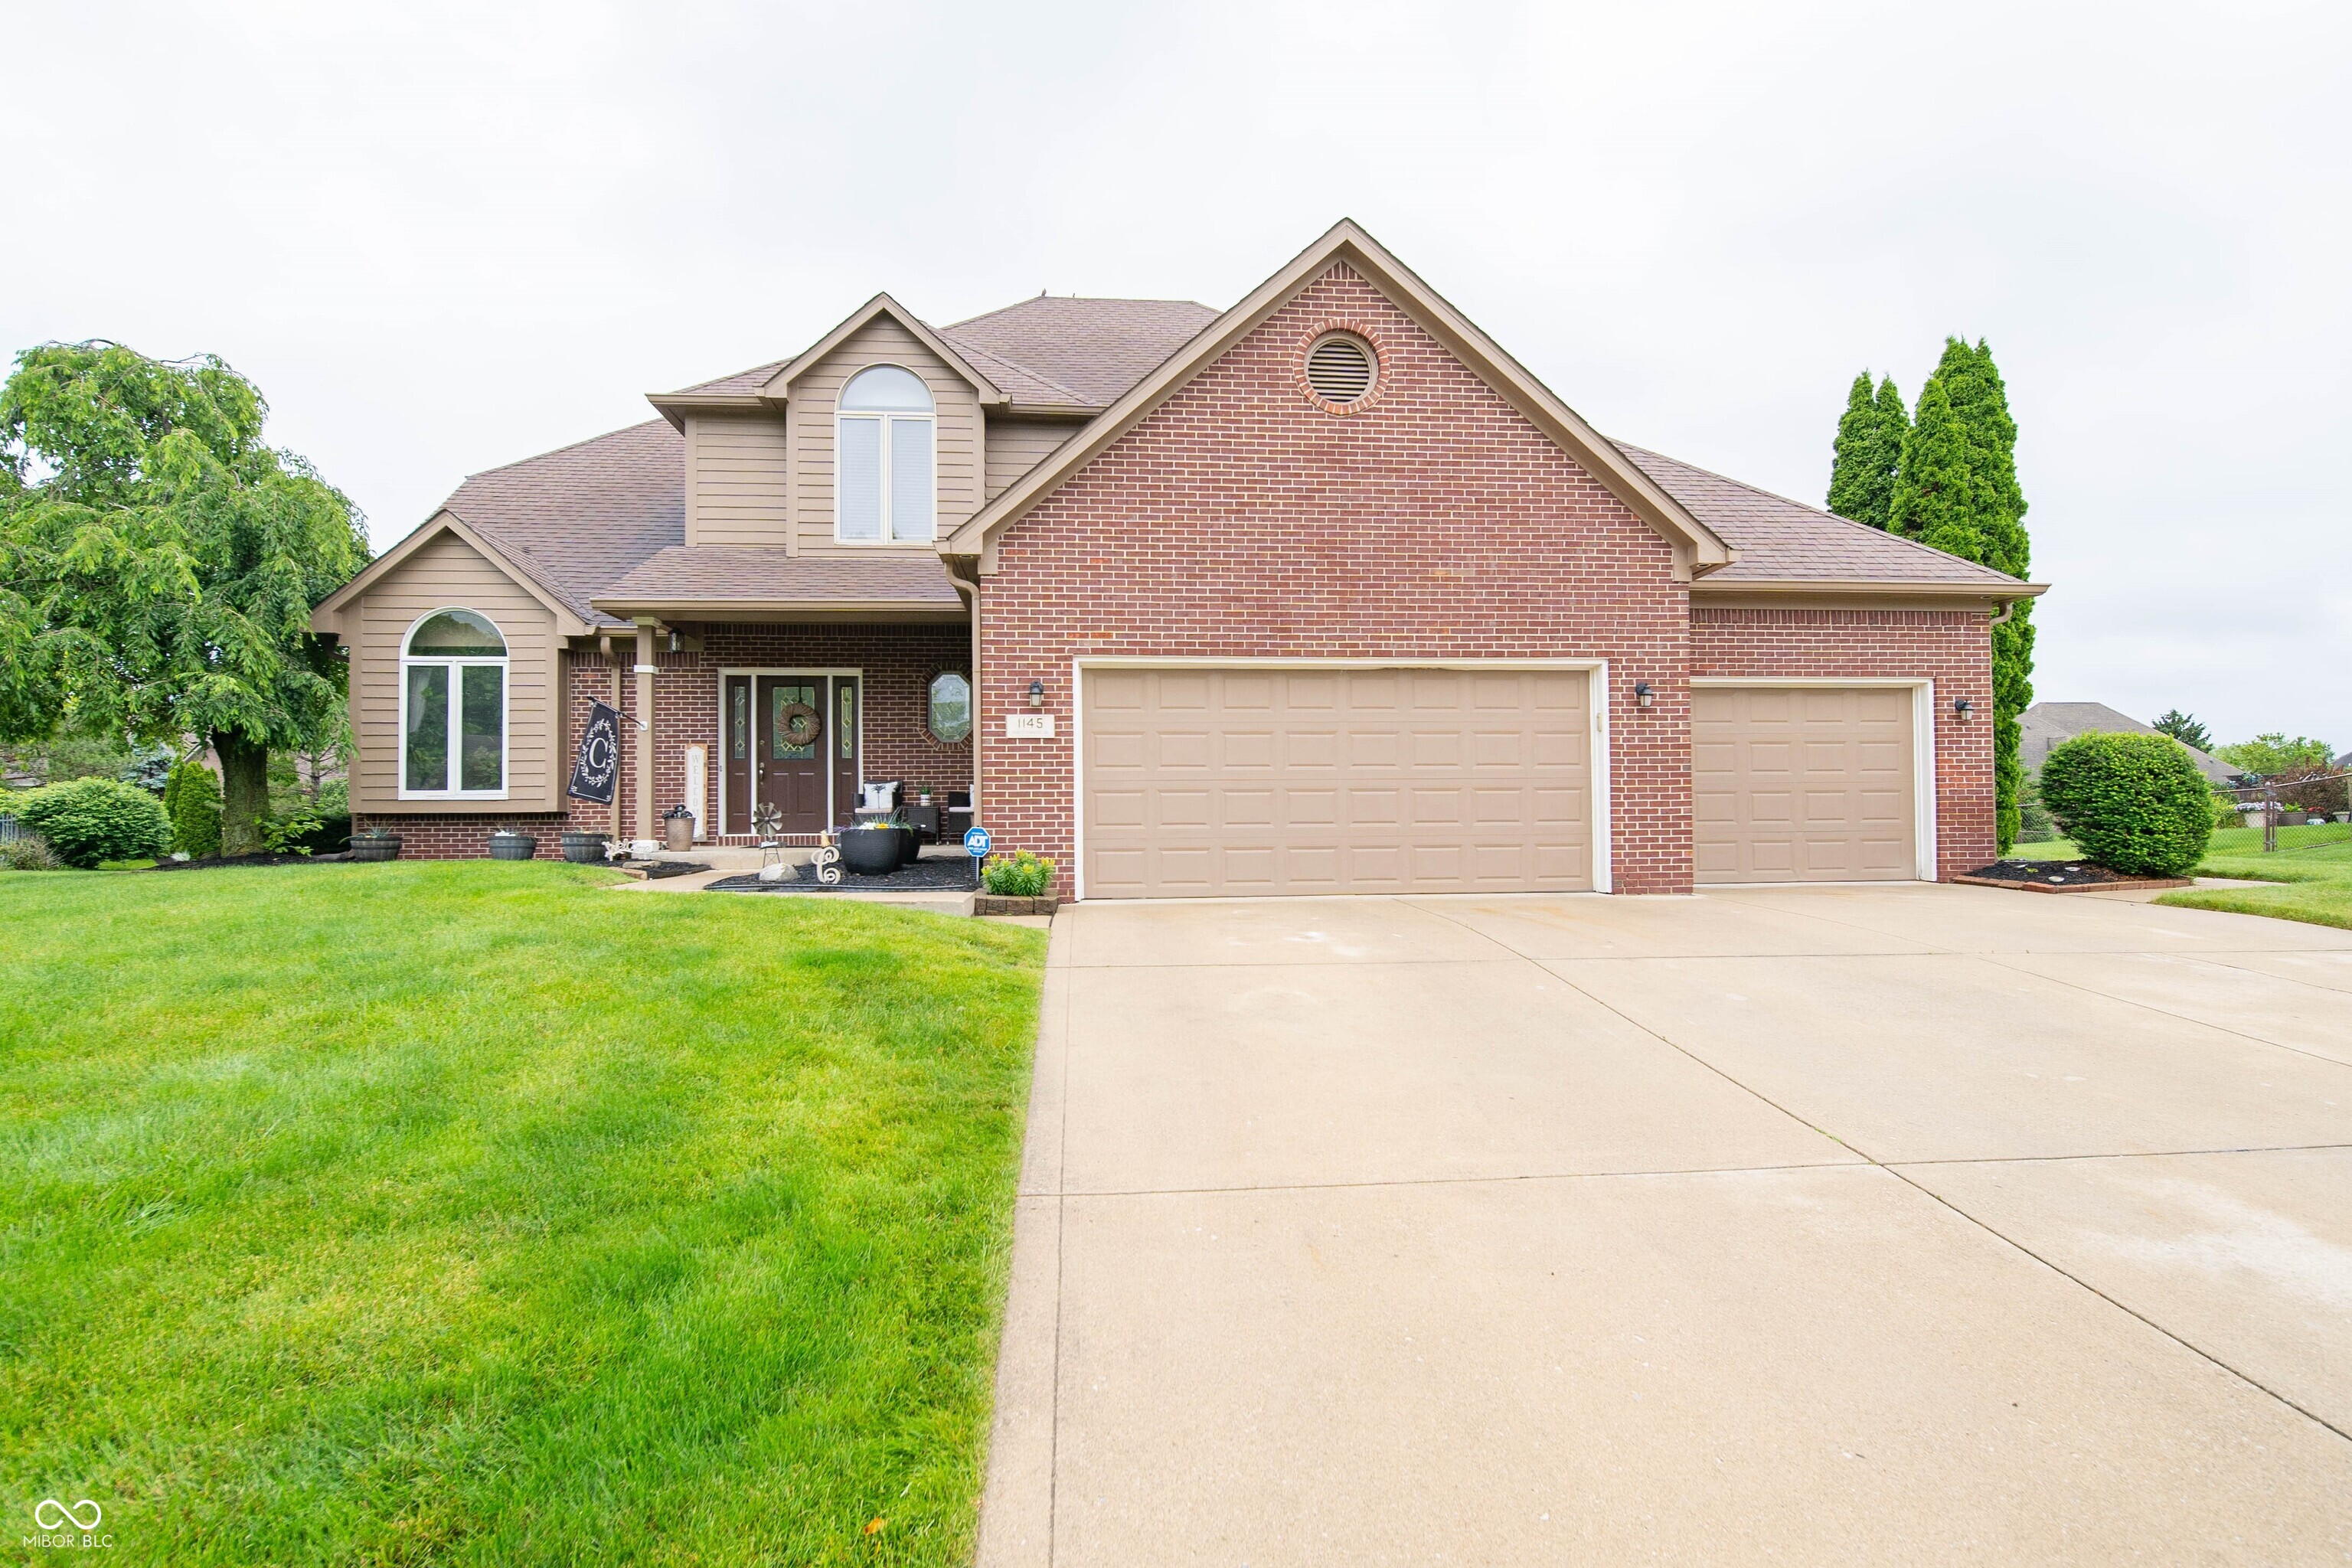
Active
$925,000
5
bds
|
4
ba
|
4,952
sqft
|
built
1997
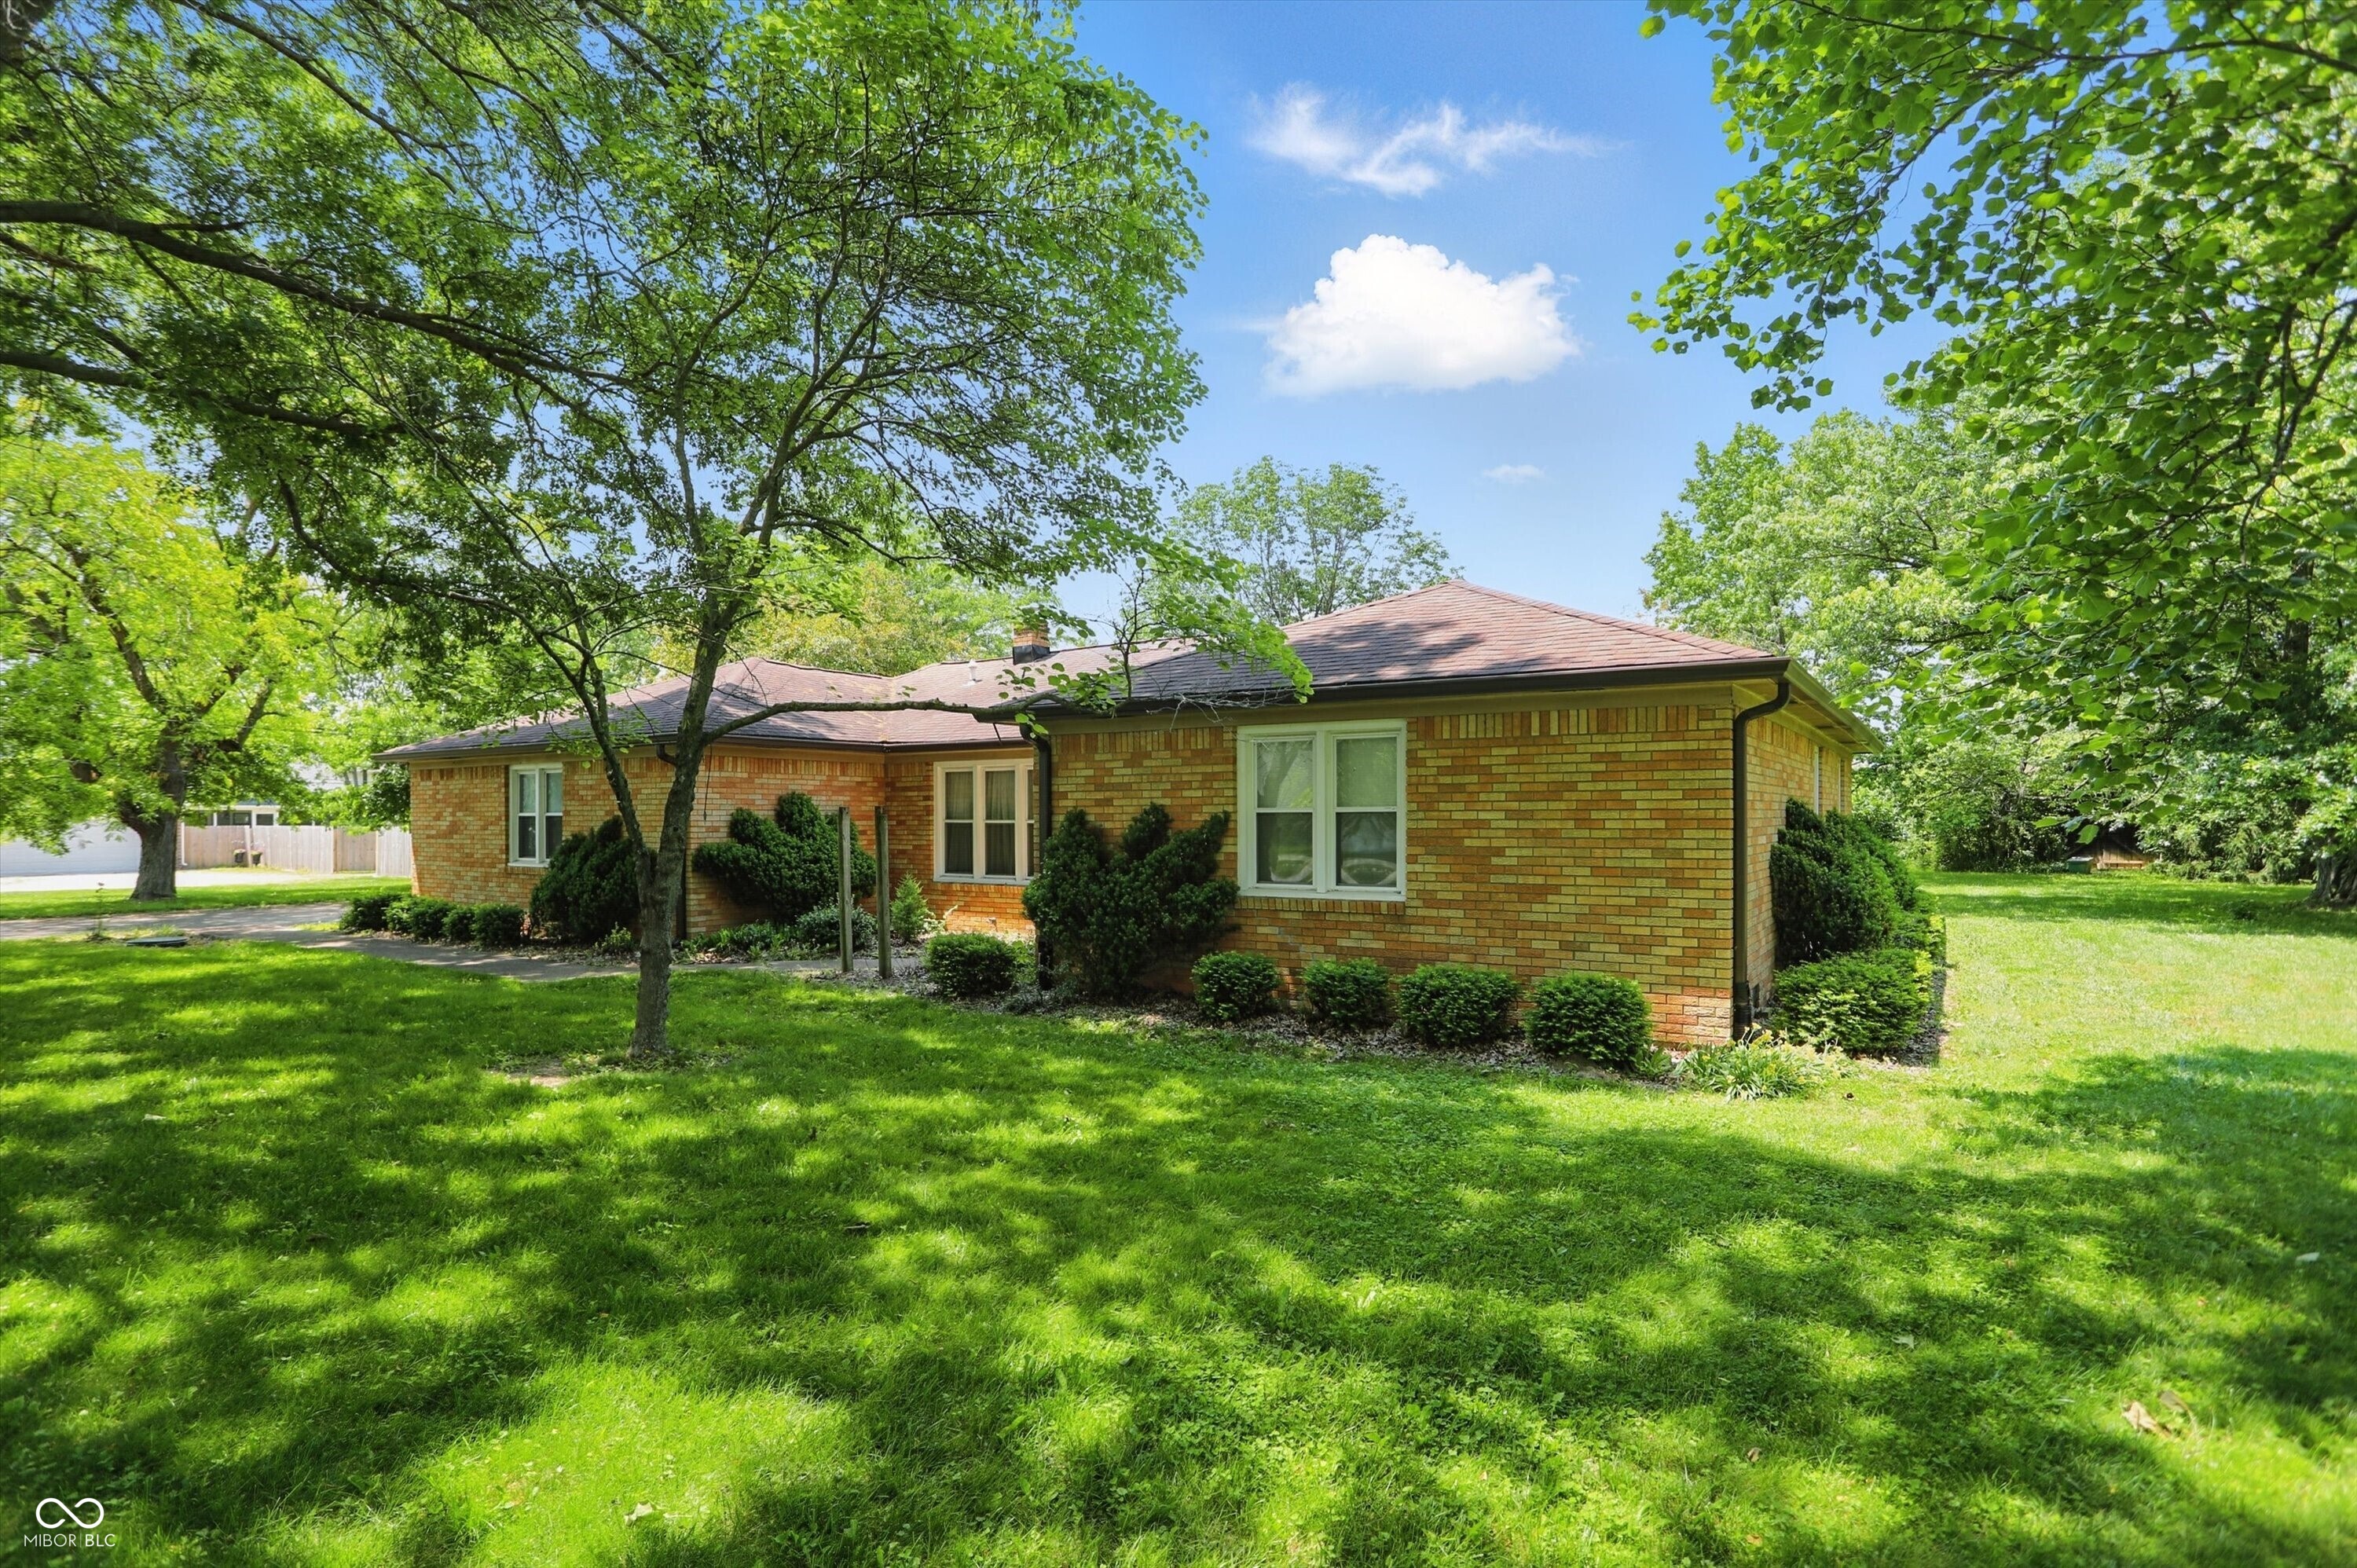
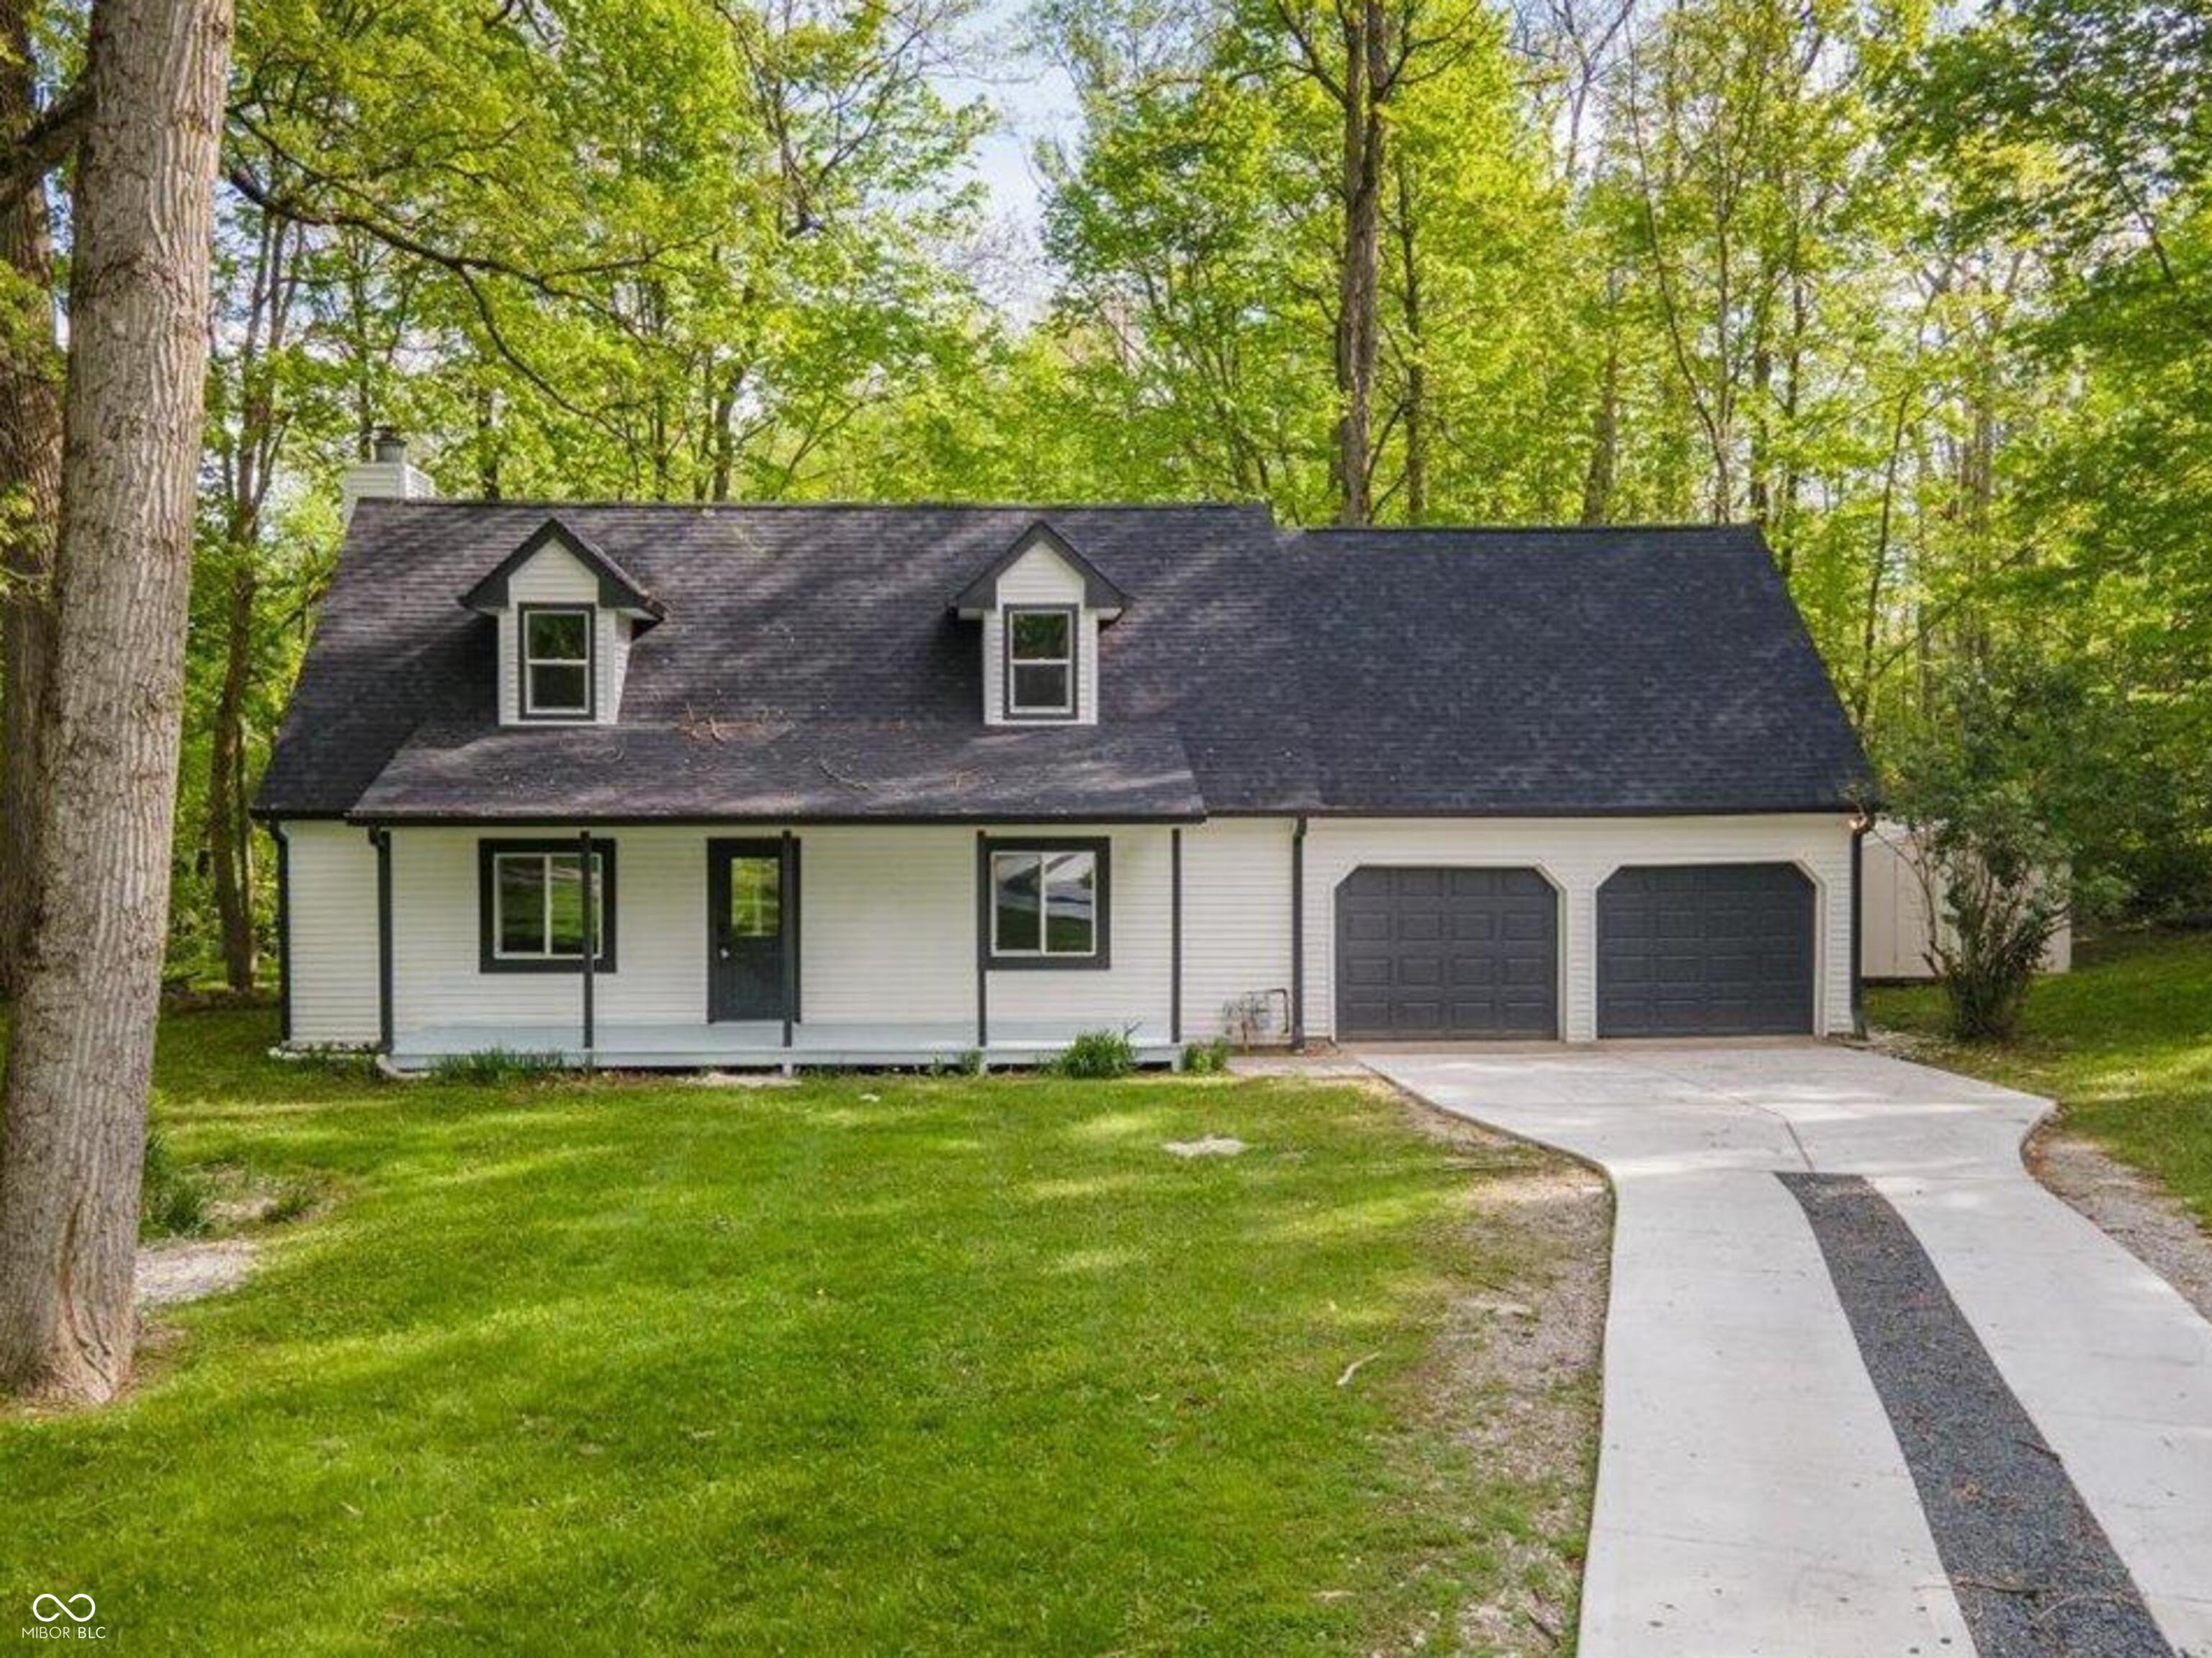
4270 Victoria Ln, Avon, IN 46123
$92
Cash flow
0.5%
Cash-on-Cash Return
6.3%
Cap rate
0.8%
Rent to Value Ratio
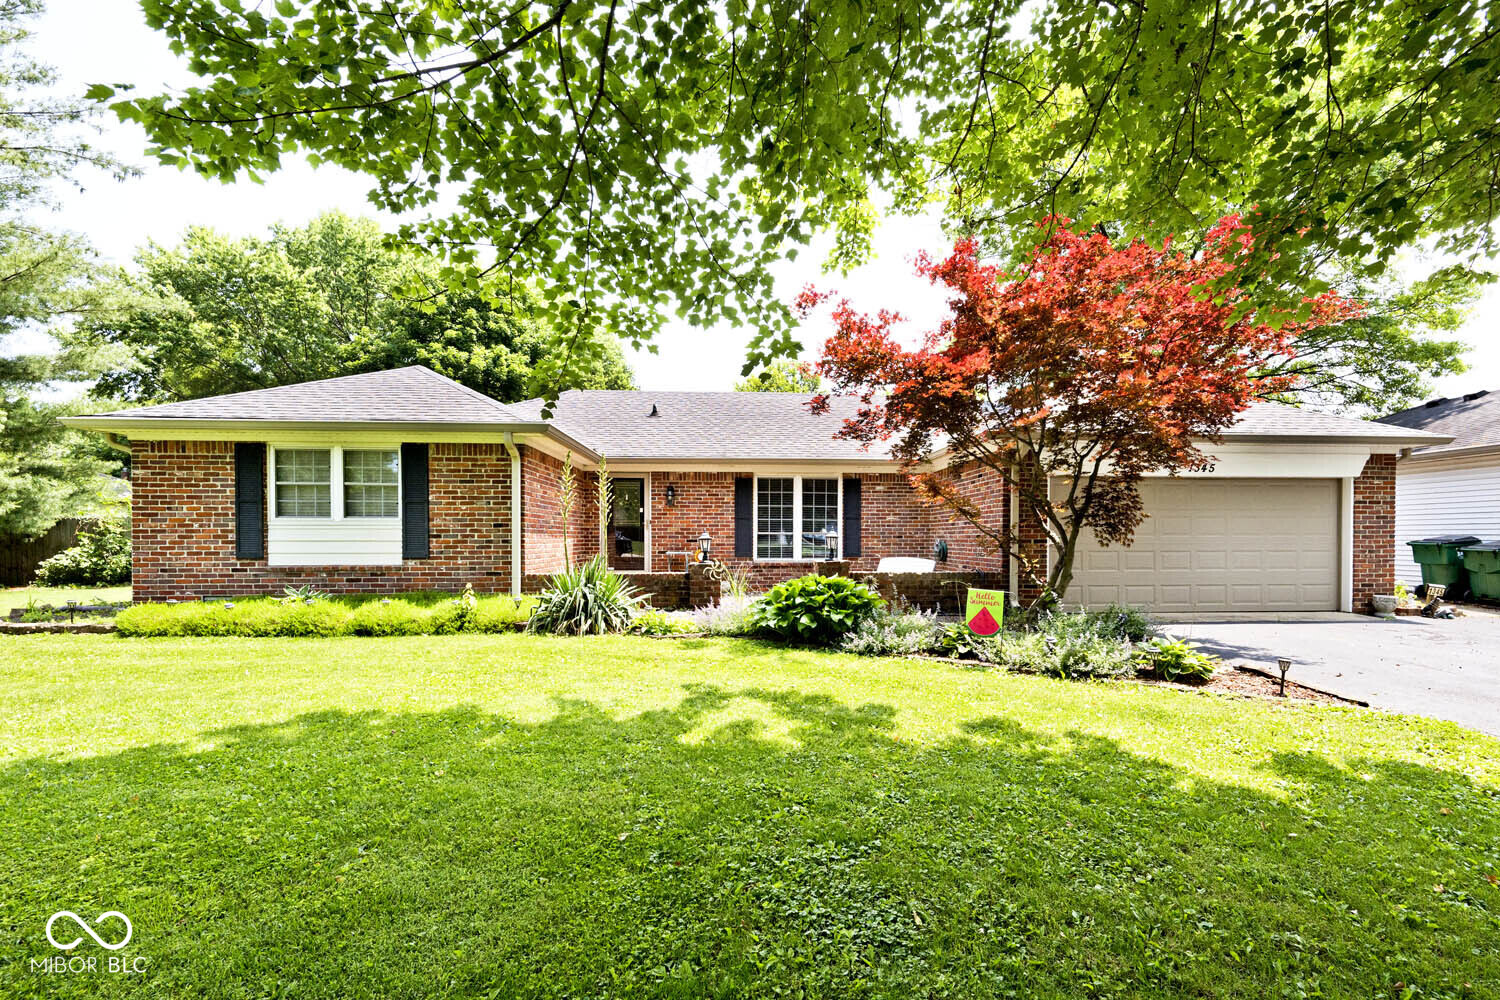
Active
$369,900
3
bds
|
3
ba
|
2,536
sqft
|
built
1996
1477 Macintosh Ct, Avon, IN 46123
$12
Cash flow
0.2%
Cash-on-Cash Return
6.2%
Cap rate
0.8%
Rent to Value Ratio
98 out of 107 properties for sale in Avon, IN
Limited Results Shown
Create a free account, or log in to reveal all property listings and enjoy the complete experience.
Active
$369,900
3
bds
|
3
ba
|
2,536
sqft
|
built
1996
1477 Macintosh Ct, Avon, IN 46123
$12
Cash flow
0.2%
Cash-on-Cash Return
6.2%
Cap rate
0.8%
Rent to Value Ratio
Active
$335,000
4
bds
|
3
ba
|
2,927
sqft
|
built
2004
8519 Frosty Rose Dr, Avon, IN 46123
$-27
Cash flow
-0.4%
Cash-on-Cash Return
6.1%
Cap rate
0.7%
Rent to Value Ratio
Active
$374,900
3
bds
|
3
ba
|
2,332
sqft
|
built
2010
8287 Falkirk Dr, Avon, IN 46123
$-614
Cash flow
-8.5%
Cash-on-Cash Return
4.2%
Cap rate
0.6%
Rent to Value Ratio
Active
$365,000
3
bds
|
2
ba
|
1,817
sqft
|
built
1989
378 Turnberry Ct, Avon, IN 46123
$-237
Cash flow
-3.4%
Cash-on-Cash Return
5.4%
Cap rate
0.7%
Rent to Value Ratio
Active
$499,900
3
bds
|
3
ba
|
3,763
sqft
|
built
1988
5298 Royal Troon Way, Avon, IN 46123
$-449
Cash flow
-4.7%
Cash-on-Cash Return
5.1%
Cap rate
0.6%
Rent to Value Ratio
Active
$899,900
7
bds
|
6
ba
|
7,671
sqft
|
built
1994
6013 Yellow Birch Ct, Avon, IN 46123
$-1,515
Cash flow
-8.8%
Cash-on-Cash Return
4.1%
Cap rate
0.5%
Rent to Value Ratio
Active
$295,000
3
bds
|
2
ba
|
1,400
sqft
|
built
1994
8391 Inland Dr, Avon, IN 46123
$-148
Cash flow
-2.6%
Cash-on-Cash Return
5.5%
Cap rate
0.7%
Rent to Value Ratio
Active
$364,900
4
bds
|
3
ba
|
2,158
sqft
|
built
1999
534 Austrian Way, Avon, IN 46123
$-161
Cash flow
-2.3%
Cash-on-Cash Return
5.6%
Cap rate
0.7%
Rent to Value Ratio
Active
$355,000
4
bds
|
3
ba
|
2,895
sqft
|
built
2015
1839 Silverton Dr, Avon, IN 46123
$-115
Cash flow
-1.7%
Cash-on-Cash Return
5.8%
Cap rate
0.7%
Rent to Value Ratio

Active
$349,900
4
bds
|
2
ba
|
1,863
sqft
|
built
1966
6805 E County Road 100 S, Avon, IN 46123
$-205
Cash flow
-3.1%
Cash-on-Cash Return
5.4%
Cap rate
0.7%
Rent to Value Ratio
Active
$409,500
3
bds
|
3
ba
|
2,517
sqft
|
built
1997
466 Sycamore Ridge Ct, Avon, IN 46123
$-170
Cash flow
-2.2%
Cash-on-Cash Return
5.6%
Cap rate
0.7%
Rent to Value Ratio
Active
$410,000
4
bds
|
4
ba
|
2,950
sqft
|
built
2003
938 Weeping Way Ln, Avon, IN 46123
$-600
Cash flow
-7.6%
Cash-on-Cash Return
4.4%
Cap rate
0.5%
Rent to Value Ratio
Active
$280,000
3
bds
|
3
ba
|
1,846
sqft
|
built
2022
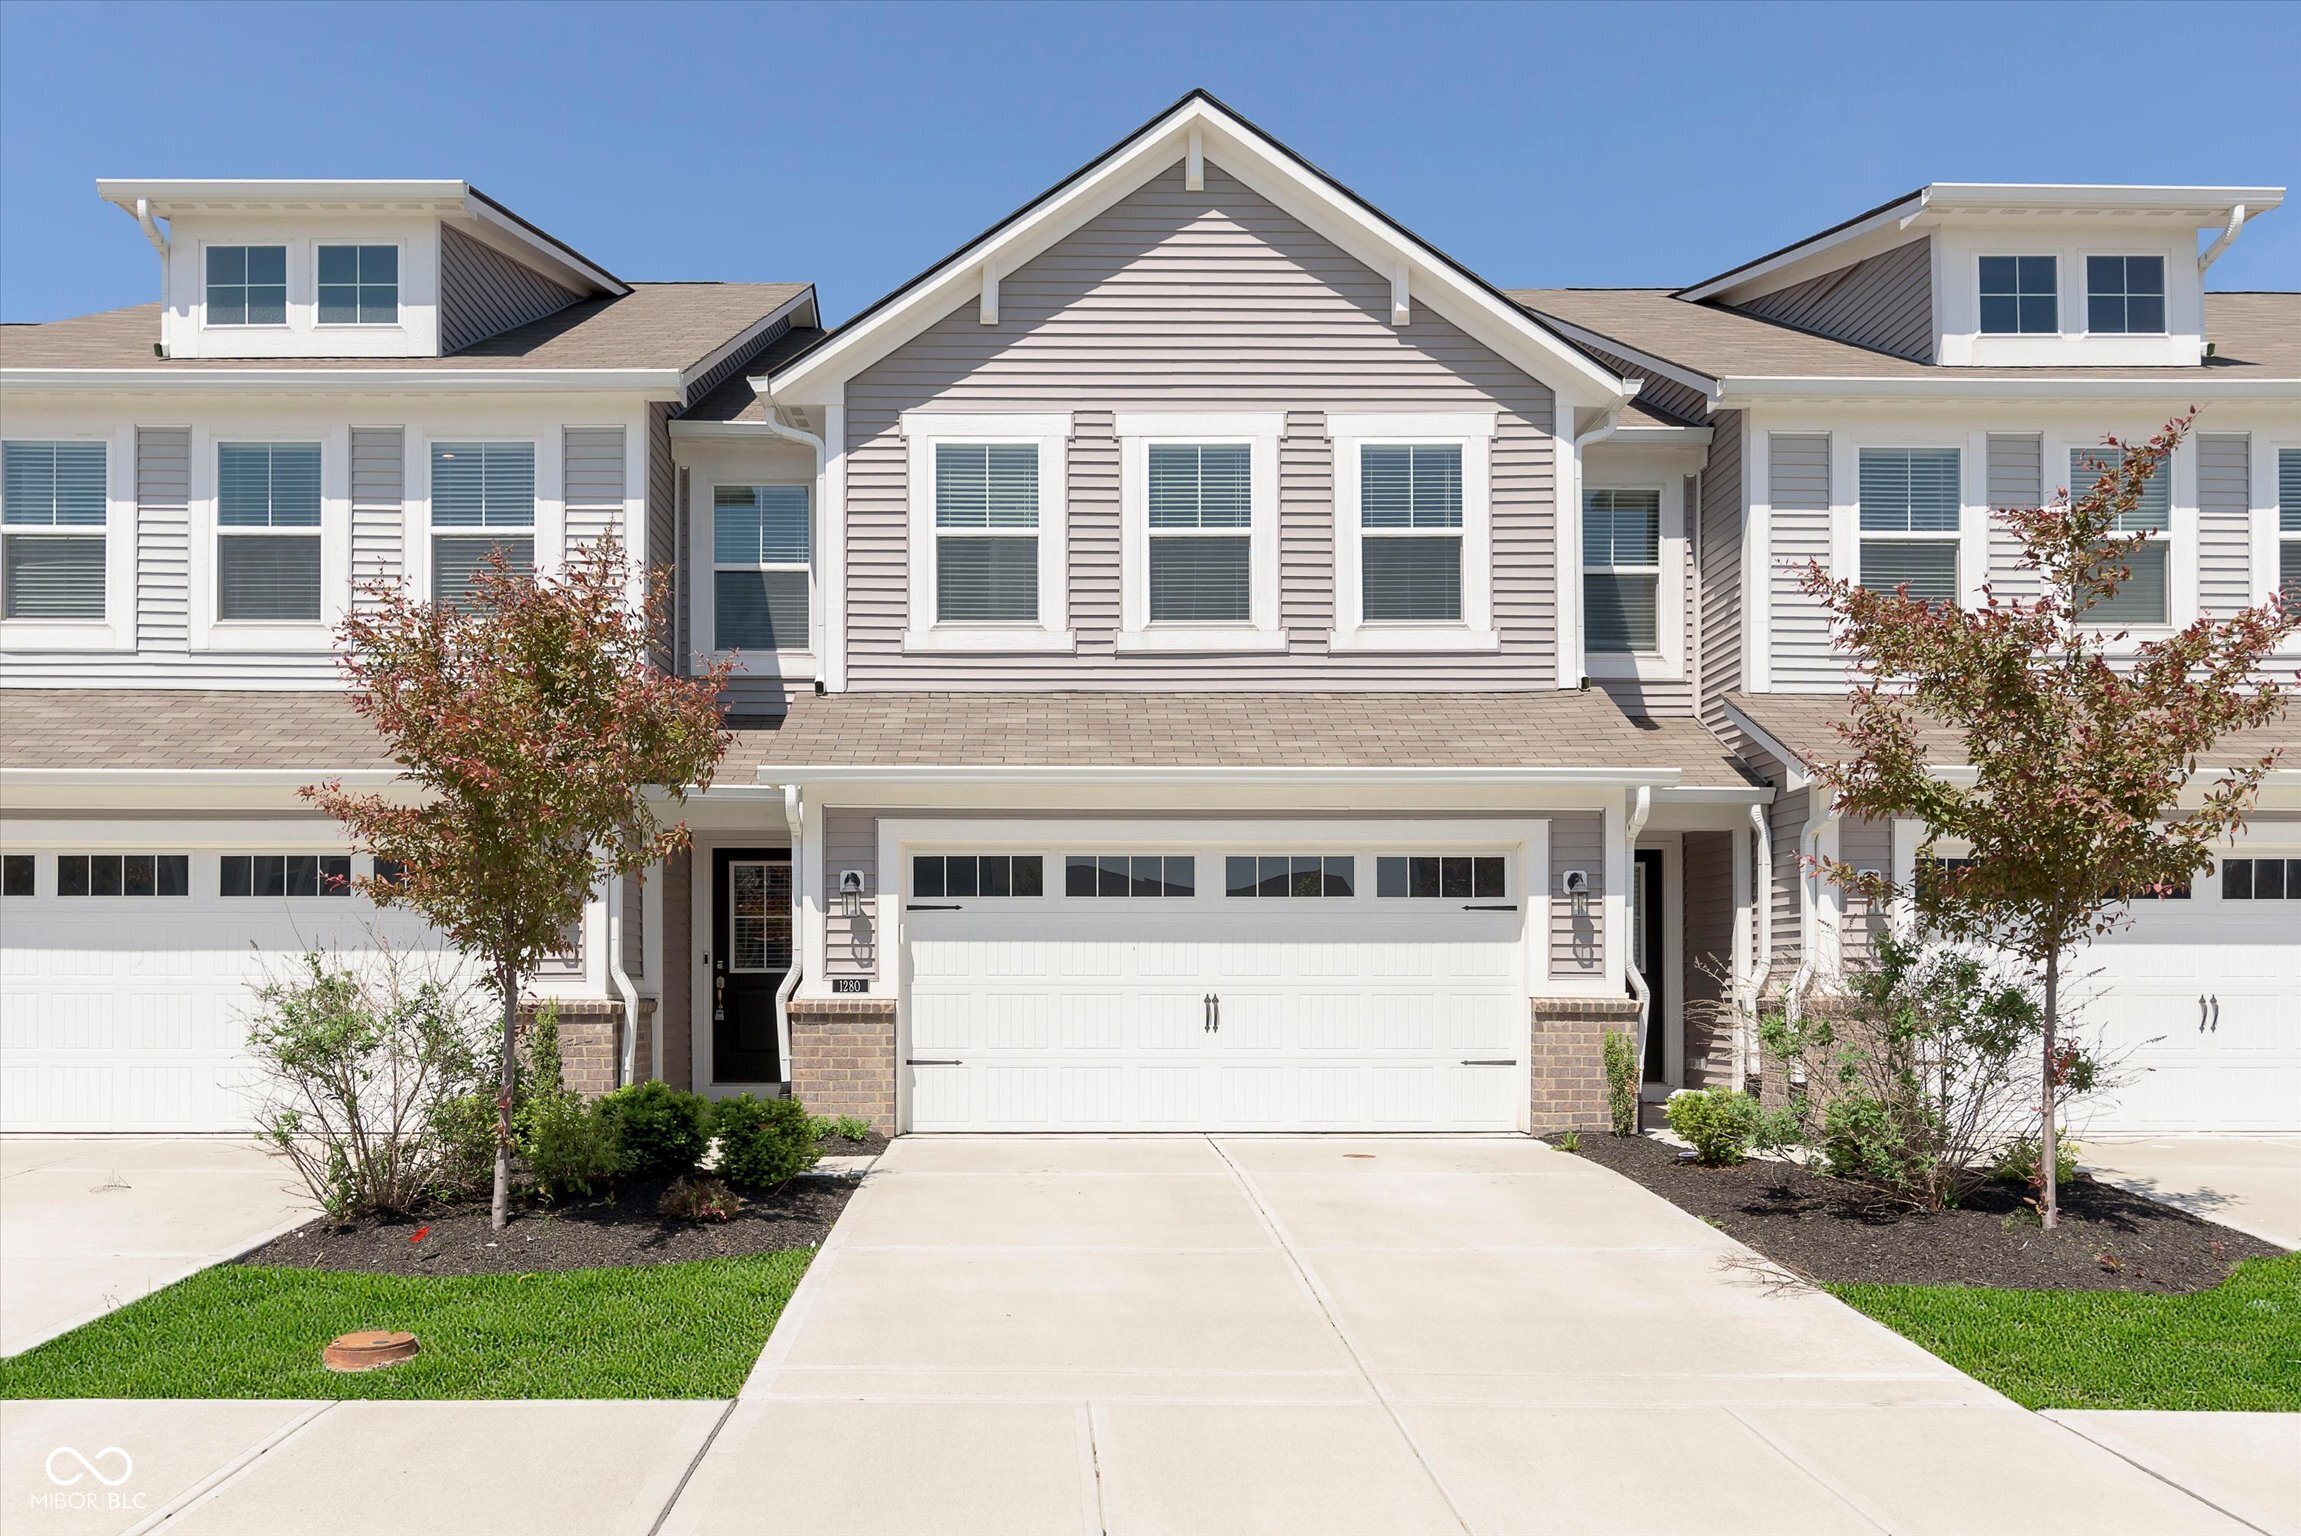
1280 Newton St, Avon, IN 46123
$-99
Cash flow
-1.8%
Cash-on-Cash Return
5.7%
Cap rate
0.8%
Rent to Value Ratio
Active
$345,000
3
bds
|
2
ba
|
1,913
sqft
|
built
2020
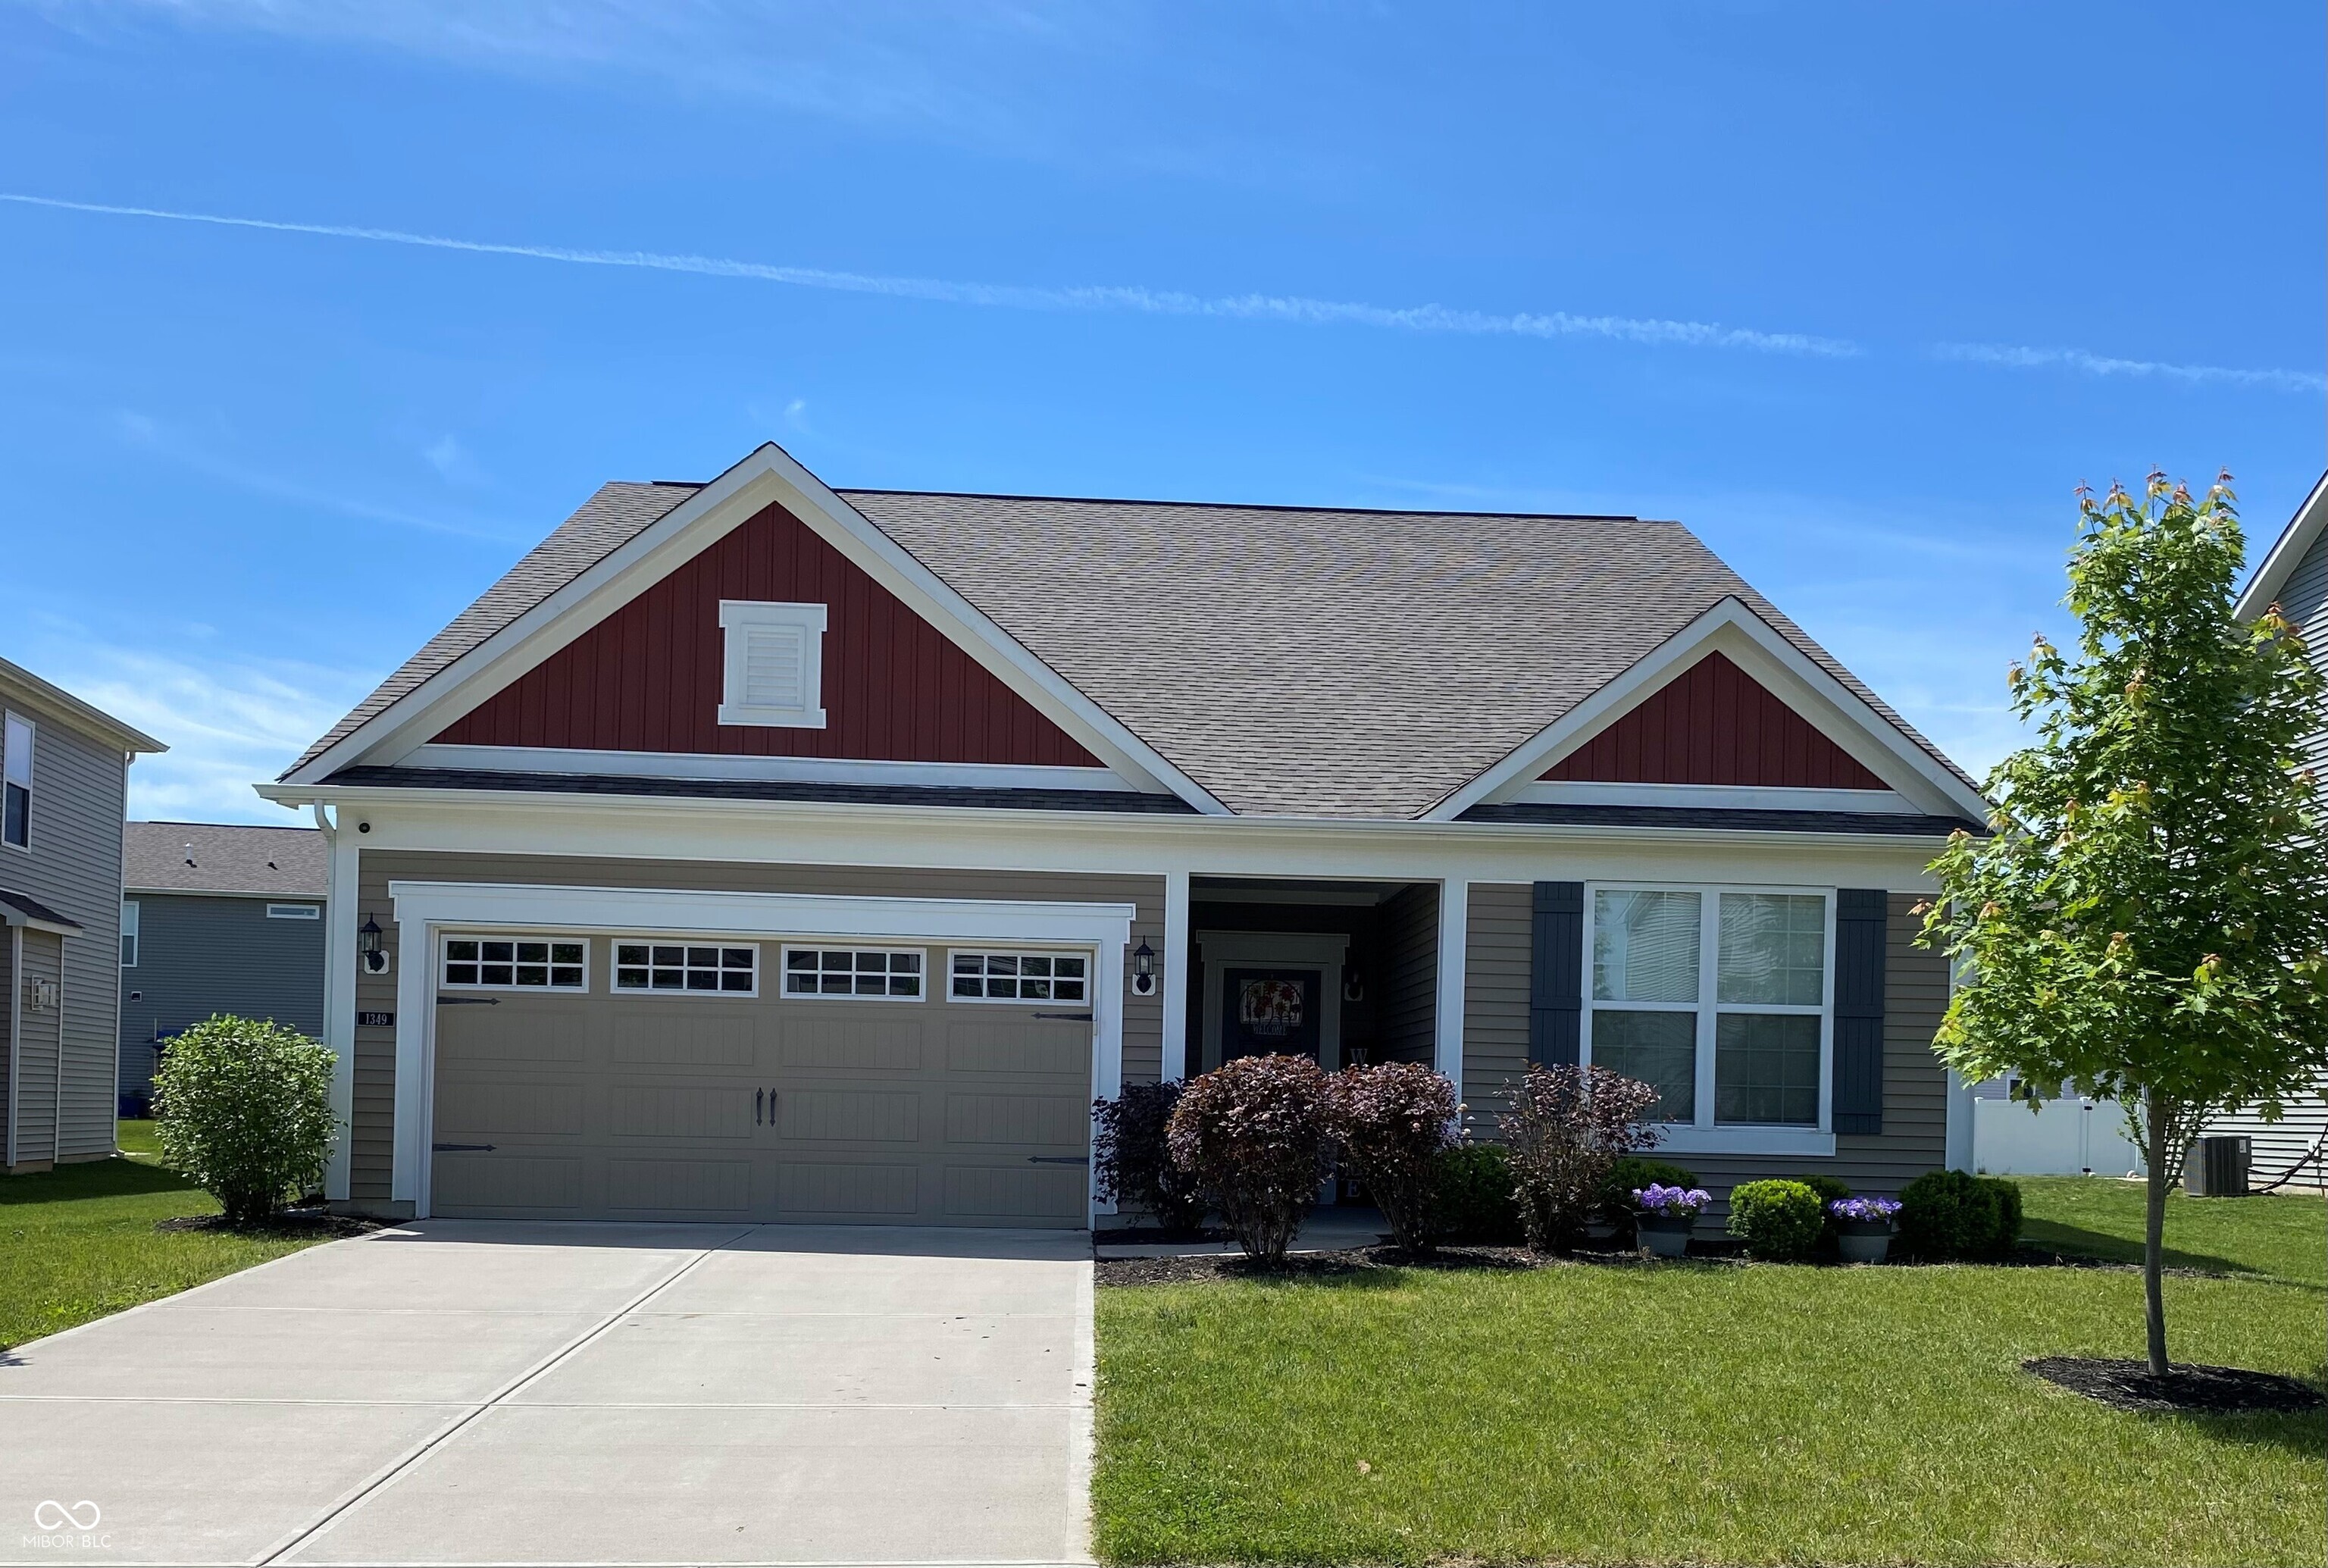
1349 Sunset Blvd, Avon, IN 46123
$-302
Cash flow
-4.6%
Cash-on-Cash Return
5.1%
Cap rate
0.6%
Rent to Value Ratio
Active
$449,900
3
bds
|
3
ba
|
2,732
sqft
|
built
1992
6983 White Oak Dr, Avon, IN 46123
$-584
Cash flow
-6.8%
Cash-on-Cash Return
4.6%
Cap rate
0.6%
Rent to Value Ratio
Active
$425,000
4
bds
|
3
ba
|
2,821
sqft
|
built
2013
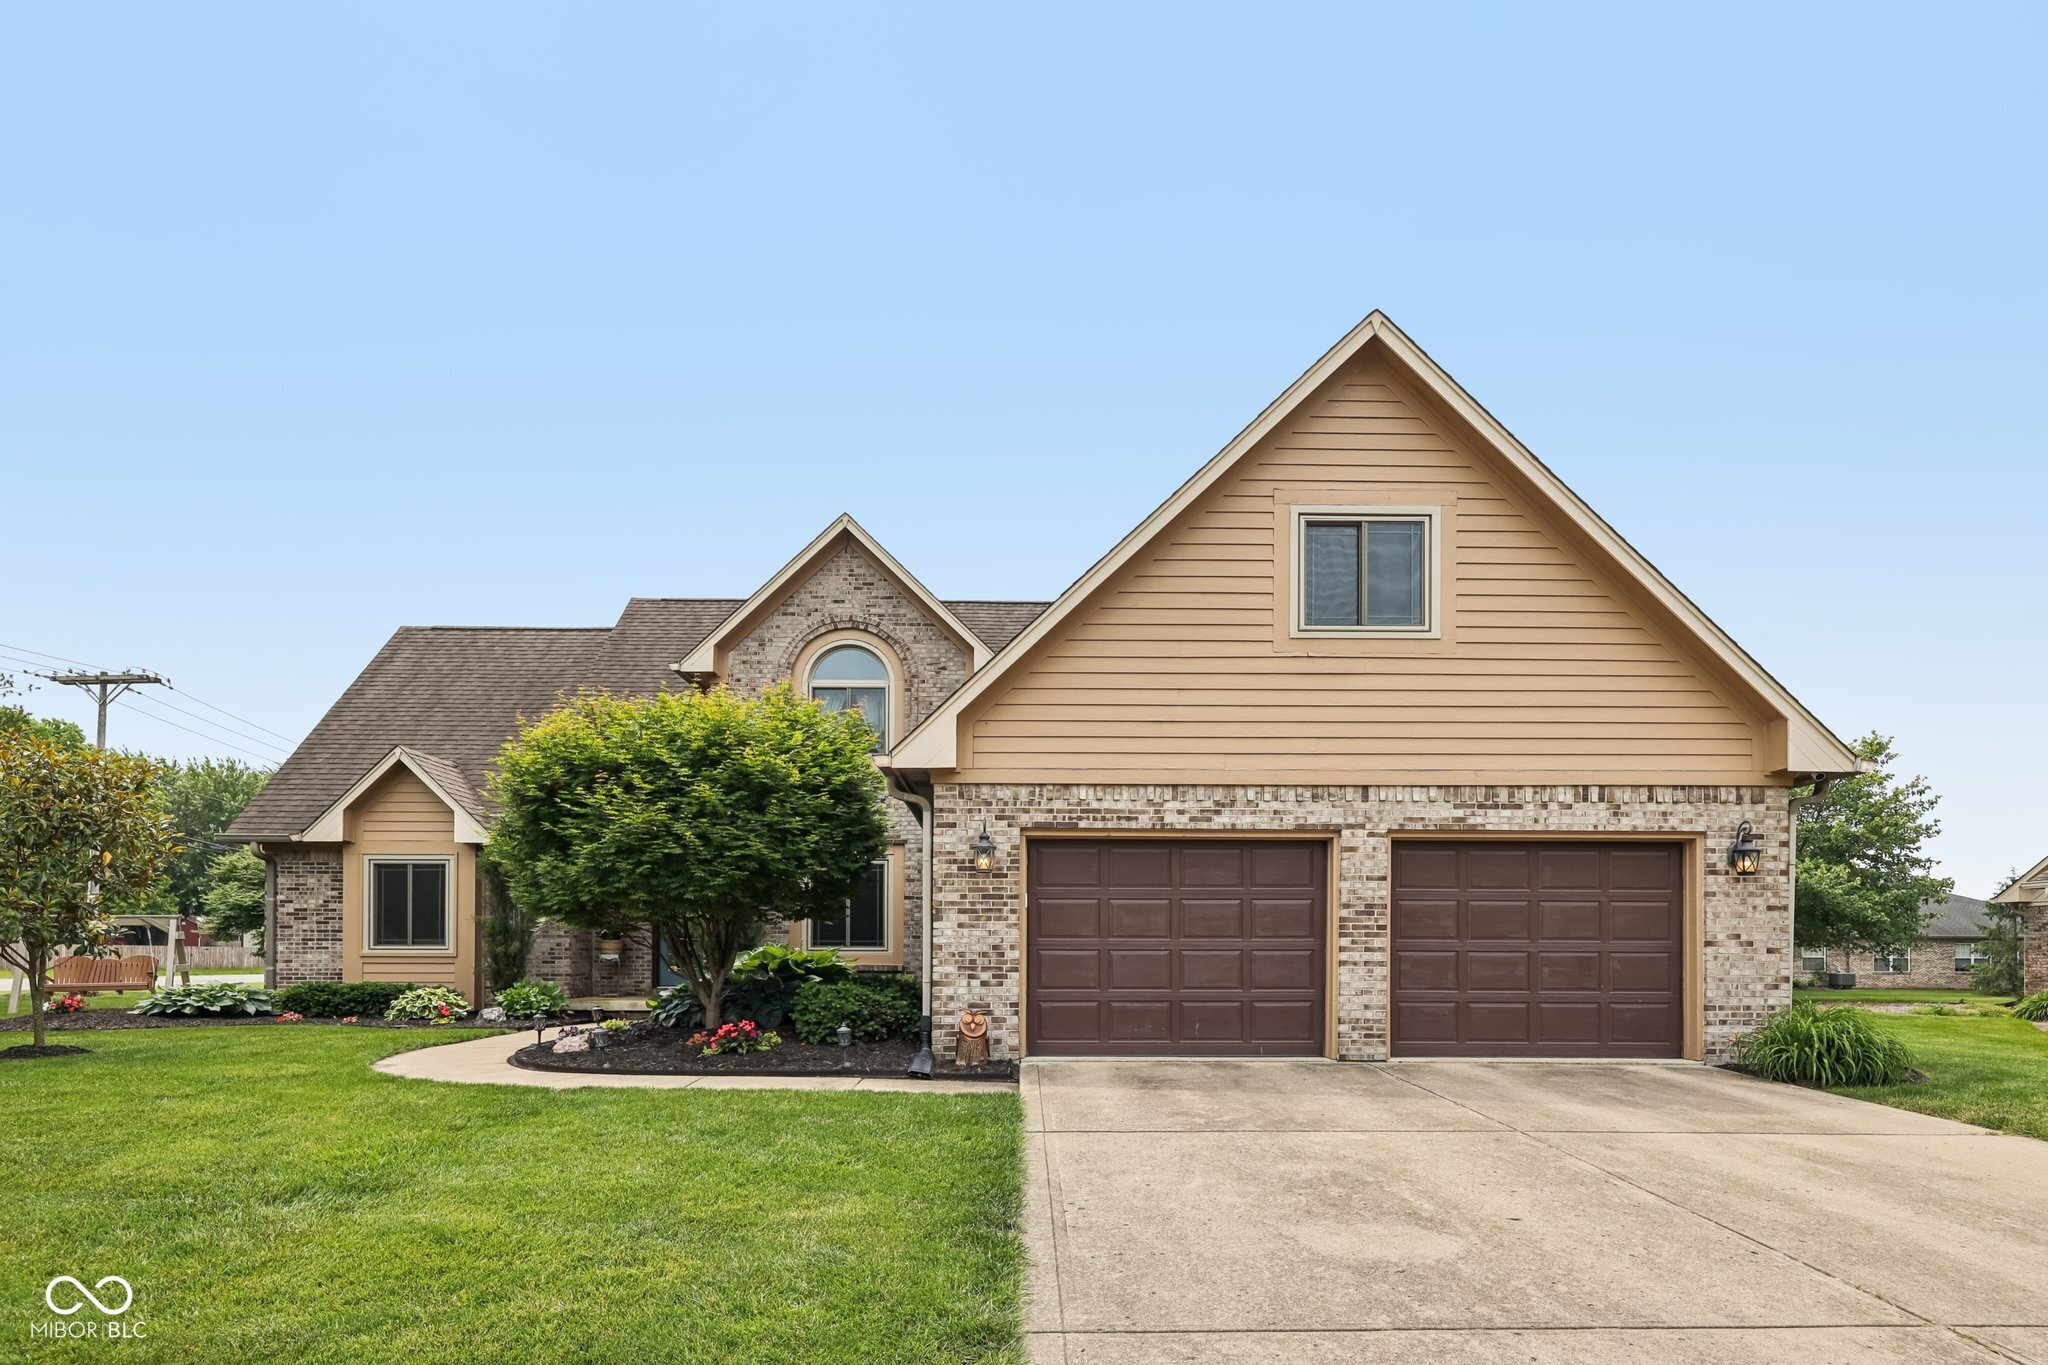
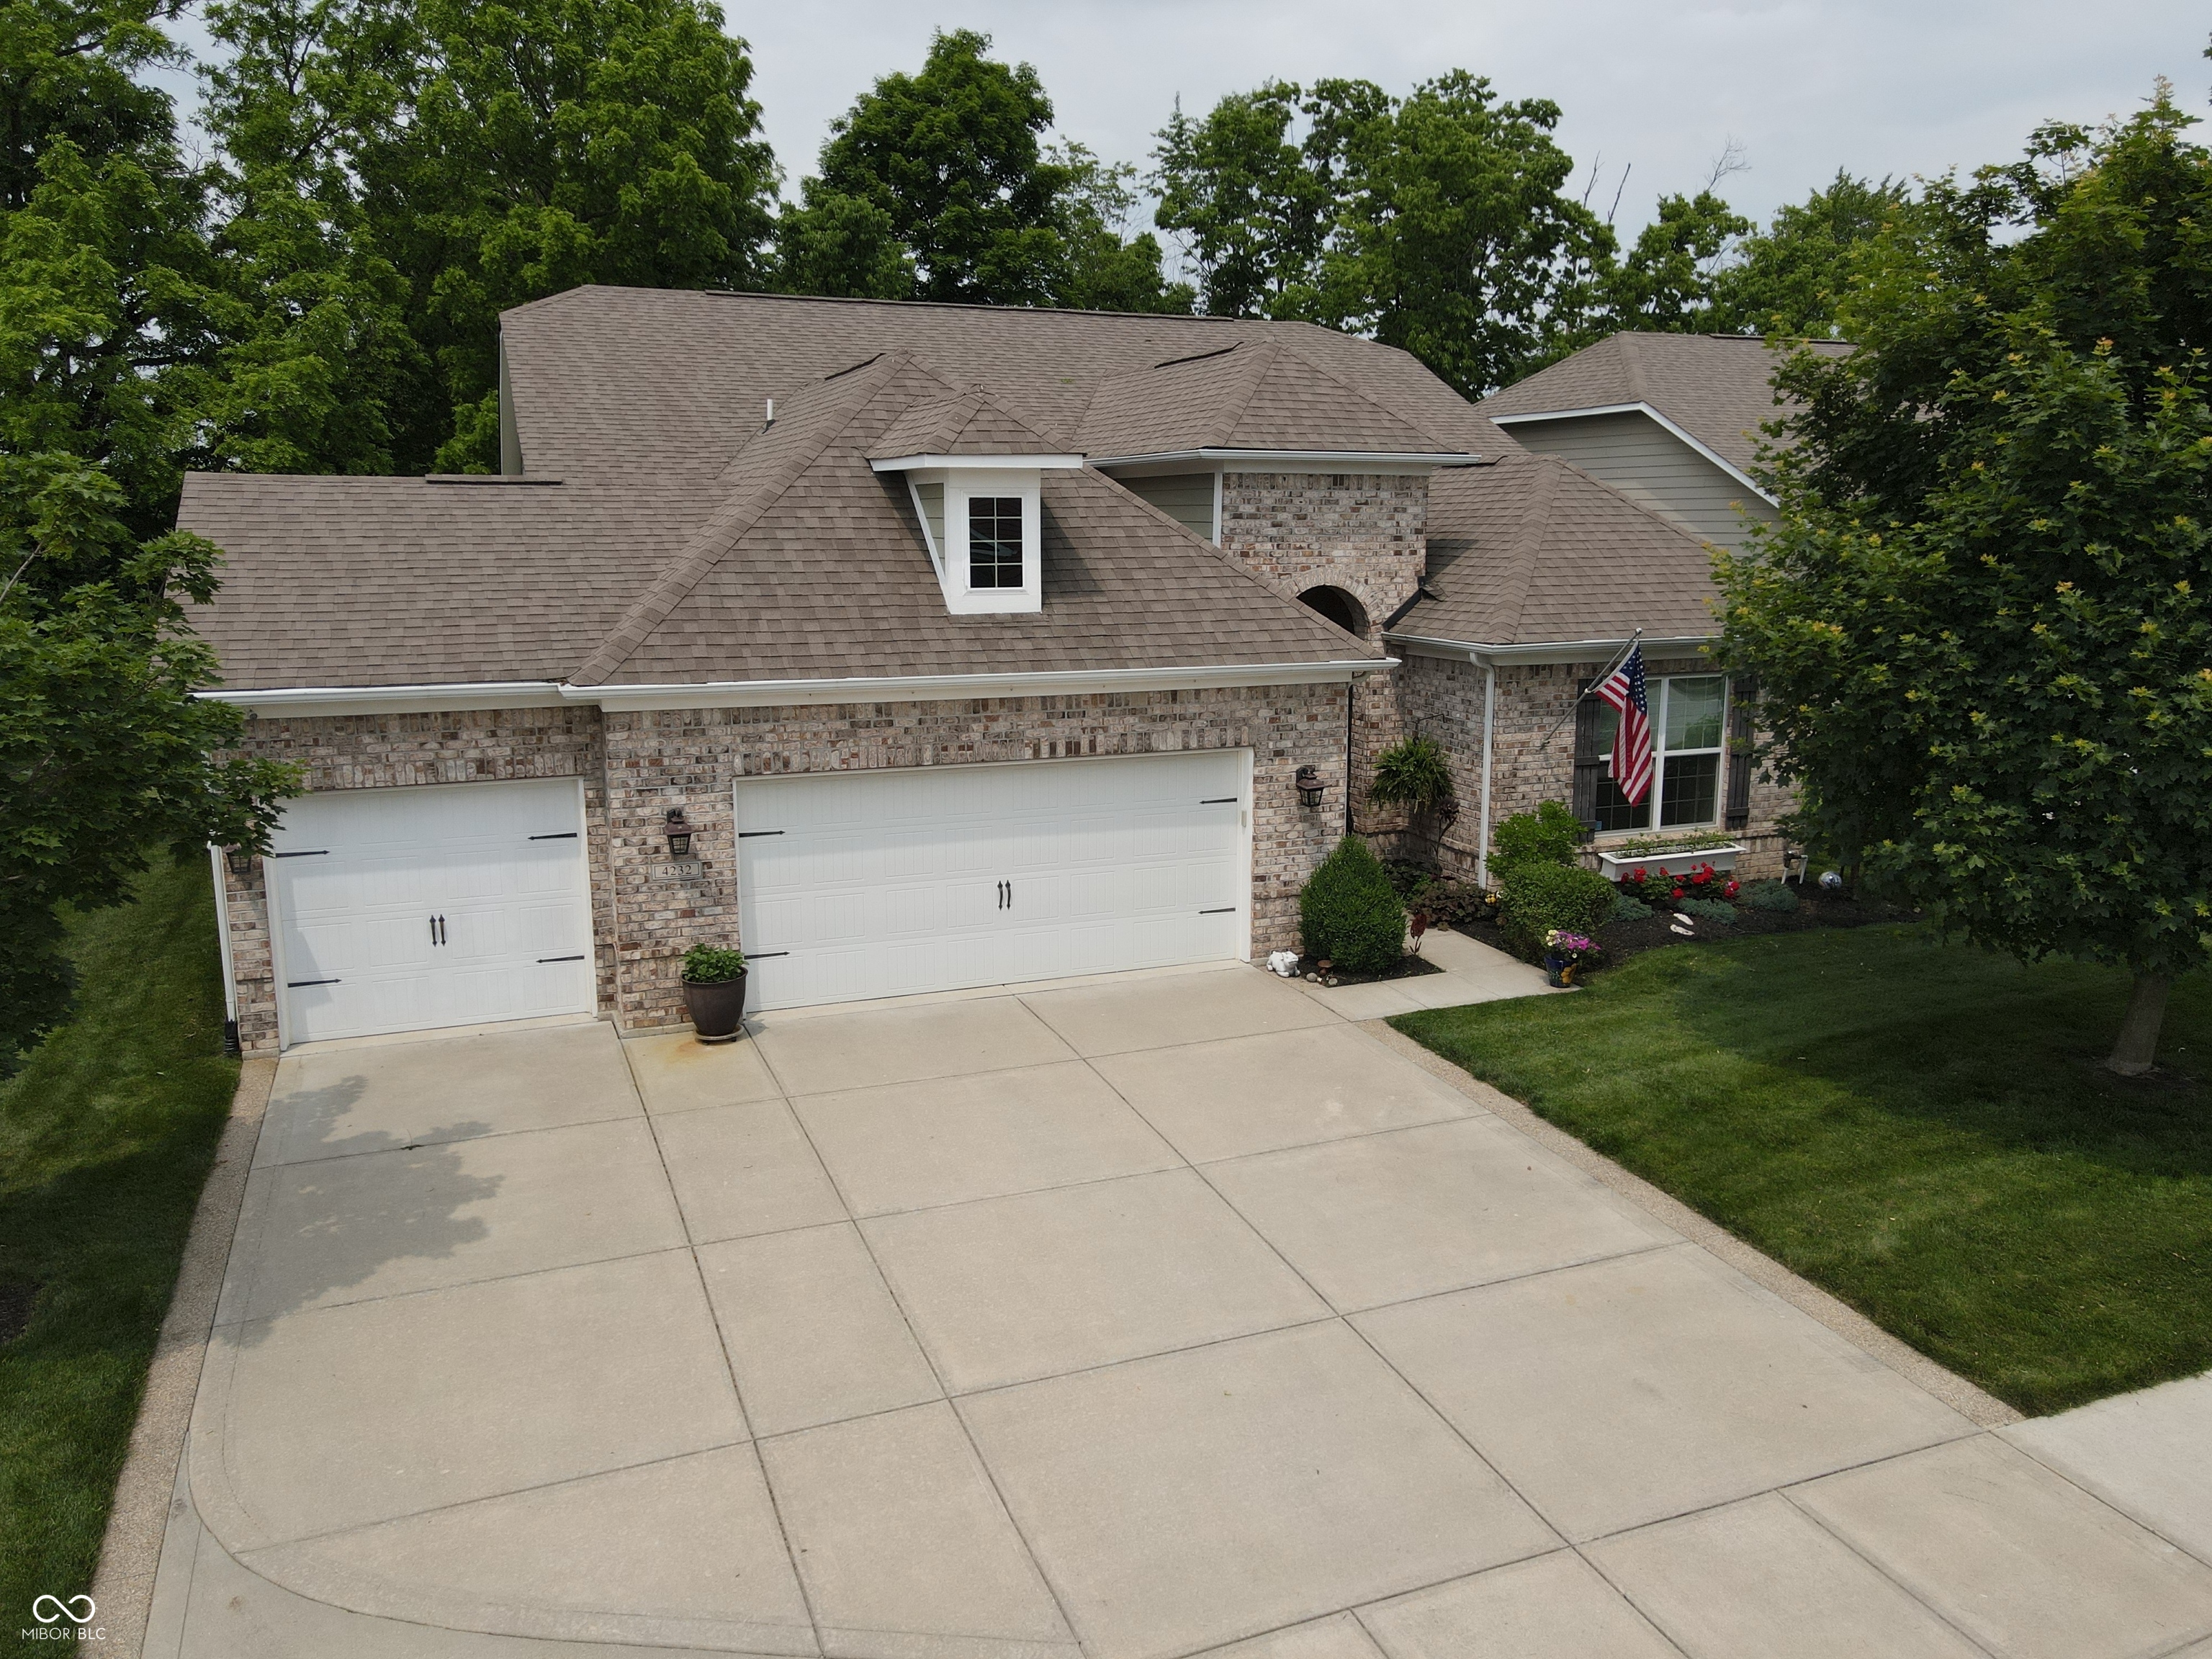
4232 Parliament Way, Avon, IN 46123
$-429
Cash flow
-5.3%
Cash-on-Cash Return
4.9%
Cap rate
0.6%
Rent to Value Ratio
Active
$599,000
3
bds
|
2
ba
|
1,698
sqft
|
built
1973
1914 S Avon Ave, Avon, IN 46123
$-1,688
Cash flow
-14.7%
Cash-on-Cash Return
2.8%
Cap rate
0.3%
Rent to Value Ratio
Active
$532,000
4
bds
|
5
ba
|
5,286
sqft
|
built
2016
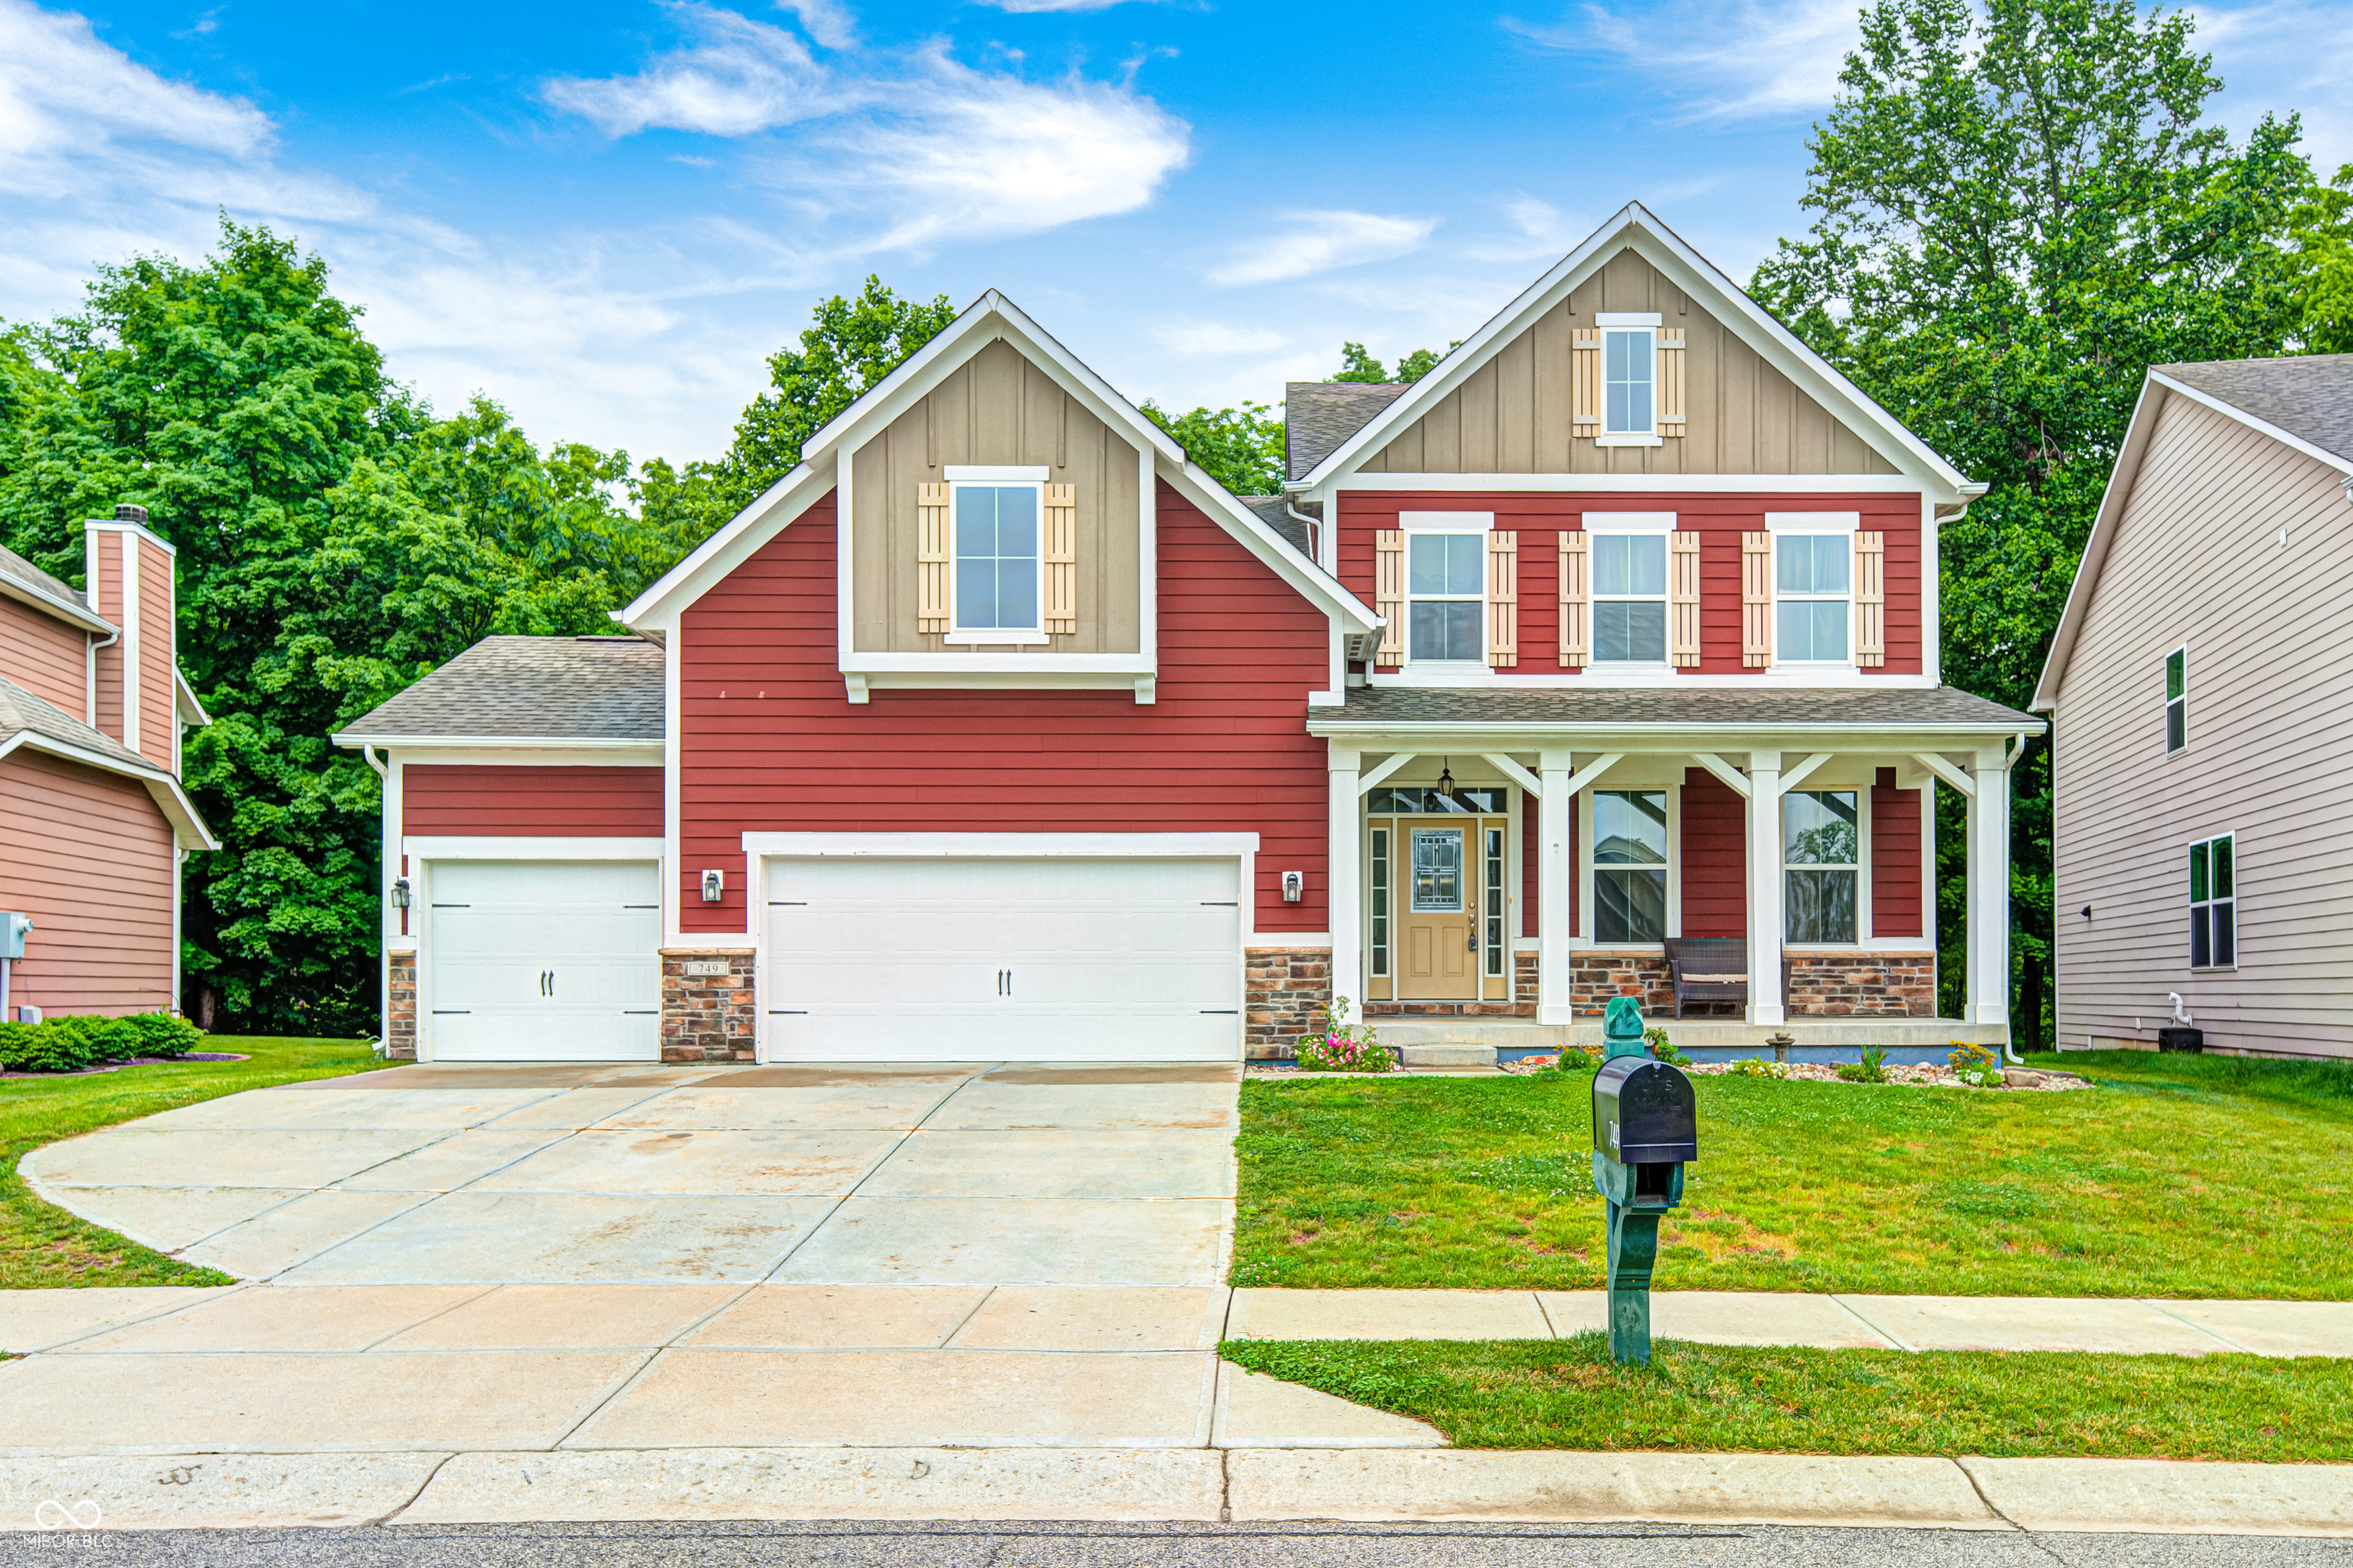
749 Bracknell Dr, Avon, IN 46123
$-766
Cash flow
-7.5%
Cash-on-Cash Return
4.4%
Cap rate
0.5%
Rent to Value Ratio
Active
$559,900
4
bds
|
3
ba
|
2,669
sqft
|
built
1992
1739 S County Road 450 E, Avon, IN 46123
$-936
Cash flow
-8.7%
Cash-on-Cash Return
4.1%
Cap rate
0.5%
Rent to Value Ratio
Pending
$270,000
3
bds
|
3
ba
|
1,765
sqft
|
built
2022
1274 Newton St, Avon, IN 46123
$-48
Cash flow
-0.9%
Cash-on-Cash Return
5.9%
Cap rate
0.8%
Rent to Value Ratio
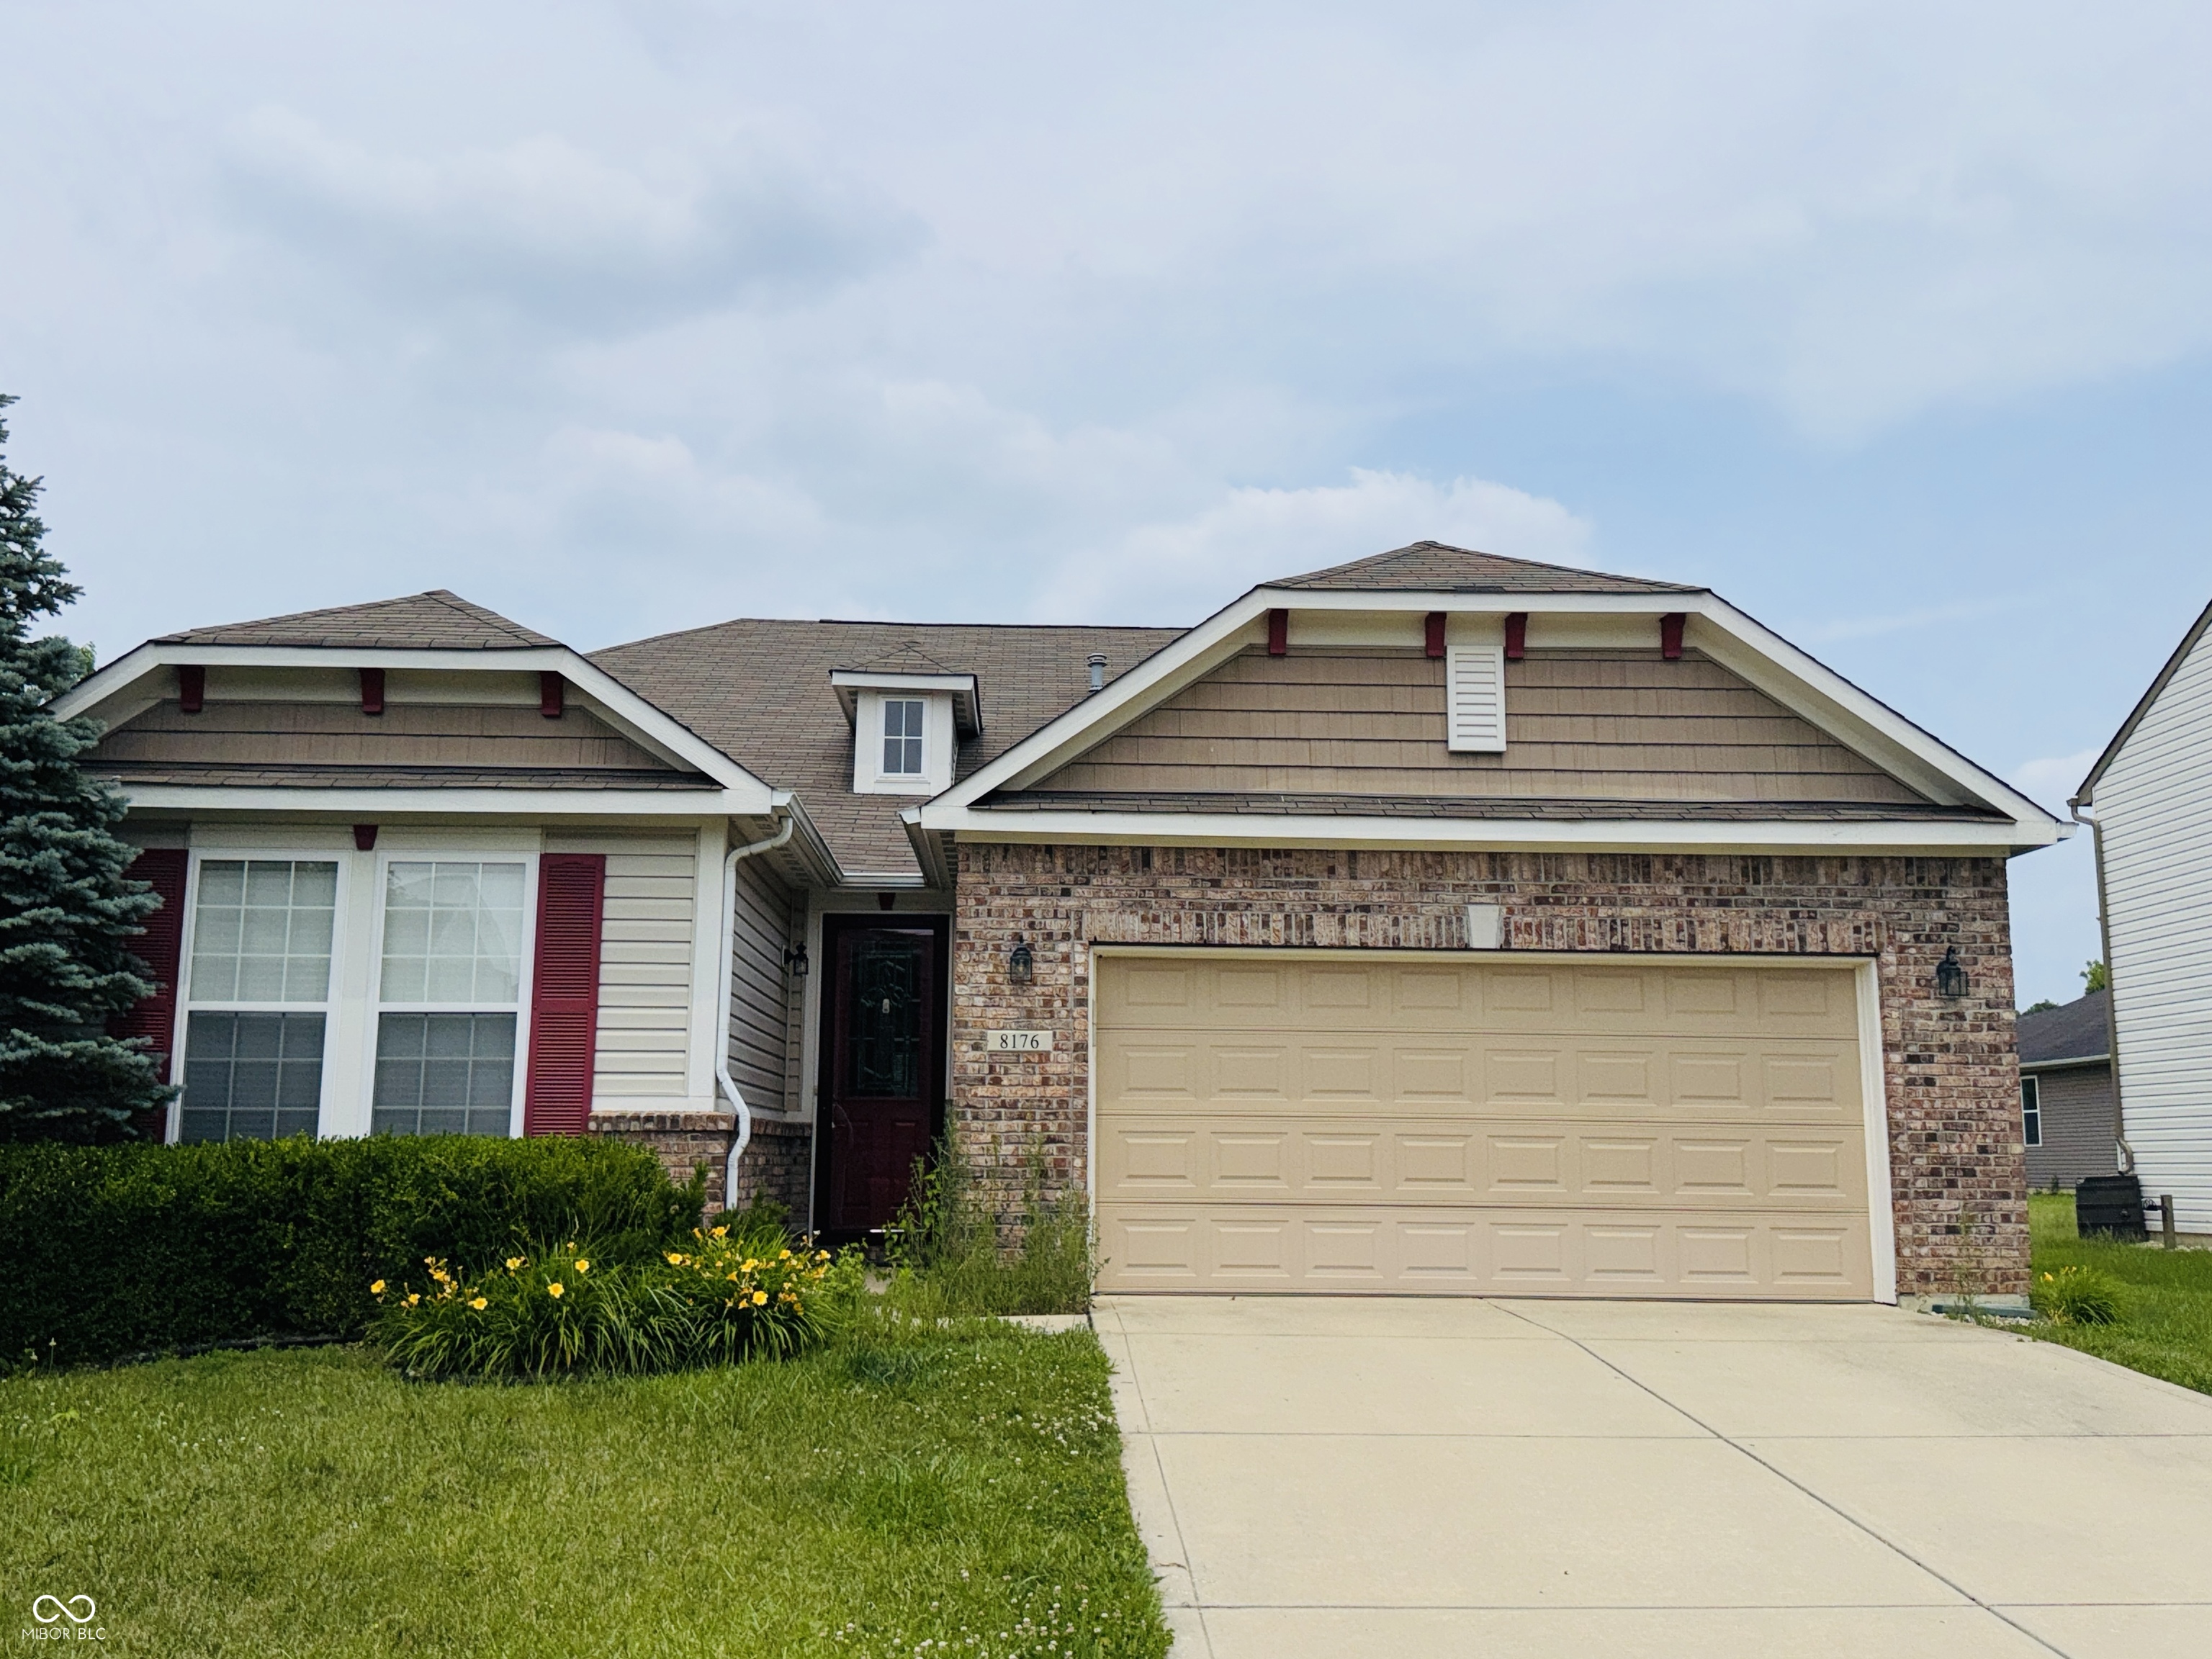
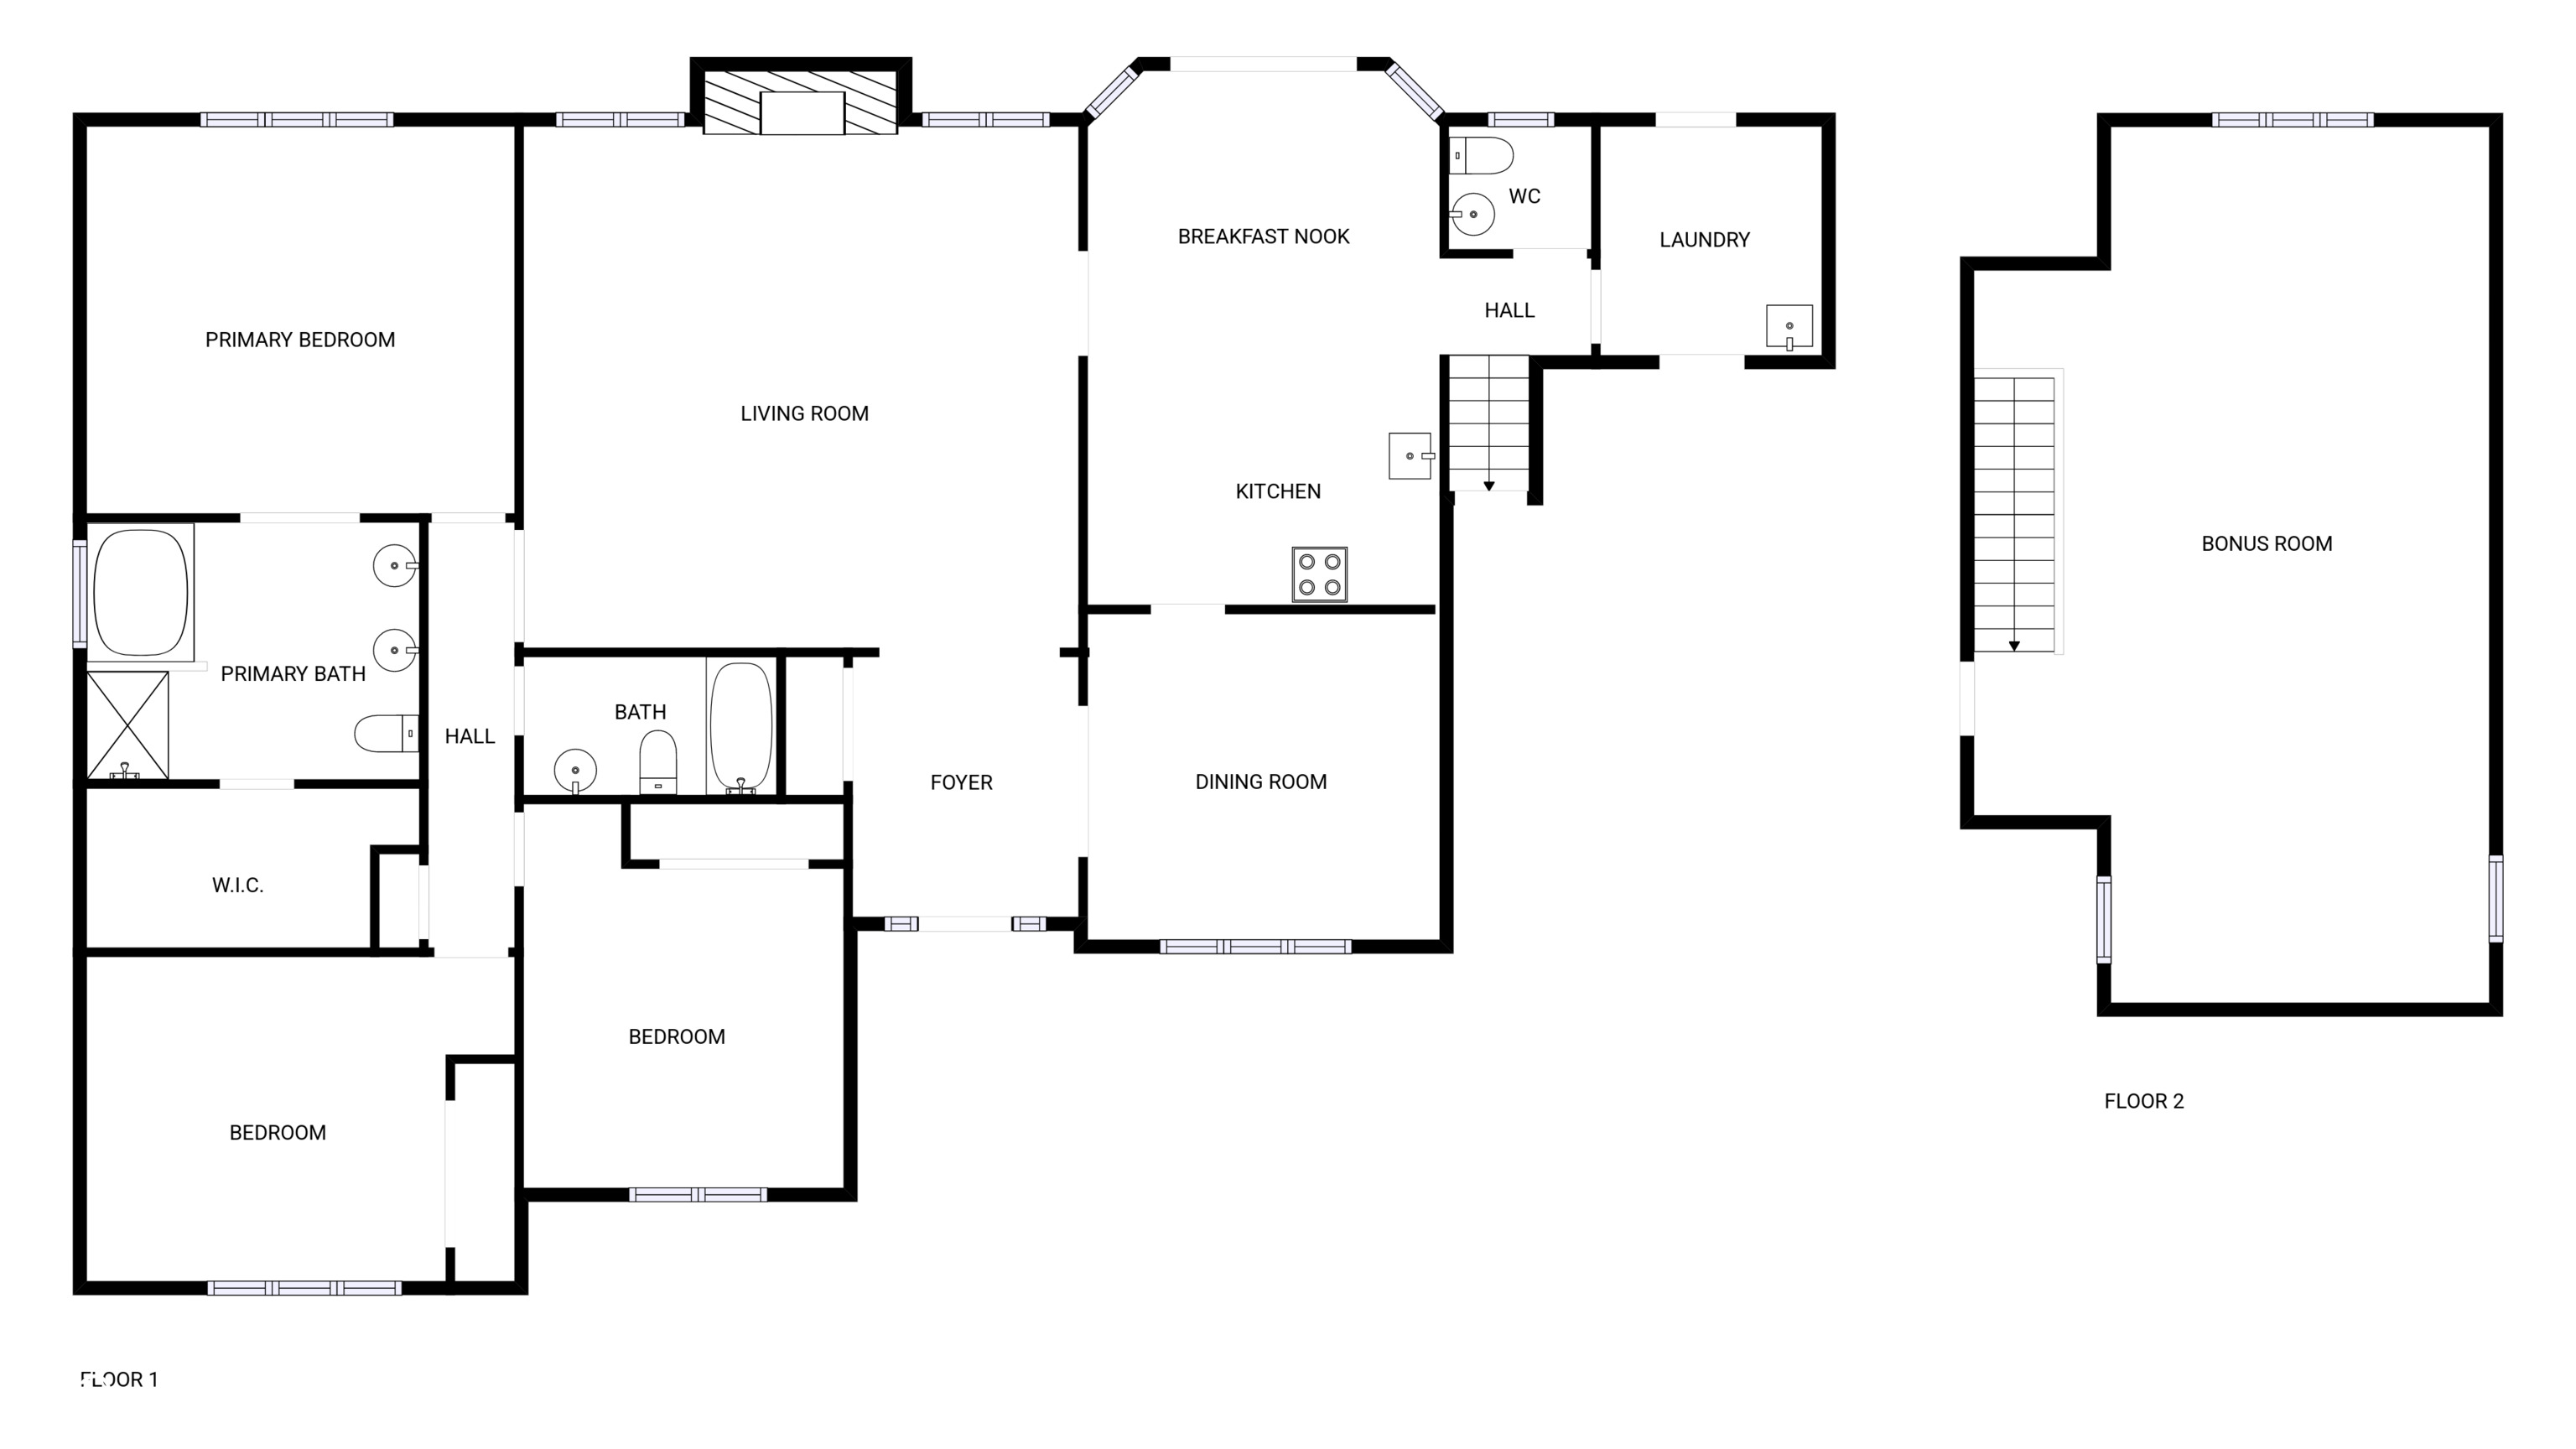
Active
$325,000
3
bds
|
2
ba
|
2,031
sqft
|
built
2007
8176 Crumwell Dr, Avon, IN 46123
$-176
Cash flow
-2.8%
Cash-on-Cash Return
5.5%
Cap rate
0.7%
Rent to Value Ratio
Active
$408,000
3
bds
|
3
ba
|
2,385
sqft
|
built
1995
6915 Juliet Dr, Avon, IN 46123
$-302
Cash flow
-3.9%
Cash-on-Cash Return
5.3%
Cap rate
0.6%
Rent to Value Ratio

Active
$749,000
6
bds
|
6
ba
|
5,566
sqft
|
built
2022
372 Foxboro Dr, Avon, IN 46123
$-88
Cash flow
-0.6%
Cash-on-Cash Return
6.0%
Cap rate
0.7%
Rent to Value Ratio
Active
$285,000
3
bds
|
3
ba
|
1,868
sqft
|
built
2022
1268 Newton St, Avon, IN 46123
$-125
Cash flow
-2.3%
Cash-on-Cash Return
5.6%
Cap rate
0.8%
Rent to Value Ratio

Active
$319,900
2
bds
|
2
ba
|
1,389
sqft
|
built
2021
745 Stone Trace Ct, Avon, IN 46123
$-384
Cash flow
-6.3%
Cash-on-Cash Return
4.7%
Cap rate
0.6%
Rent to Value Ratio
Active
$535,000
3
bds
|
4
ba
|
3,051
sqft
|
built
1999
5773 Station Hill Dr, Avon, IN 46123
$-558
Cash flow
-5.4%
Cash-on-Cash Return
4.9%
Cap rate
0.6%
Rent to Value Ratio
Active
$520,000
5
bds
|
4
ba
|
3,475
sqft
|
built
1997
1145 Forest Commons Dr, Avon, IN 46123
$-761
Cash flow
-7.6%
Cash-on-Cash Return
4.4%
Cap rate
0.5%
Rent to Value Ratio
Active
$355,900
3
bds
|
2
ba
|
1,517
sqft
|
built
1973
1345 Westwind Dr, Avon, IN 46123
$-443
Cash flow
-6.5%
Cash-on-Cash Return
4.7%
Cap rate
0.6%
Rent to Value Ratio
Active
$459,999
5
bds
|
4
ba
|
3,933
sqft
|
built
2008
7714 Black Walnut Dr, Avon, IN 46123
$-380
Cash flow
-4.3%
Cash-on-Cash Return
5.2%
Cap rate
0.6%
Rent to Value Ratio
Active
$925,000
5
bds
|
4
ba
|
4,952
sqft
|
built
1997
4270 Victoria Ln, Avon, IN 46123
$92
Cash flow
0.5%
Cash-on-Cash Return
6.3%
Cap rate
0.8%
Rent to Value Ratio
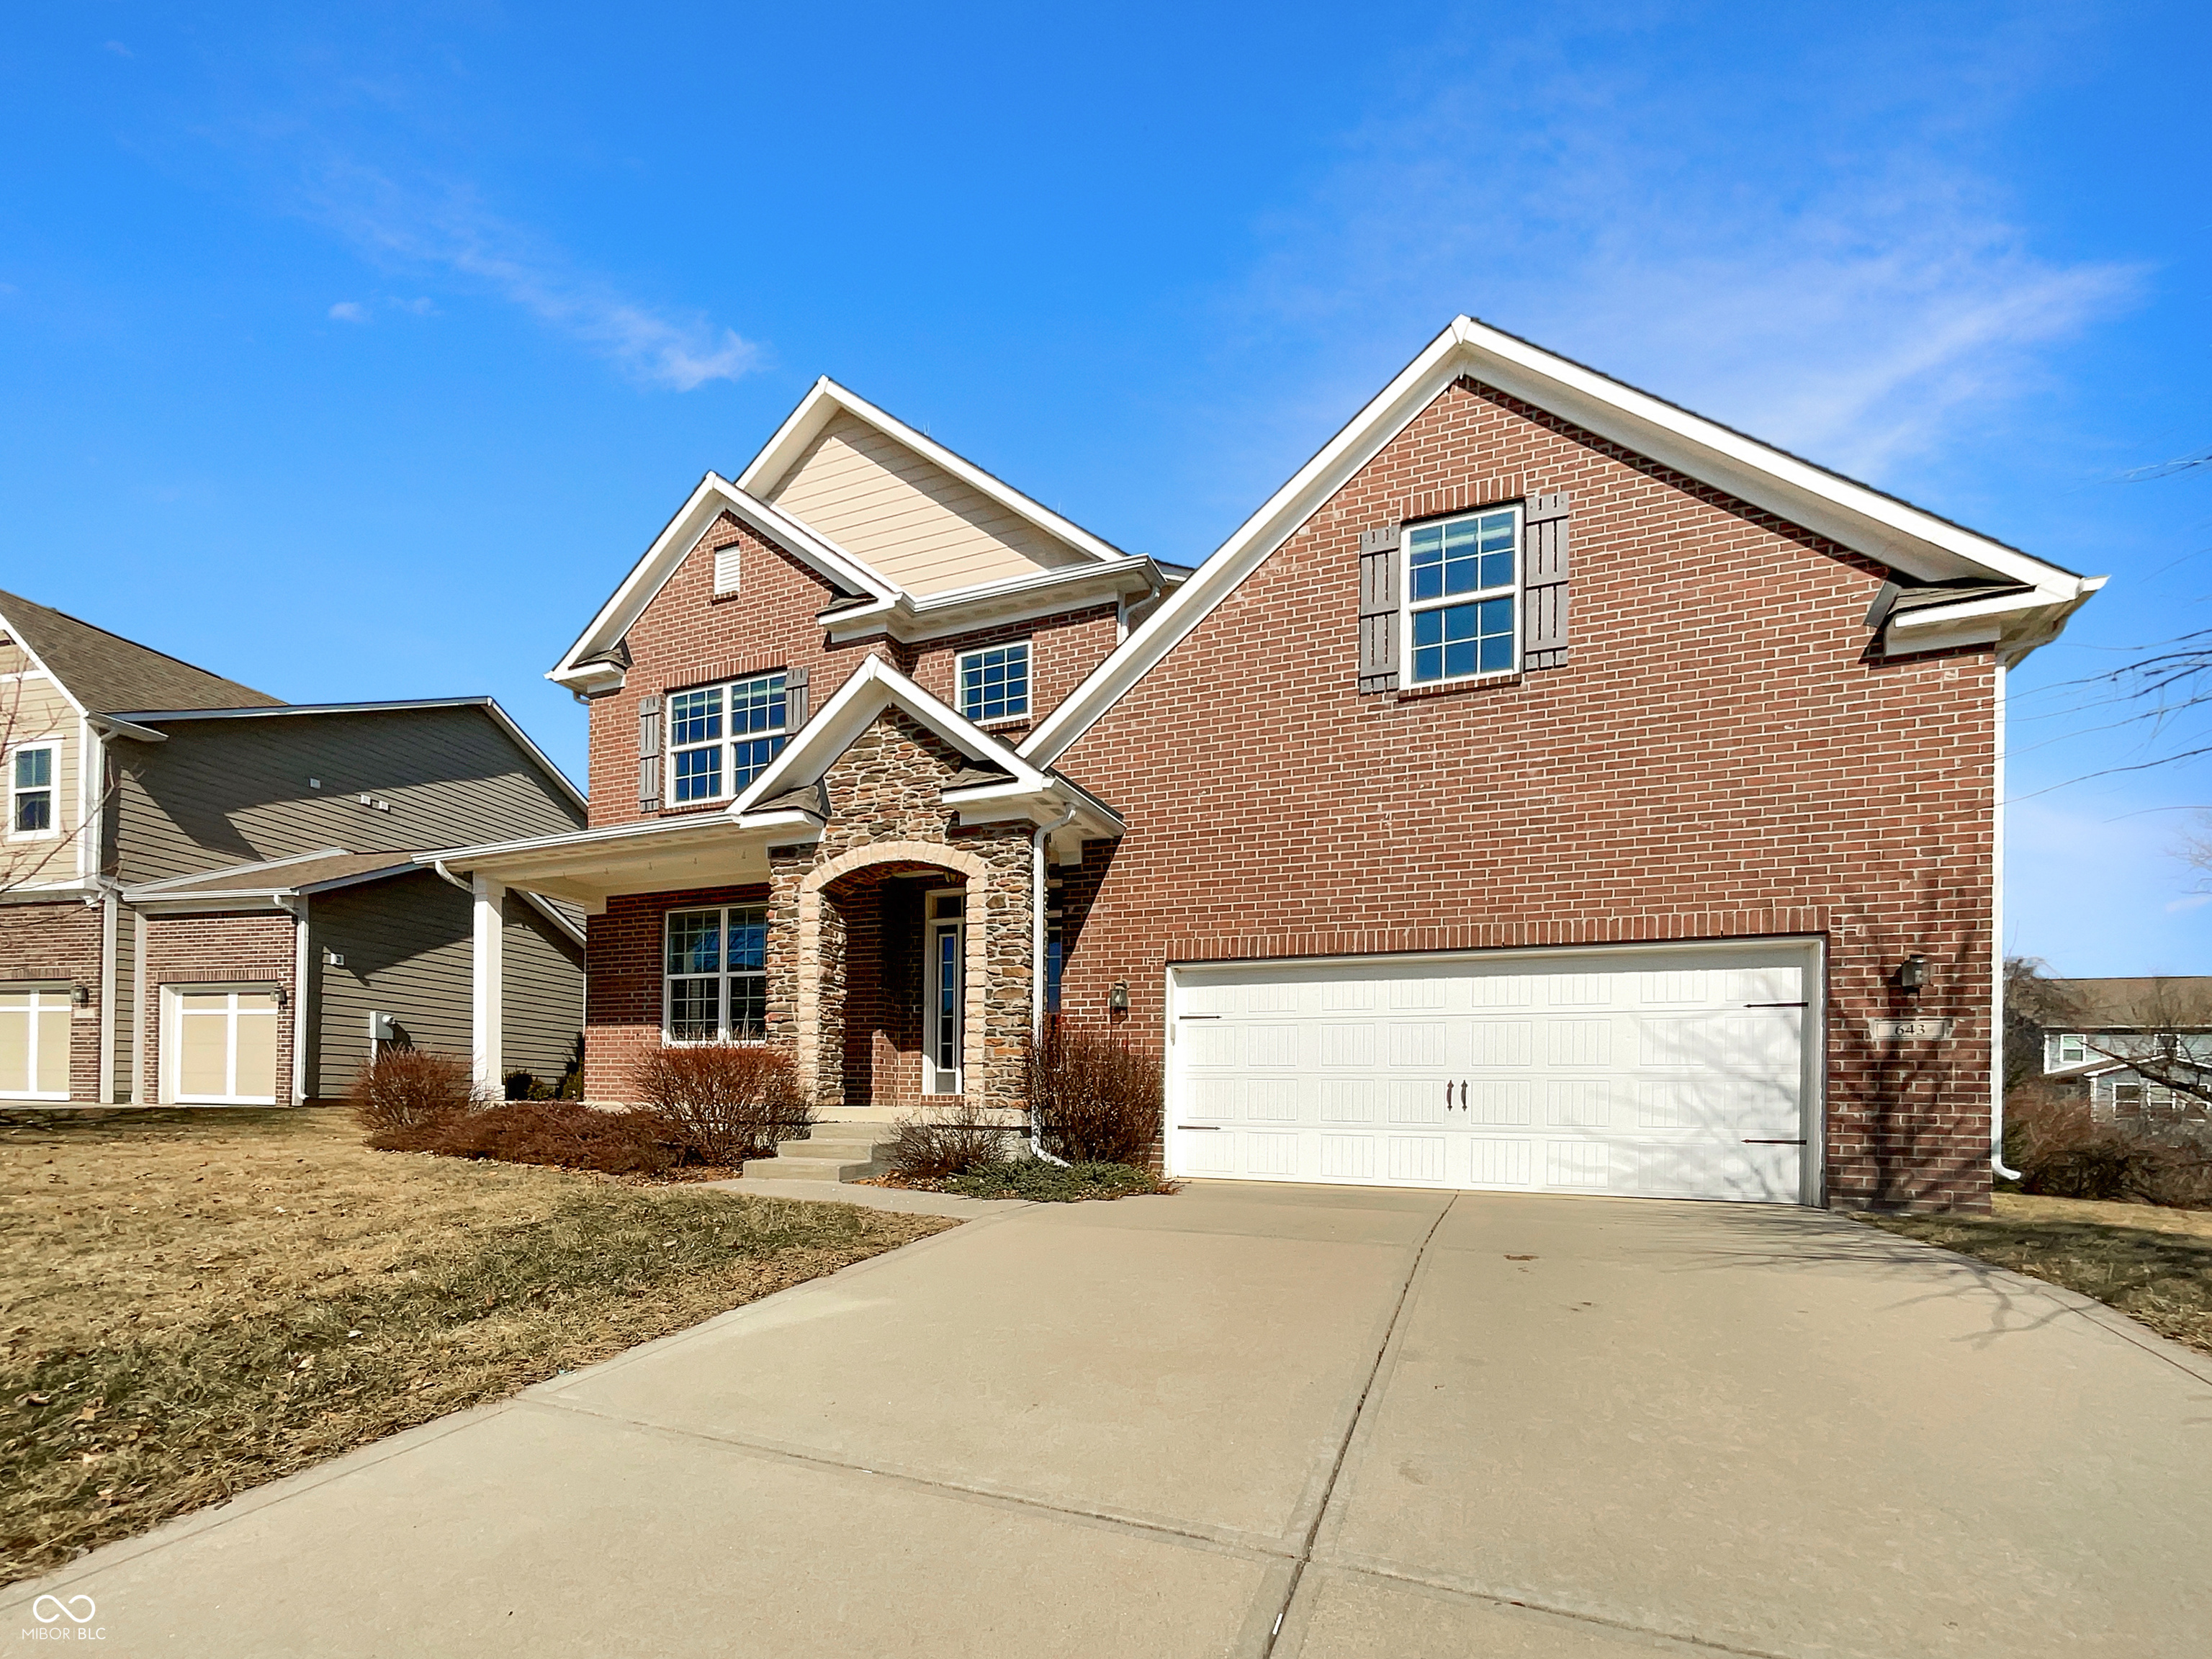
Active
$470,000
4
bds
|
3
ba
|
3,234
sqft
|
built
2013
643 Bracknell Dr, Avon, IN 46123
$-522
Cash flow
-5.8%
Cash-on-Cash Return
4.8%
Cap rate
0.6%
Rent to Value Ratio
Active
$574,999
4
bds
|
4
ba
|
4,318
sqft
|
built
2013
720 Erin Dr, Avon, IN 46123
$-969
Cash flow
-8.8%
Cash-on-Cash Return
4.1%
Cap rate
0.5%
Rent to Value Ratio
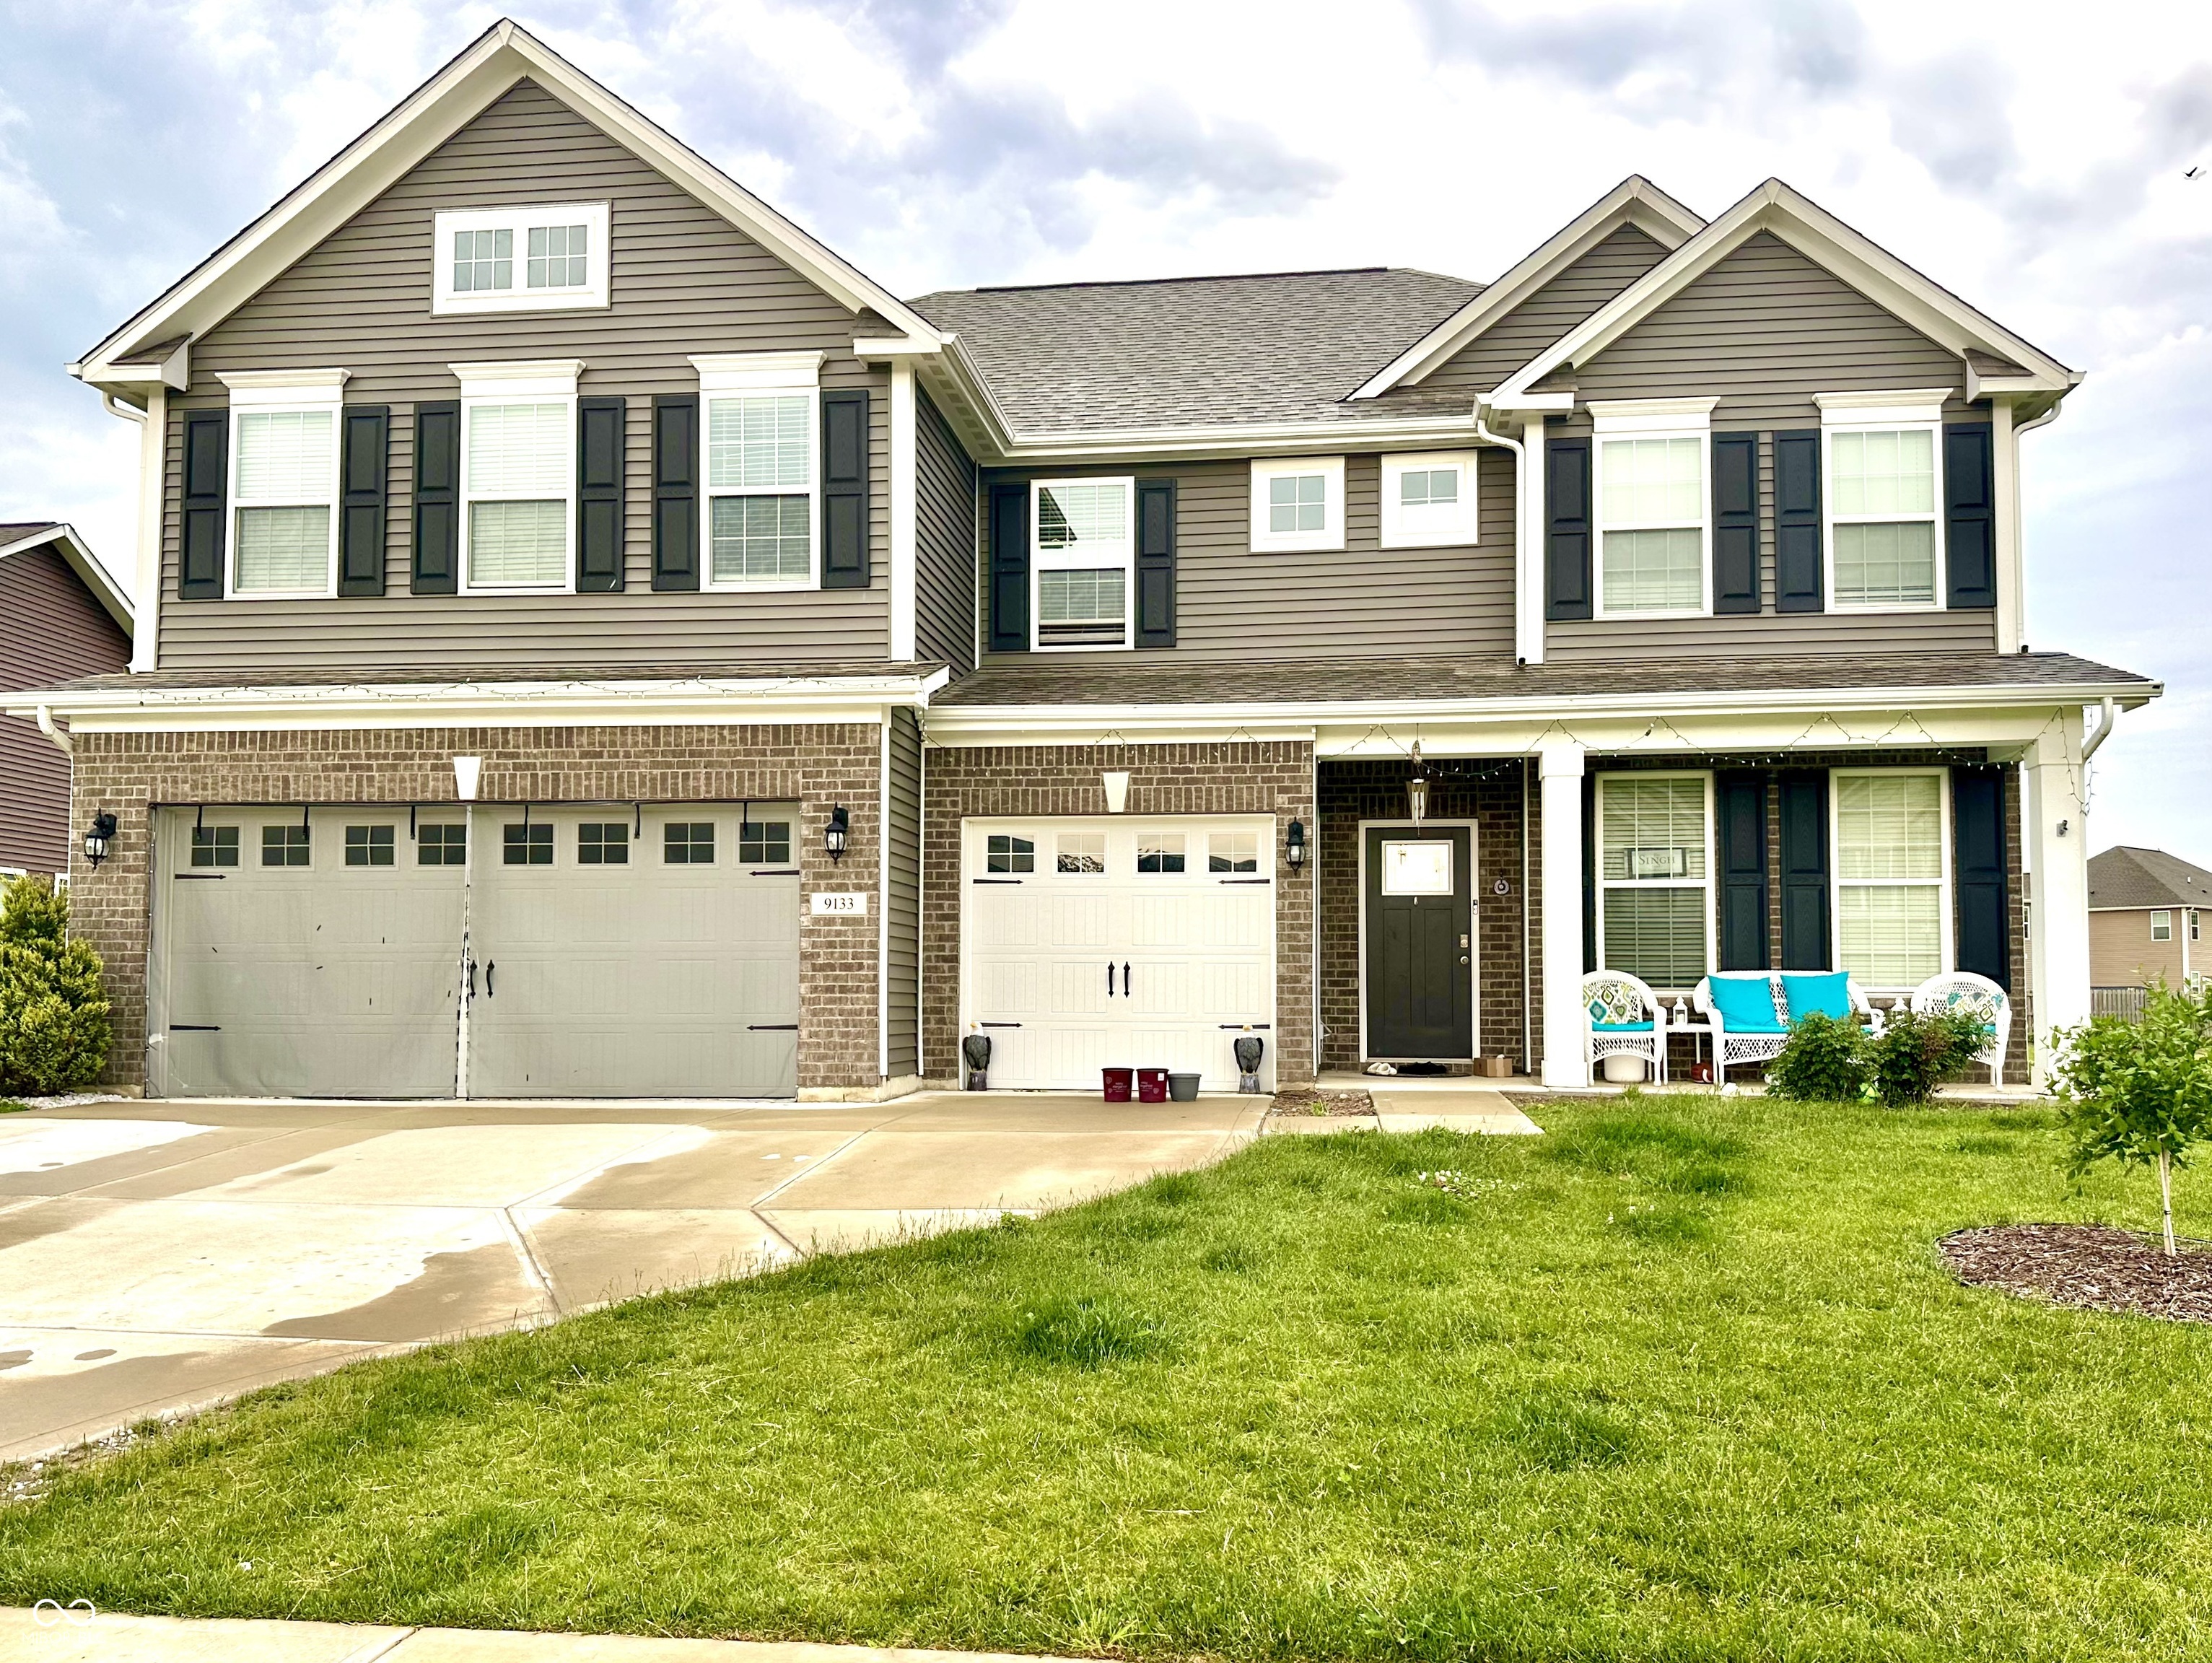
Active
$468,999
5
bds
|
3
ba
|
3,173
sqft
|
built
2020
9133 Thames Dr, Avon, IN 46123
$-503
Cash flow
-5.6%
Cash-on-Cash Return
4.9%
Cap rate
0.6%
Rent to Value Ratio
Active
$280,000
3
bds
|
3
ba
|
1,846
sqft
|
built
2022
1237 Langham St, Avon, IN 46123
$-99
Cash flow
-1.8%
Cash-on-Cash Return
5.7%
Cap rate
0.8%
Rent to Value Ratio
Active
$550,000
4
bds
|
4
ba
|
3,455
sqft
|
built
2005
2353 Woodcreek Crossing Blvd, Avon, IN 46123
$-940
Cash flow
-8.9%
Cash-on-Cash Return
4.1%
Cap rate
0.5%
Rent to Value Ratio
Active
$296,000
3
bds
|
2
ba
|
1,400
sqft
|
built
1996
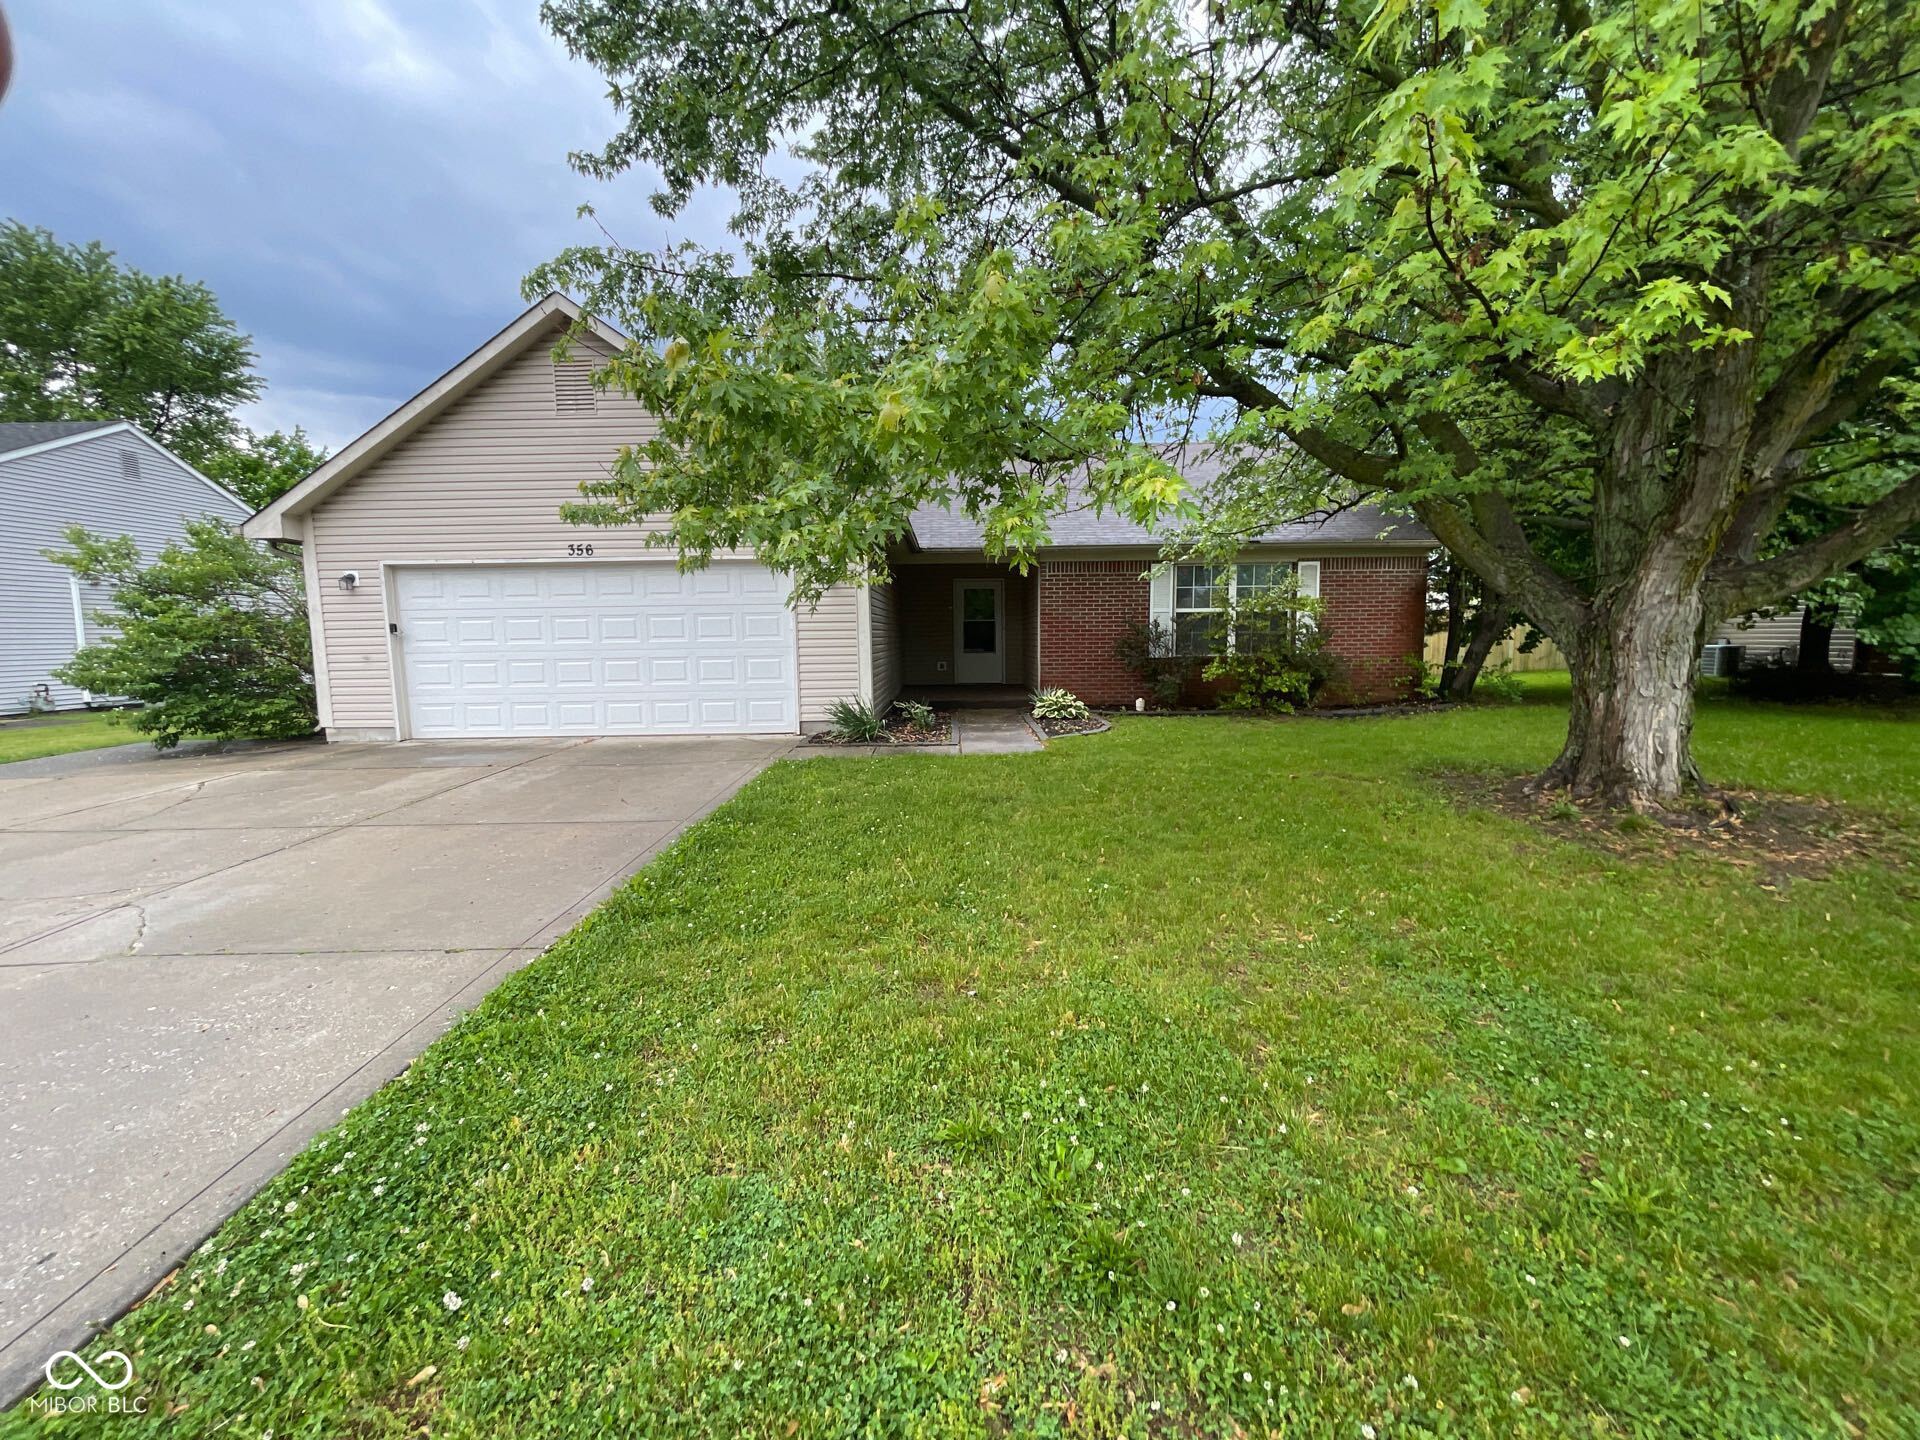
356 Seabreeze Cir, Avon, IN 46123
$-274
Cash flow
-4.8%
Cash-on-Cash Return
5.0%
Cap rate
0.6%
Rent to Value Ratio
Active
$399,900
4
bds
|
3
ba
|
3,212
sqft
|
built
1987
6567 Kings Ct, Avon, IN 46123
$-323
Cash flow
-4.2%
Cash-on-Cash Return
5.2%
Cap rate
0.6%
Rent to Value Ratio
Active
$975,000
5
bds
|
5
ba
|
6,148
sqft
|
built
2005
790 Foxboro Dr, Avon, IN 46123
$-1,590
Cash flow
-8.5%
Cash-on-Cash Return
4.2%
Cap rate
0.5%
Rent to Value Ratio
Active
$499,500
5
bds
|
4
ba
|
3,090
sqft
|
built
2000
6272 Turnbridge Dr, Avon, IN 46123
$-608
Cash flow
-6.4%
Cash-on-Cash Return
4.7%
Cap rate
0.6%
Rent to Value Ratio
Active
$434,900
4
bds
|
3
ba
|
2,710
sqft
|
built
1978
6682 English Dr, Avon, IN 46123
$-20
Cash flow
-0.2%
Cash-on-Cash Return
6.1%
Cap rate
0.7%
Rent to Value Ratio