Avon, IN Investment Properties for Sale
Browse homes for sale and investment properties in Avon, IN. Refine your search by price, property type, or more.
Best cash flowing properties in Avon, IN
Active
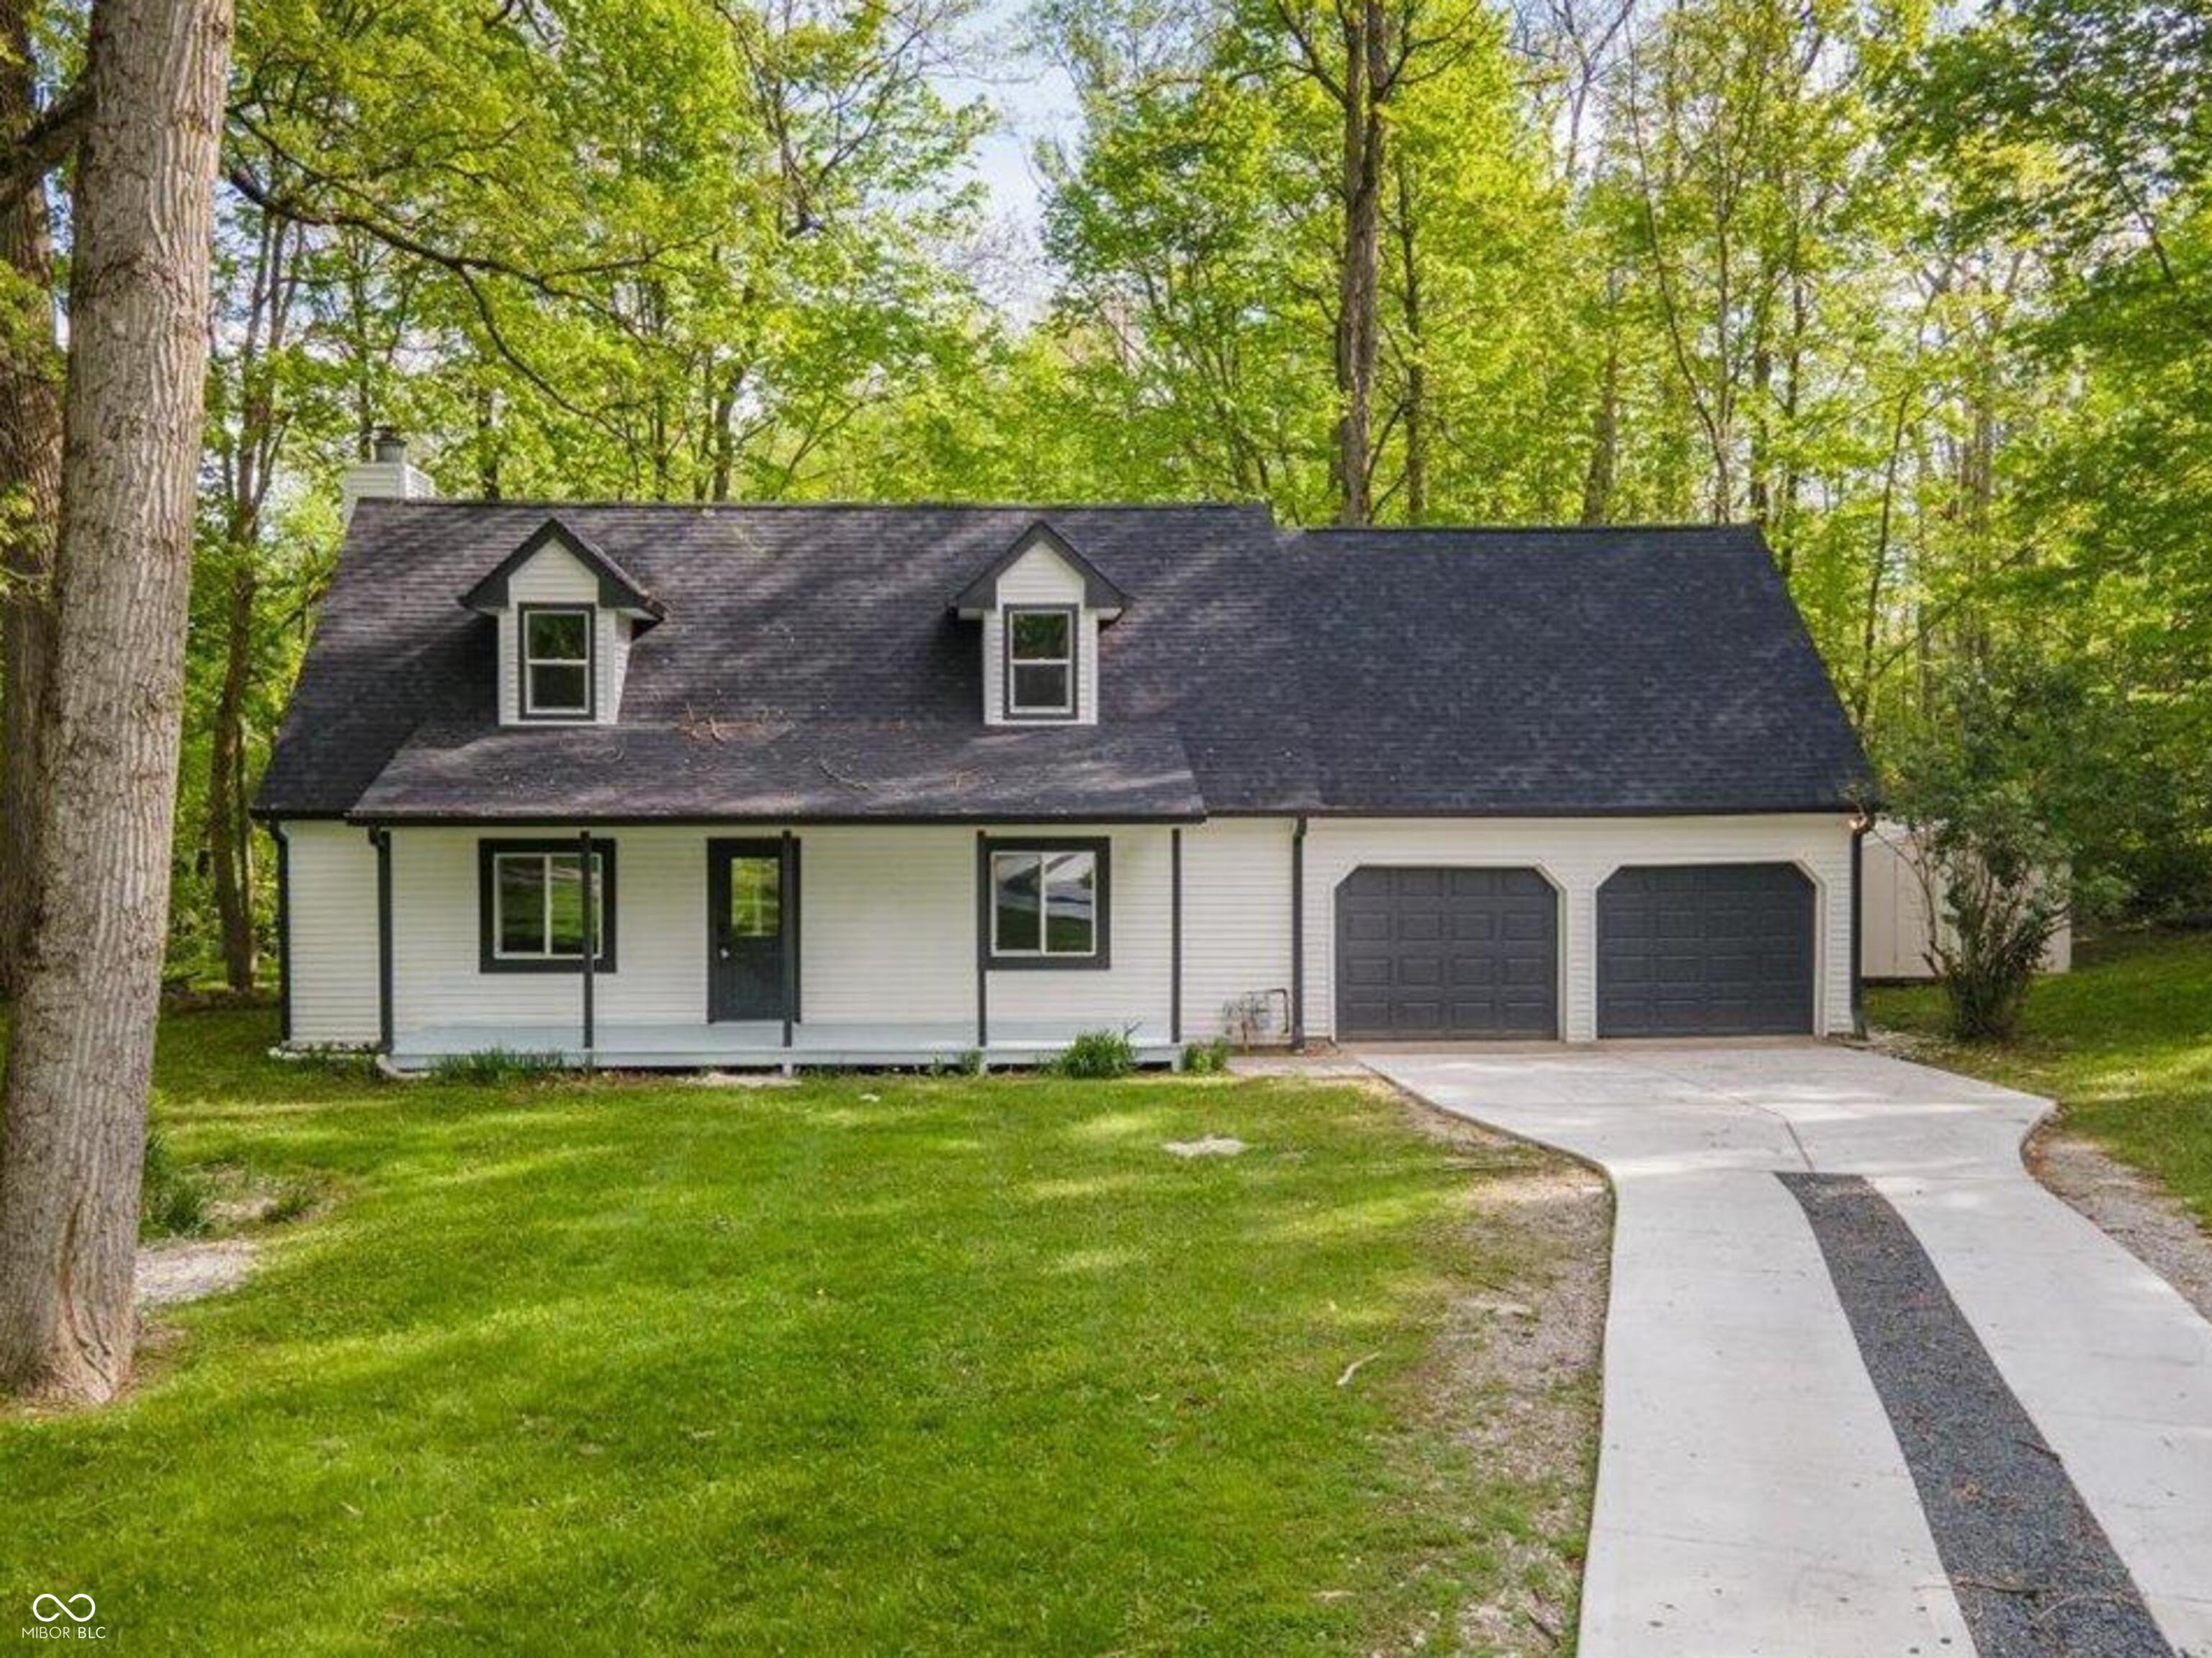
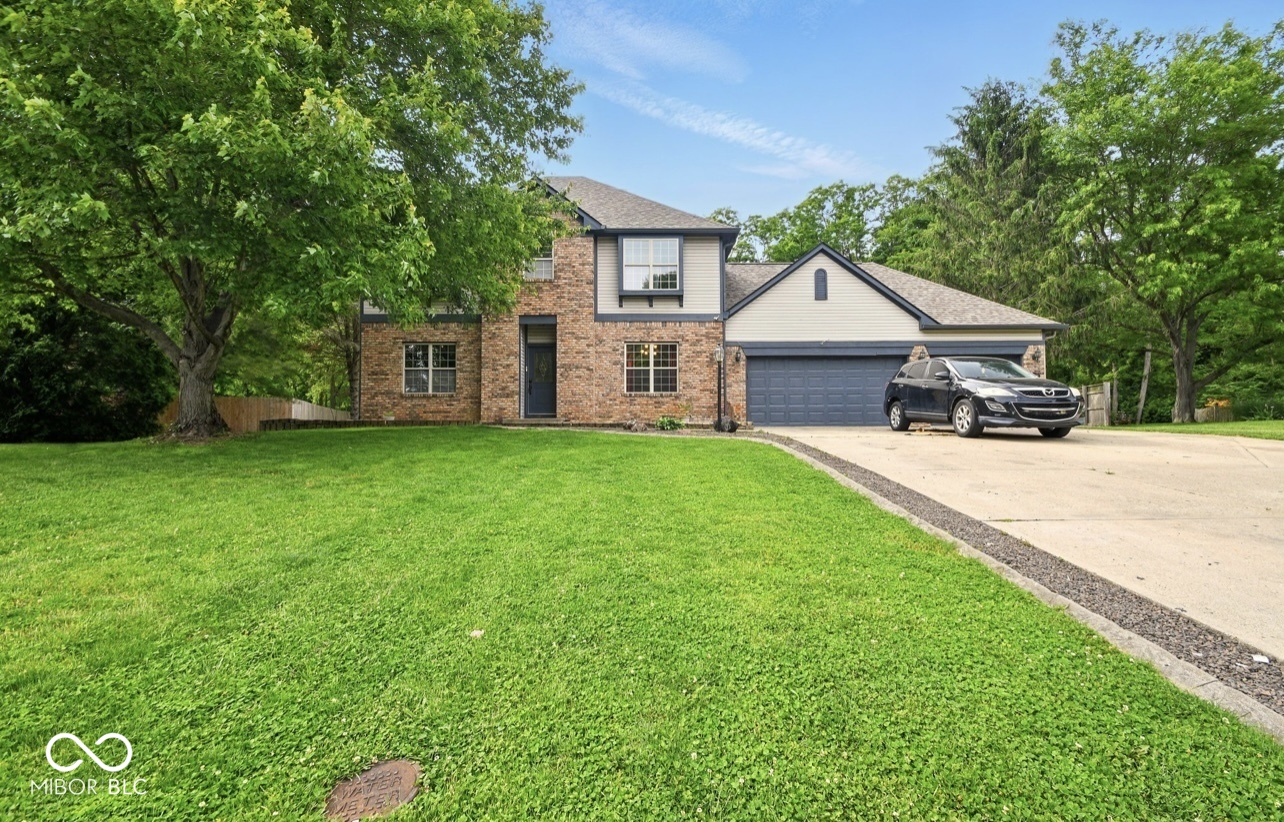
$434,900
4
bds
|
3
ba
|
2,710
sqft
|
built
1978
6682 English Dr, Avon, IN 46123
$-72
Cash flow
-0.9%
Cash-on-Cash Return
6.1%
Cap rate
0.7%
Rent to Value Ratio
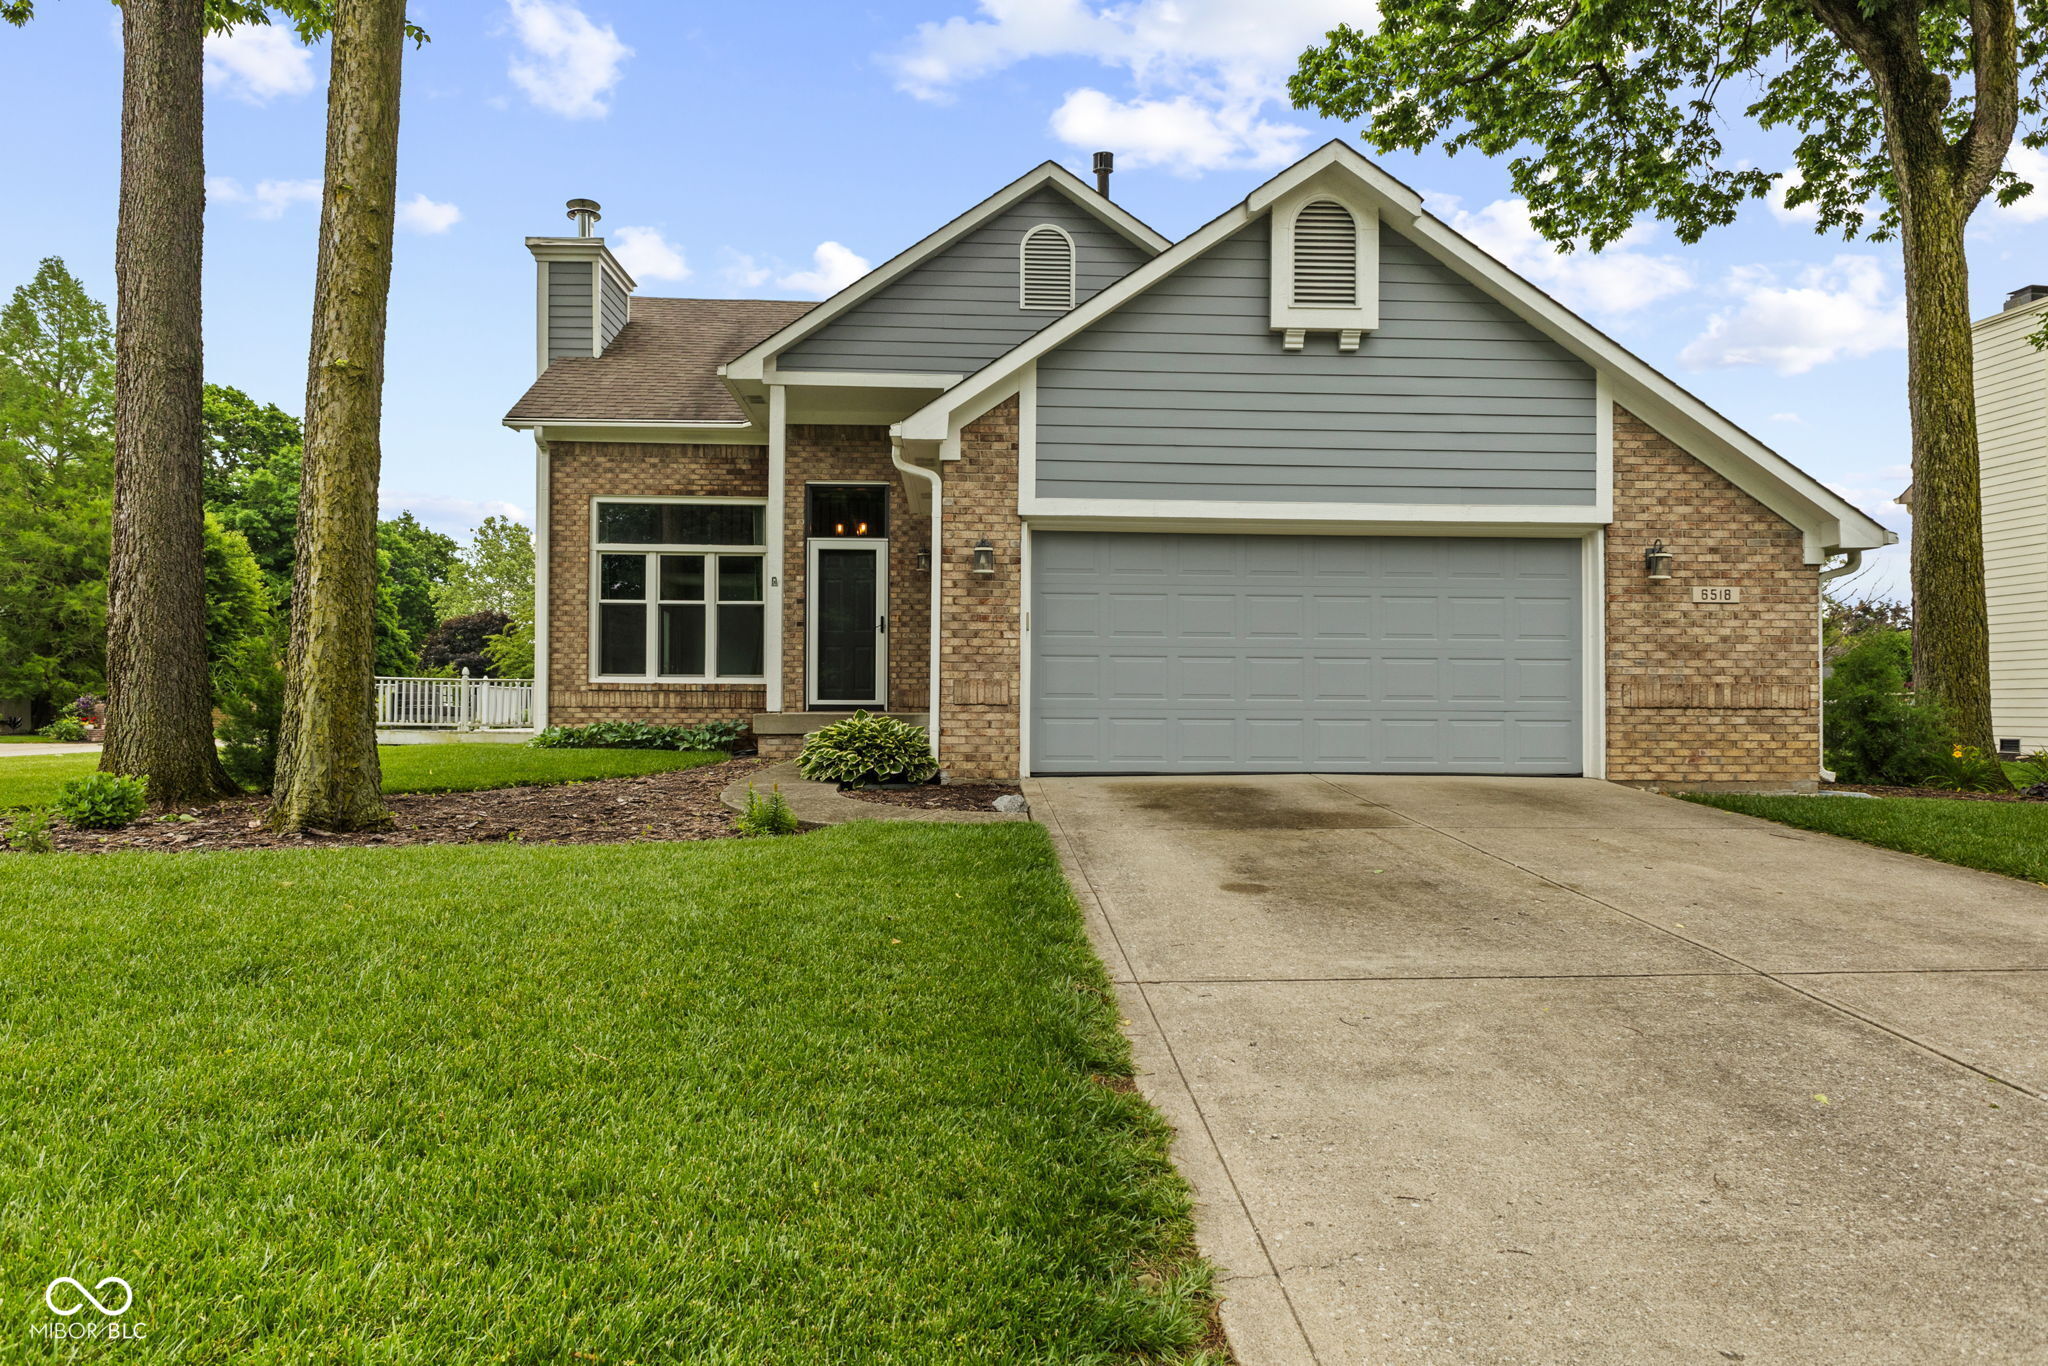
Pending
$350,000
4
bds
|
3
ba
|
2,476
sqft
|
built
1991
6518 Springview Dr, Avon, IN 46123
$-110
Cash flow
-1.6%
Cash-on-Cash Return
5.9%
Cap rate
0.7%
Rent to Value Ratio
98 out of 107 properties for sale in Avon, IN
Limited Results Shown
Create a free account, or log in to reveal all property listings and enjoy the complete experience.
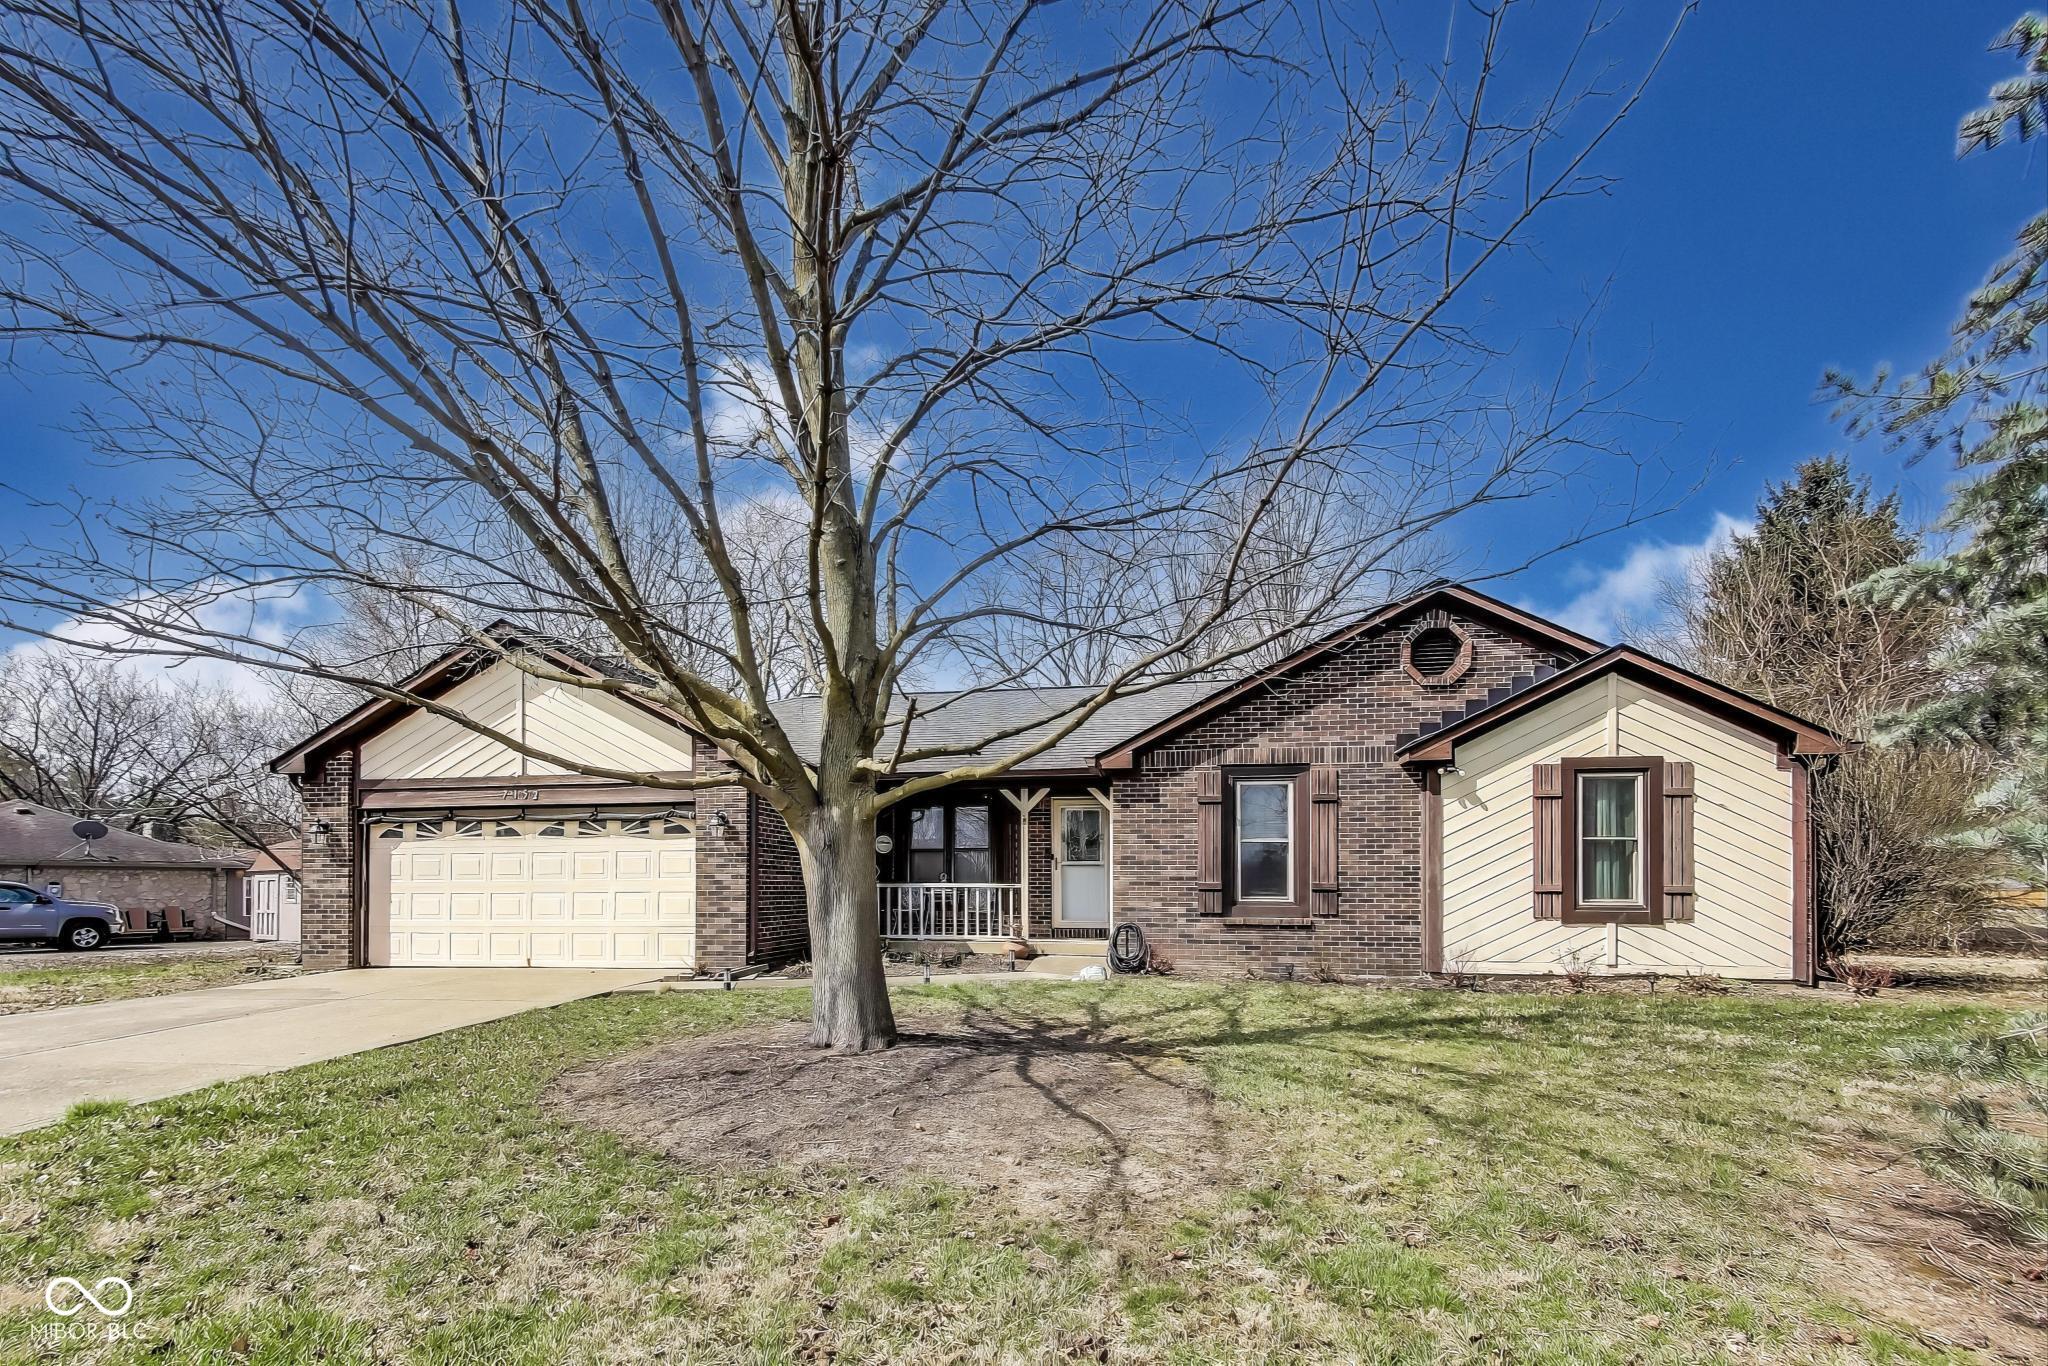
Active
$300,000
3
bds
|
2
ba
|
1,457
sqft
|
built
1985
7152 Sandalwood Dr, Avon, IN 46123
$-193
Cash flow
-3.4%
Cash-on-Cash Return
5.5%
Cap rate
0.7%
Rent to Value Ratio

Active
$335,000
4
bds
|
3
ba
|
2,350
sqft
|
built
2005
9692 Centennial Ct, Avon, IN 46123
$-279
Cash flow
-4.3%
Cash-on-Cash Return
5.3%
Cap rate
0.7%
Rent to Value Ratio

Active
$364,900
3
bds
|
2
ba
|
1,649
sqft
|
built
1974
7870 E County Road 150 S, Avon, IN 46123
$-533
Cash flow
-7.6%
Cash-on-Cash Return
4.5%
Cap rate
0.5%
Rent to Value Ratio

Active
$335,000
3
bds
|
2
ba
|
1,752
sqft
|
built
1994
959 Harvest Ridge Dr, Avon, IN 46123
$-397
Cash flow
-6.2%
Cash-on-Cash Return
4.9%
Cap rate
0.6%
Rent to Value Ratio
Active
$459,900
3
bds
|
3
ba
|
2,829
sqft
|
built
2003
804 Seabreeze Dr, Avon, IN 46123
$-700
Cash flow
-7.9%
Cash-on-Cash Return
4.5%
Cap rate
0.5%
Rent to Value Ratio
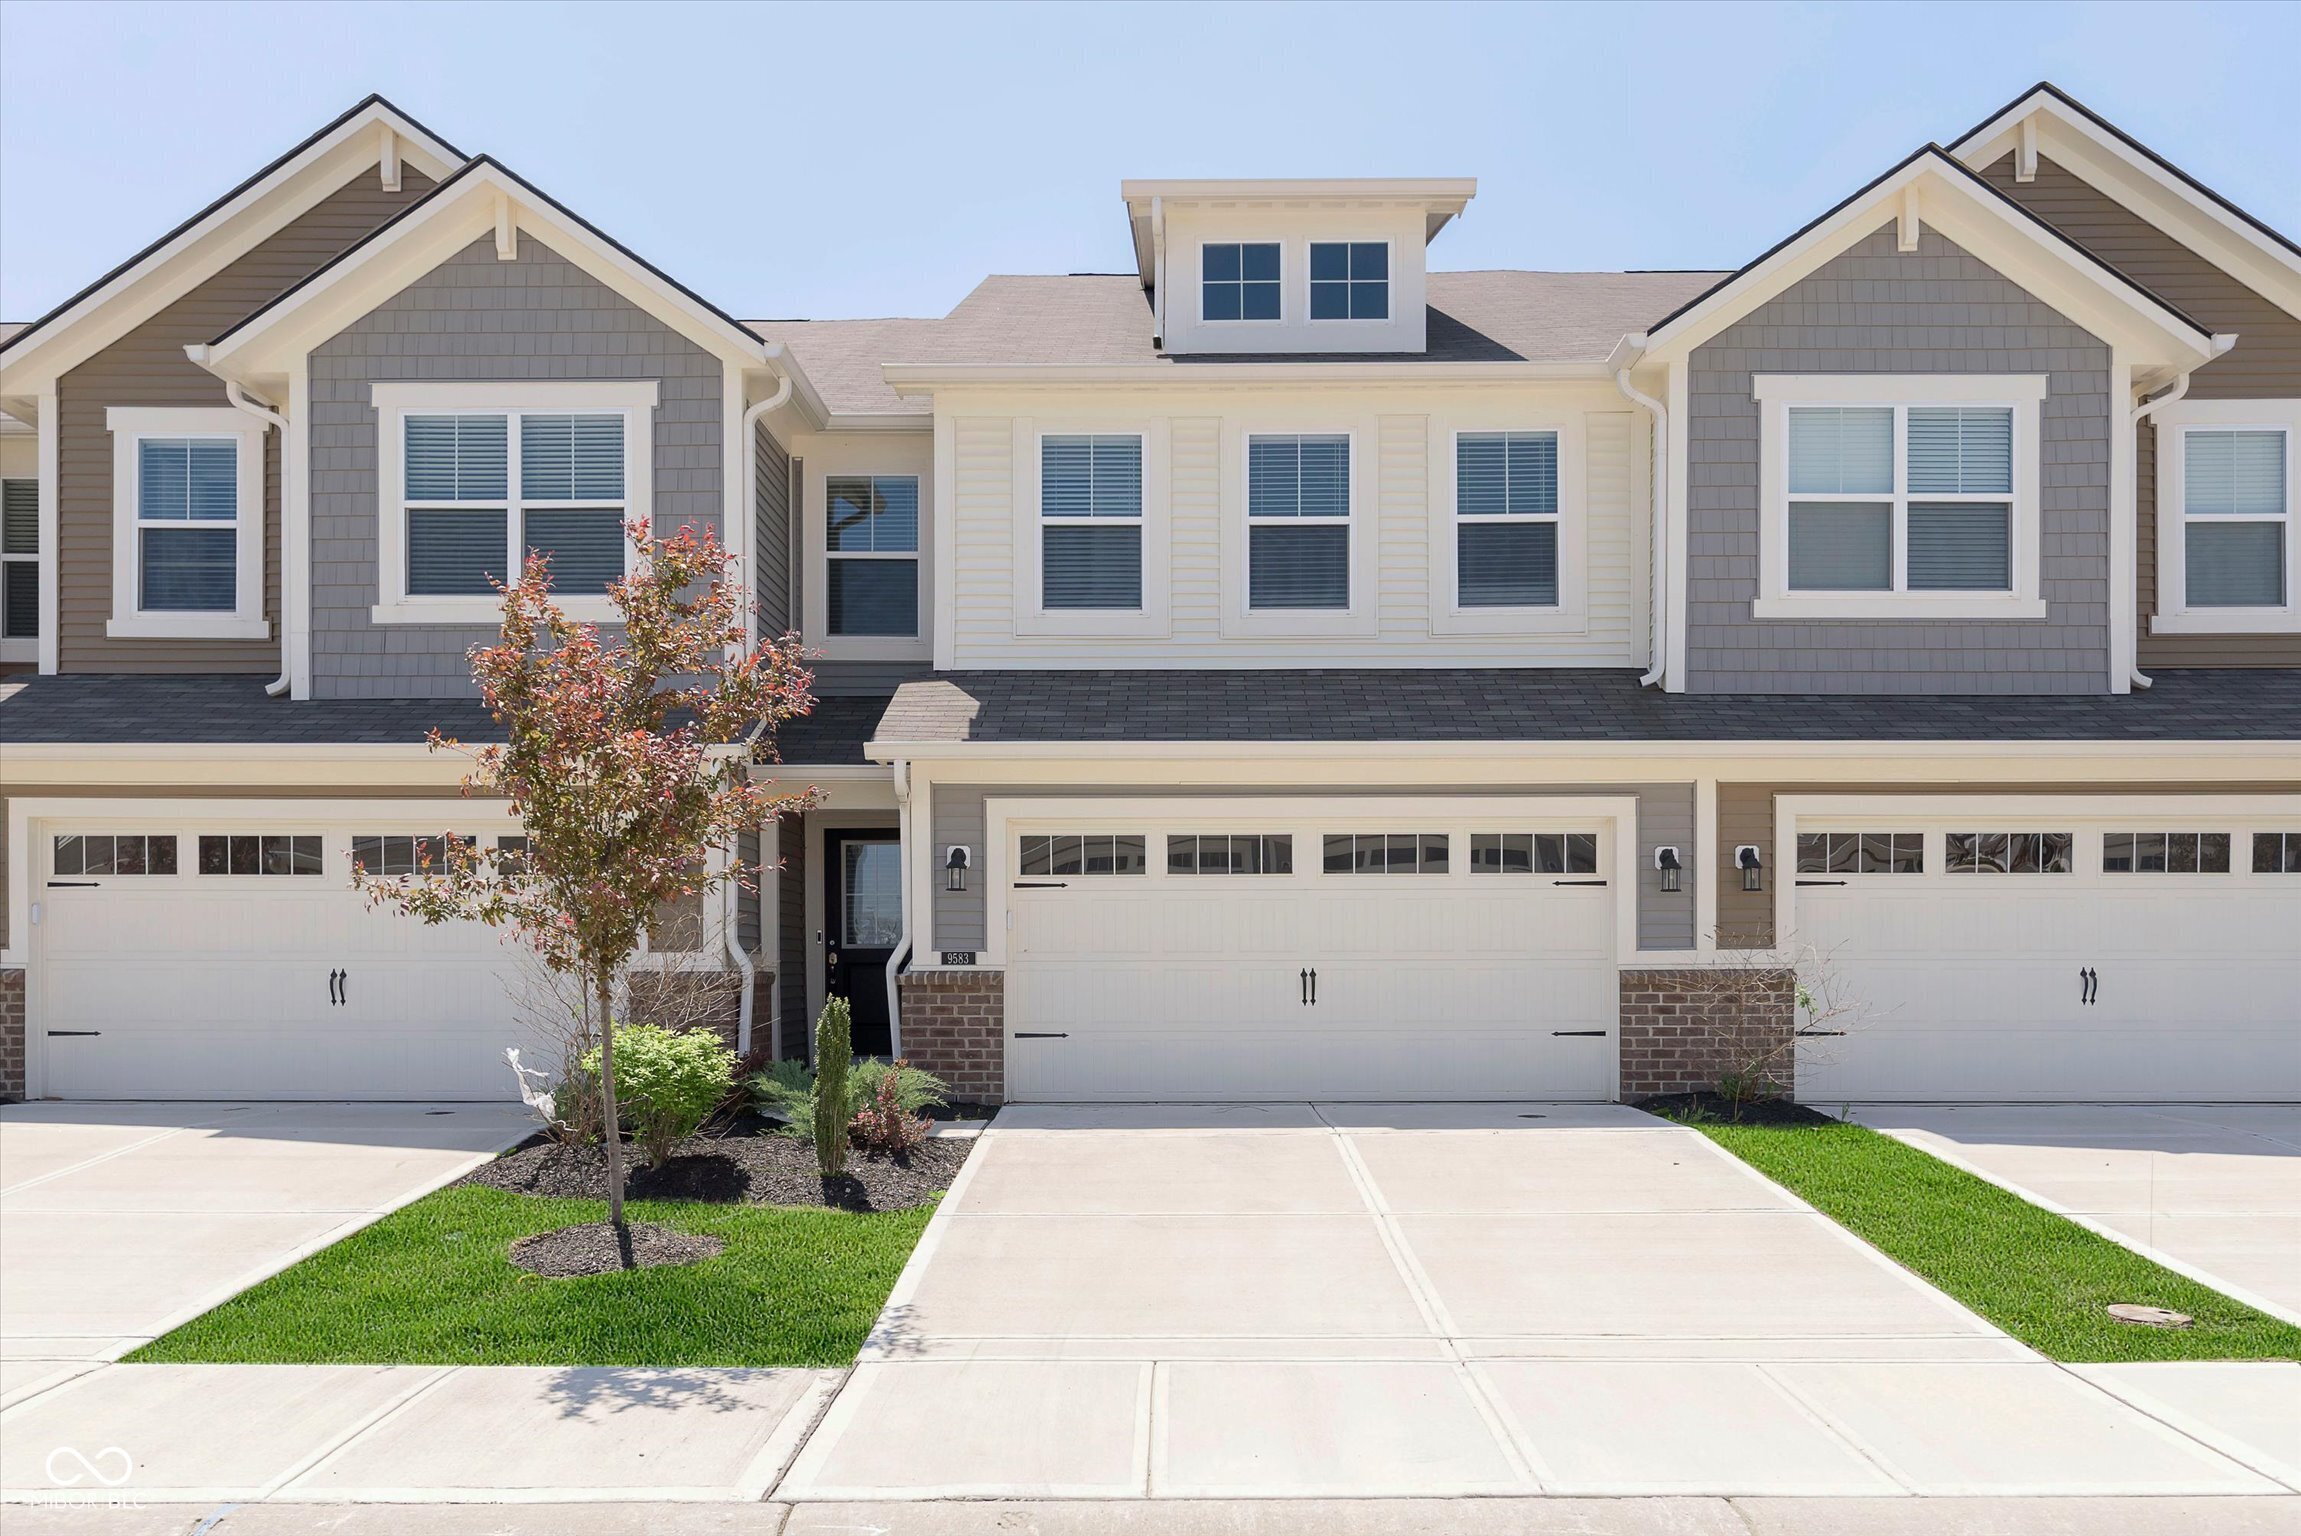
Active
$280,000
3
bds
|
3
ba
|
1,846
sqft
|
built
2022
9583 Beckett St, Avon, IN 46123
$-133
Cash flow
-2.5%
Cash-on-Cash Return
5.7%
Cap rate
0.8%
Rent to Value Ratio
Active
$434,900
4
bds
|
3
ba
|
2,710
sqft
|
built
1978
6682 English Dr, Avon, IN 46123
$-72
Cash flow
-0.9%
Cash-on-Cash Return
6.1%
Cap rate
0.7%
Rent to Value Ratio
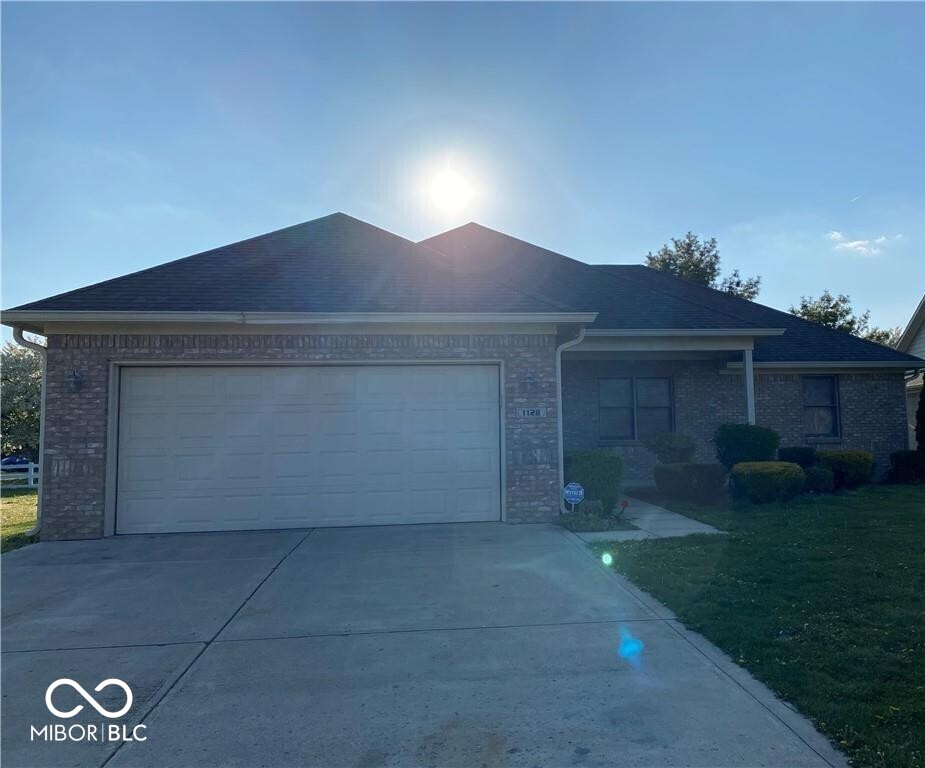
Active
$359,900
3
bds
|
2
ba
|
1,510
sqft
|
built
2005
1128 Brookside Ct, Avon, IN 46123
$-507
Cash flow
-7.3%
Cash-on-Cash Return
4.6%
Cap rate
0.6%
Rent to Value Ratio
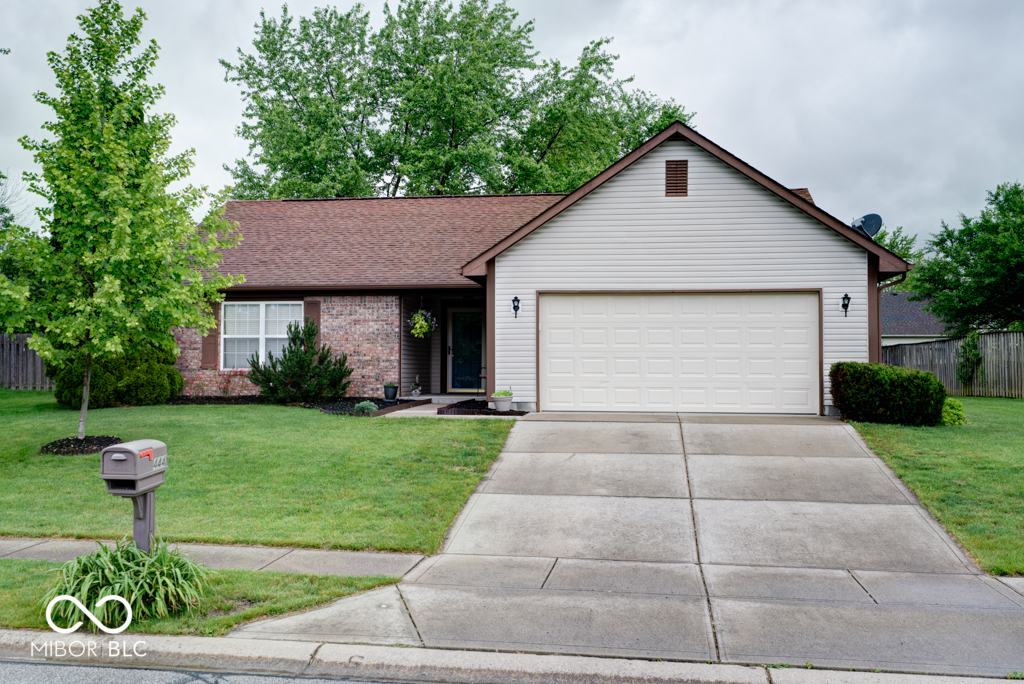
Active
$290,000
3
bds
|
2
ba
|
1,400
sqft
|
built
1996
444 Austin Dr, Avon, IN 46123
$-227
Cash flow
-4.1%
Cash-on-Cash Return
5.4%
Cap rate
0.7%
Rent to Value Ratio
Active
$390,000
3
bds
|
4
ba
|
4,576
sqft
|
built
2021
9101 Stone Trace Blvd, Avon, IN 46123
$-469
Cash flow
-6.3%
Cash-on-Cash Return
4.8%
Cap rate
0.6%
Rent to Value Ratio
Active
$600,000
5
bds
|
5
ba
|
4,930
sqft
|
built
2016
4196 Parliament Way, Avon, IN 46123
$-1,397
Cash flow
-12.1%
Cash-on-Cash Return
3.5%
Cap rate
0.4%
Rent to Value Ratio
Active
$450,000
4
bds
|
3
ba
|
3,344
sqft
|
built
2002
1792 Salina Dr, Avon, IN 46123
$-590
Cash flow
-6.8%
Cash-on-Cash Return
4.7%
Cap rate
0.6%
Rent to Value Ratio
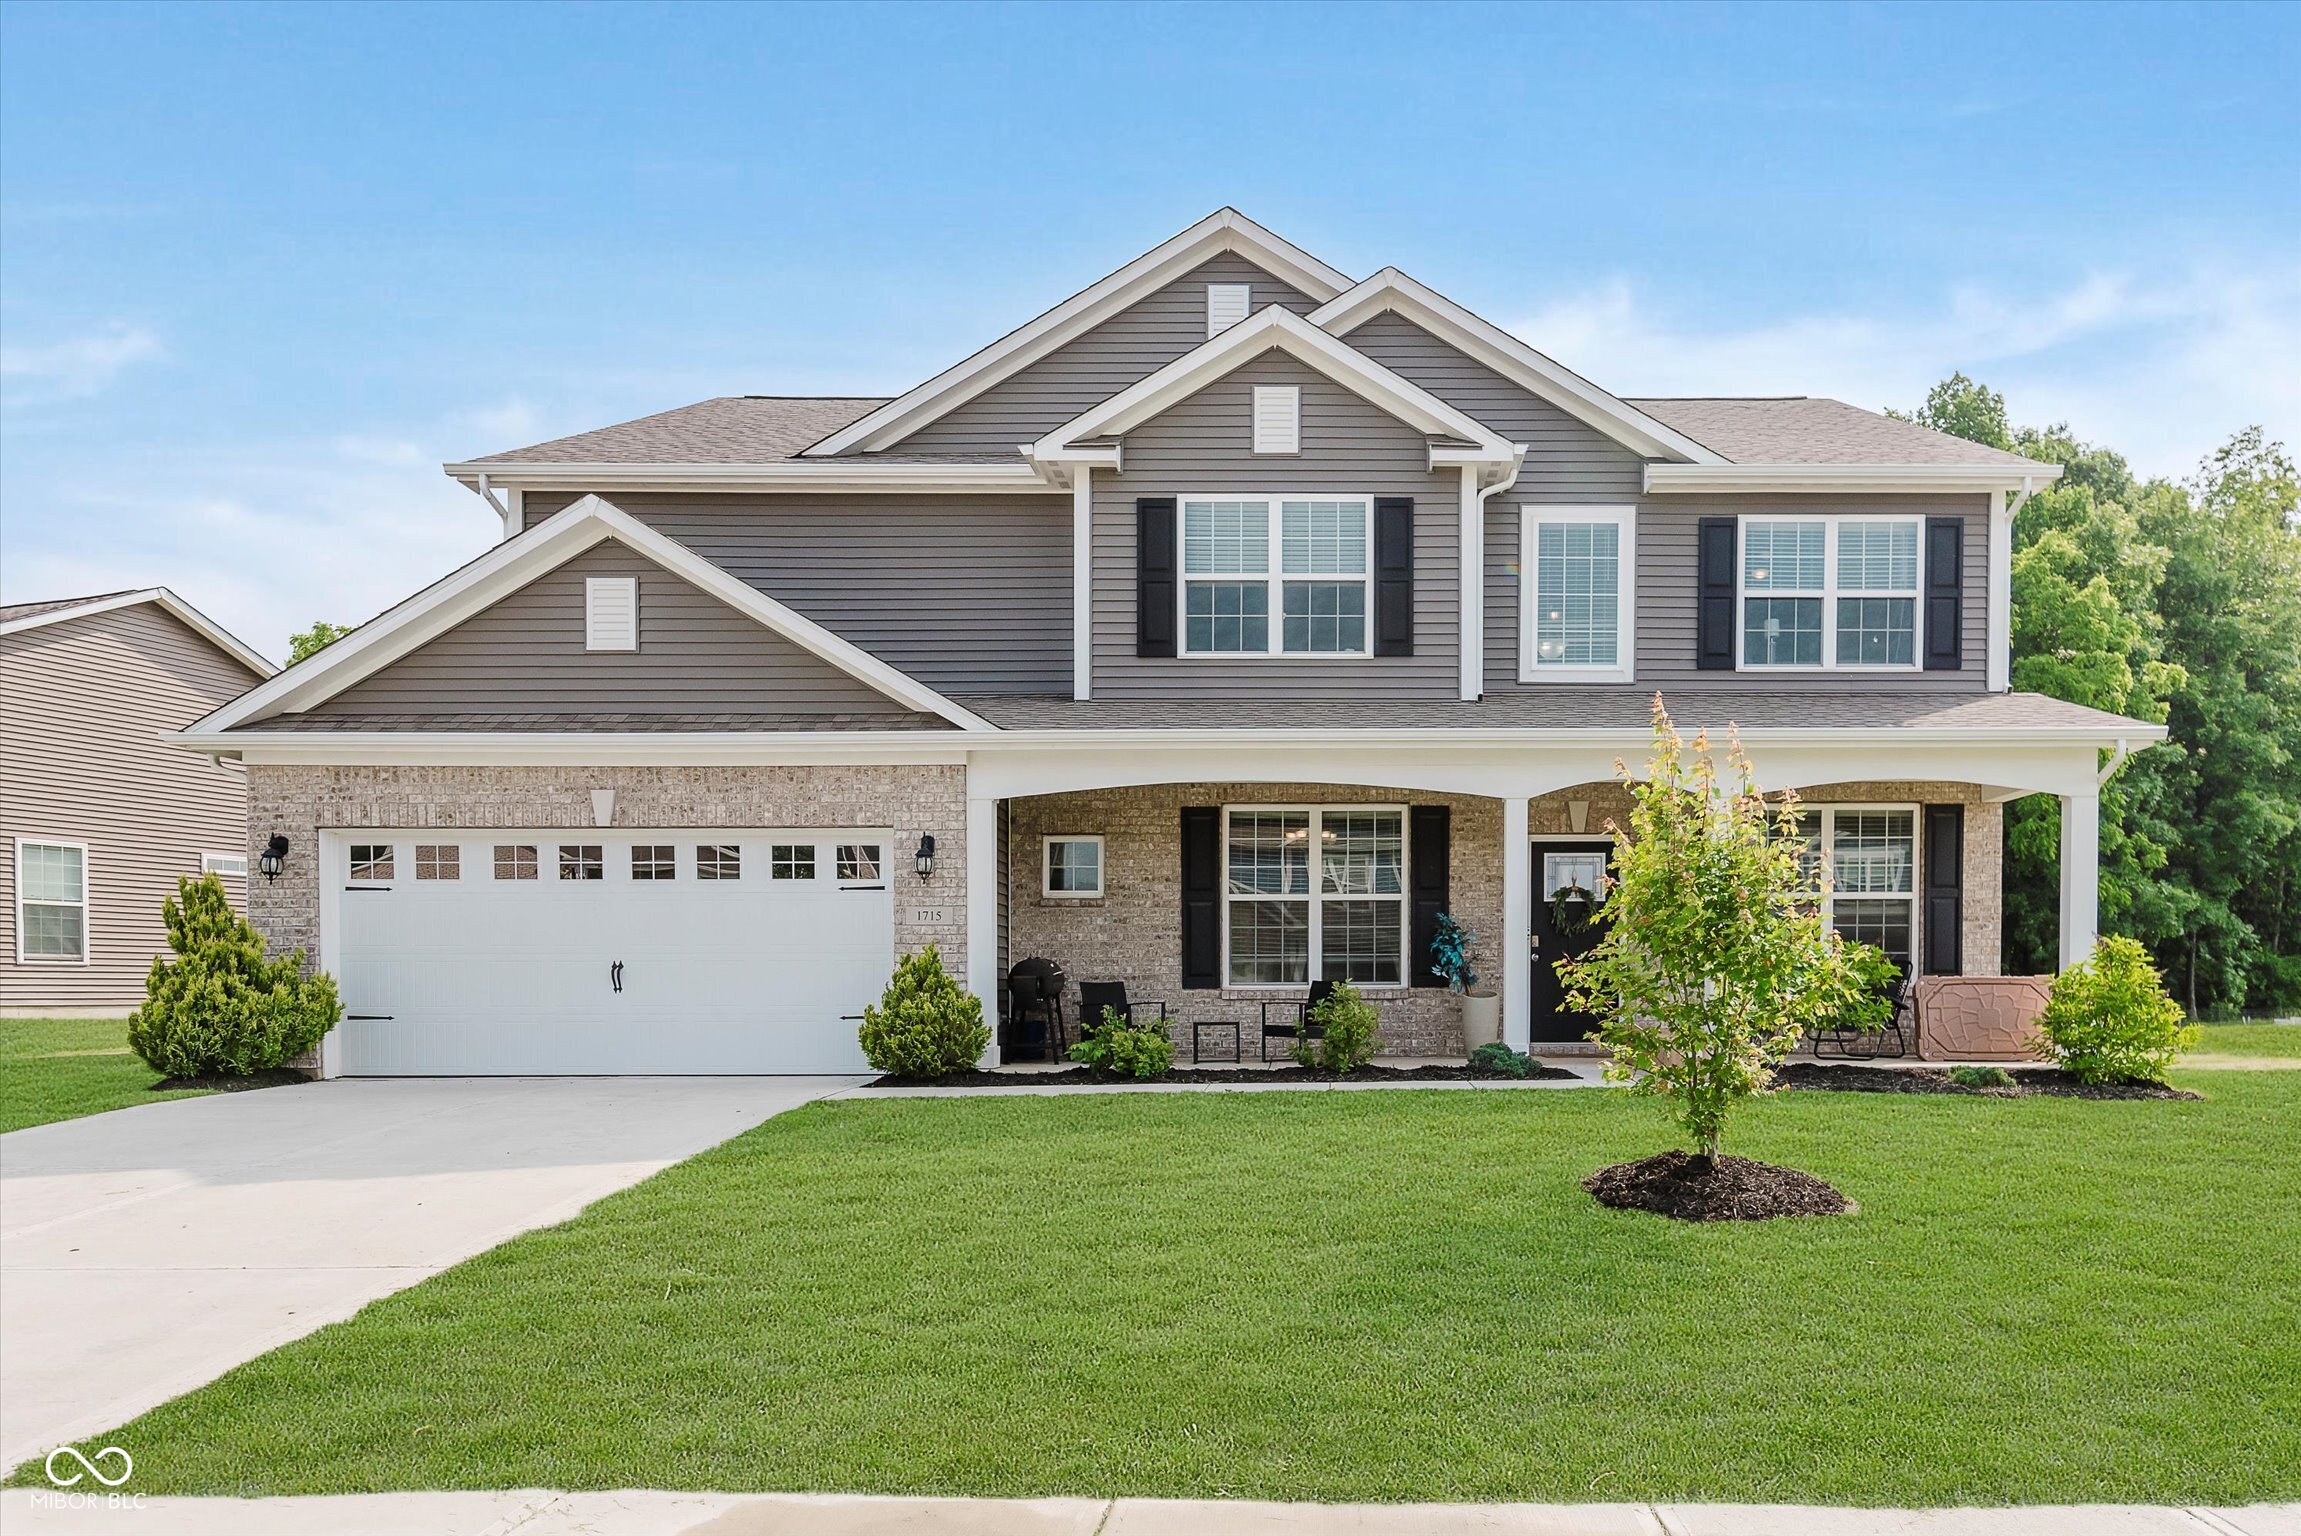
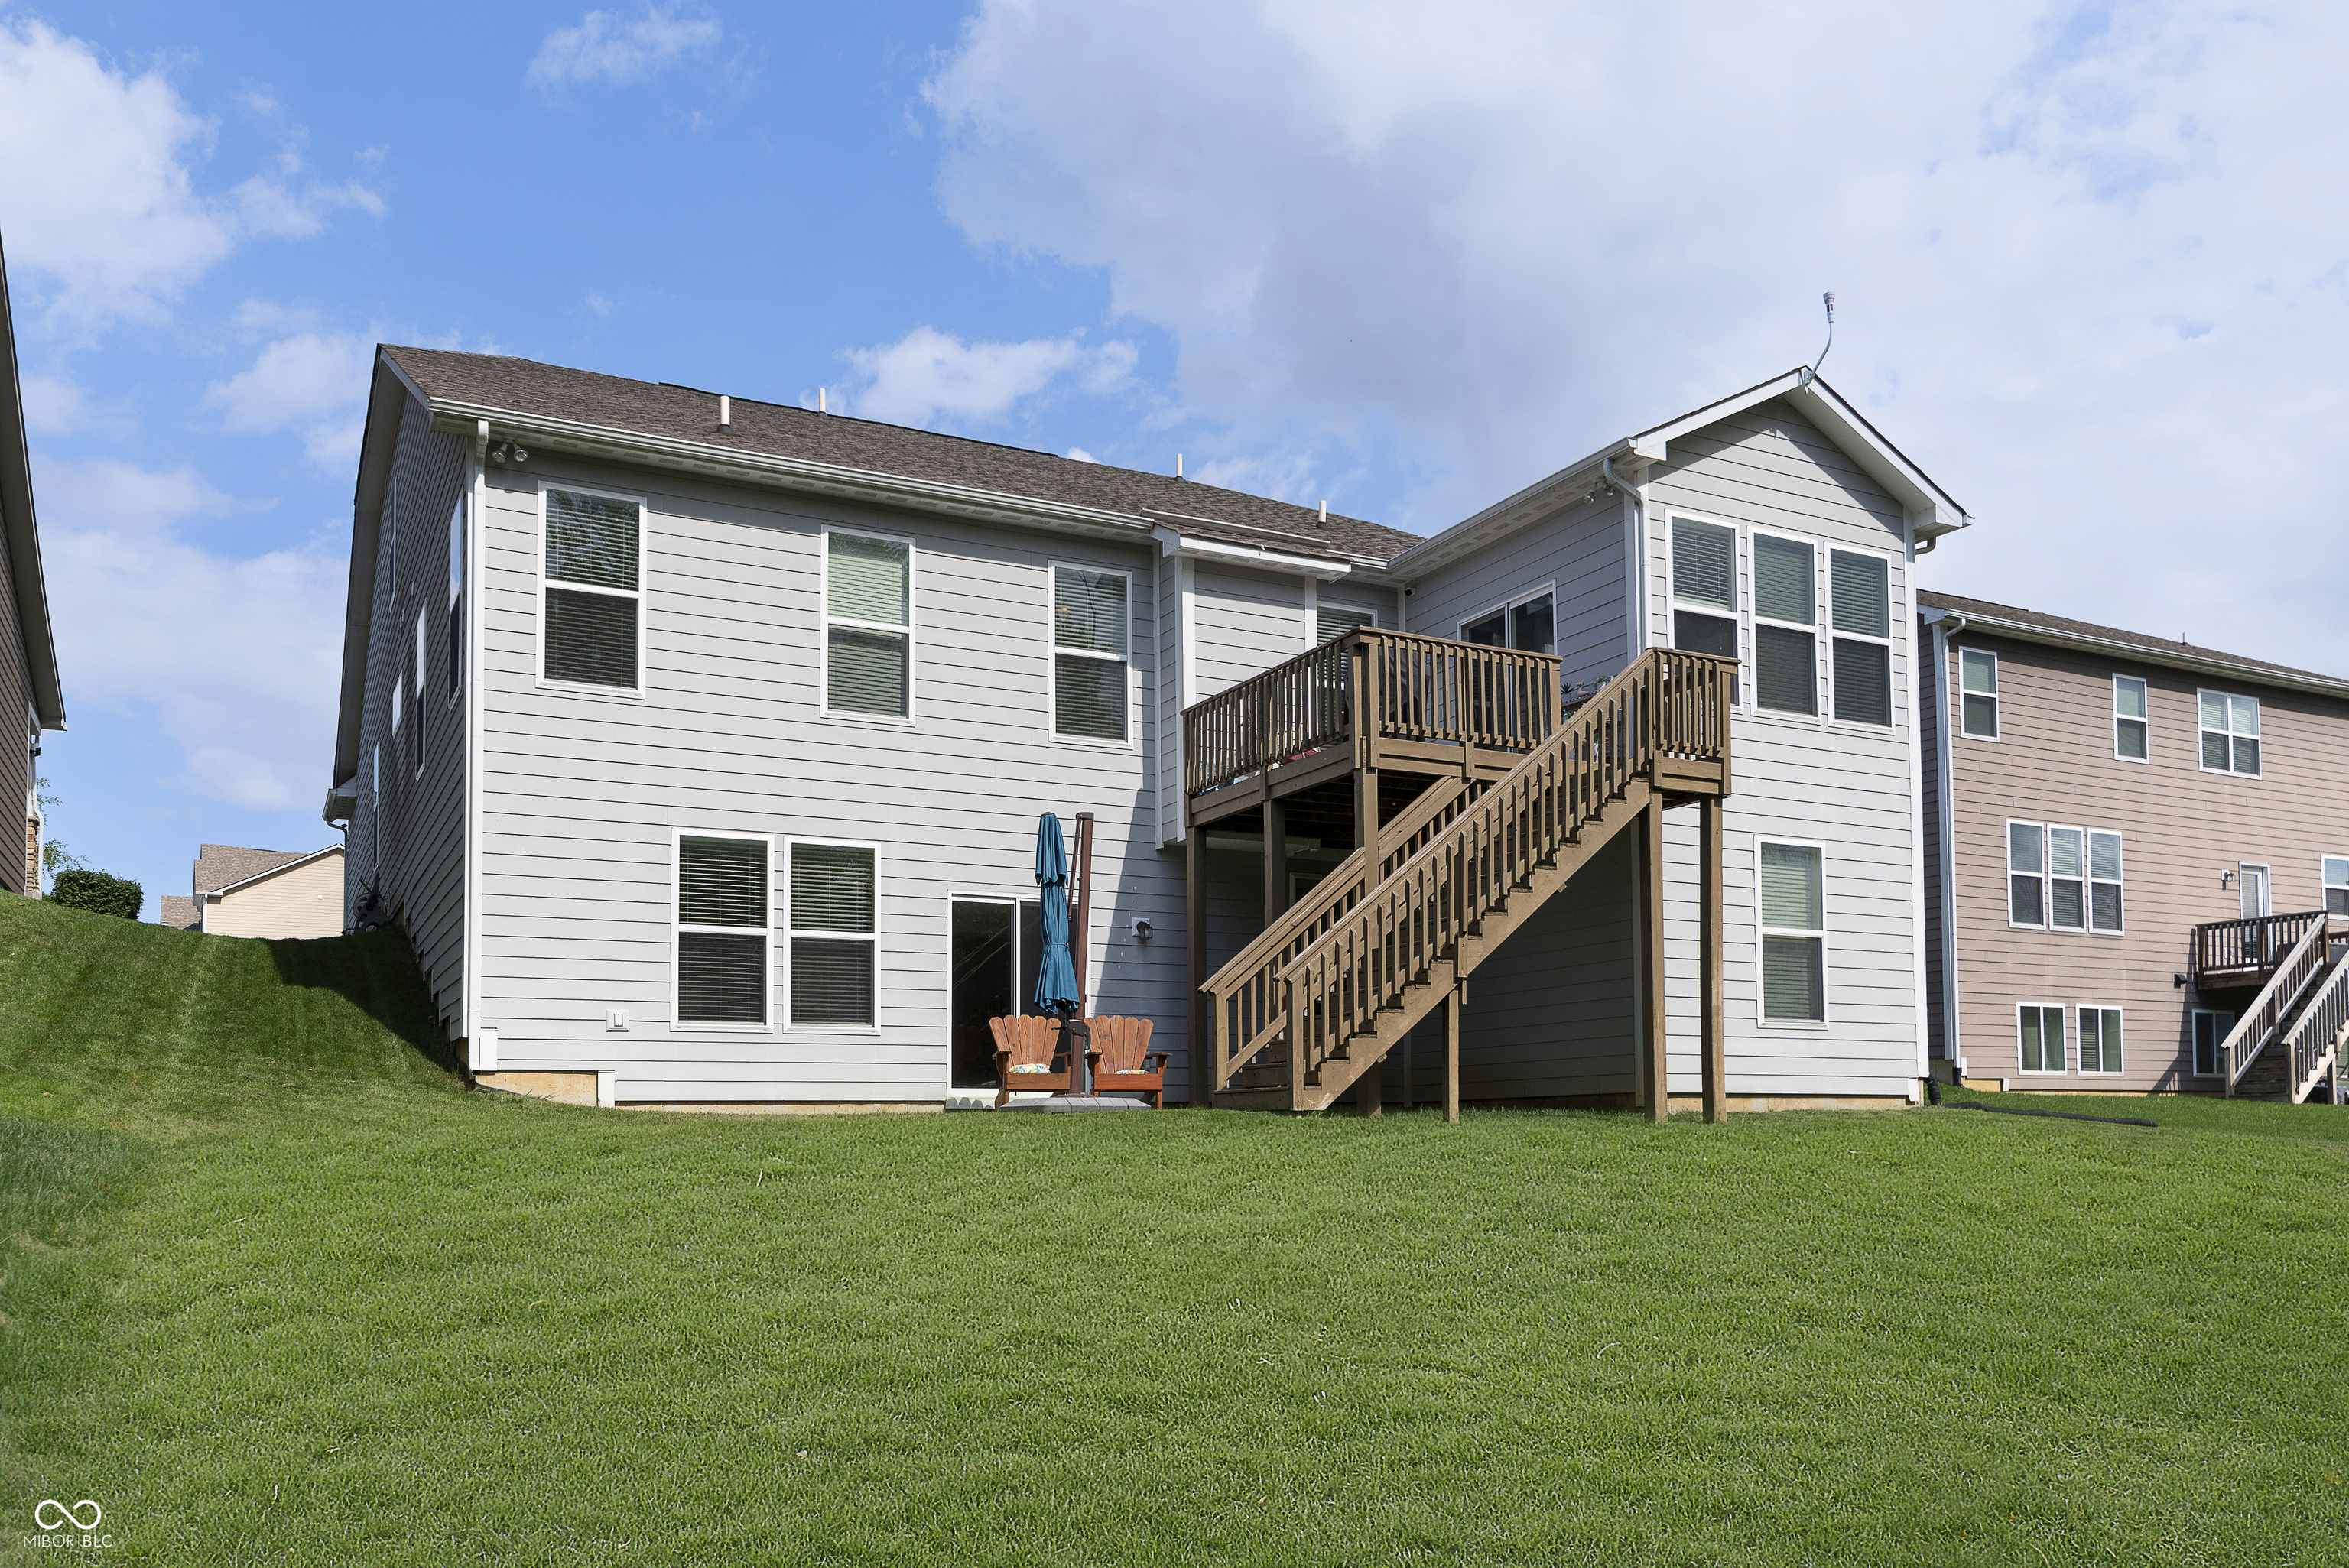
Active
$465,000
4
bds
|
3
ba
|
3,525
sqft
|
built
2020
1715 Foudray Cir S, Avon, IN 46123
$-539
Cash flow
-6.0%
Cash-on-Cash Return
4.9%
Cap rate
0.6%
Rent to Value Ratio
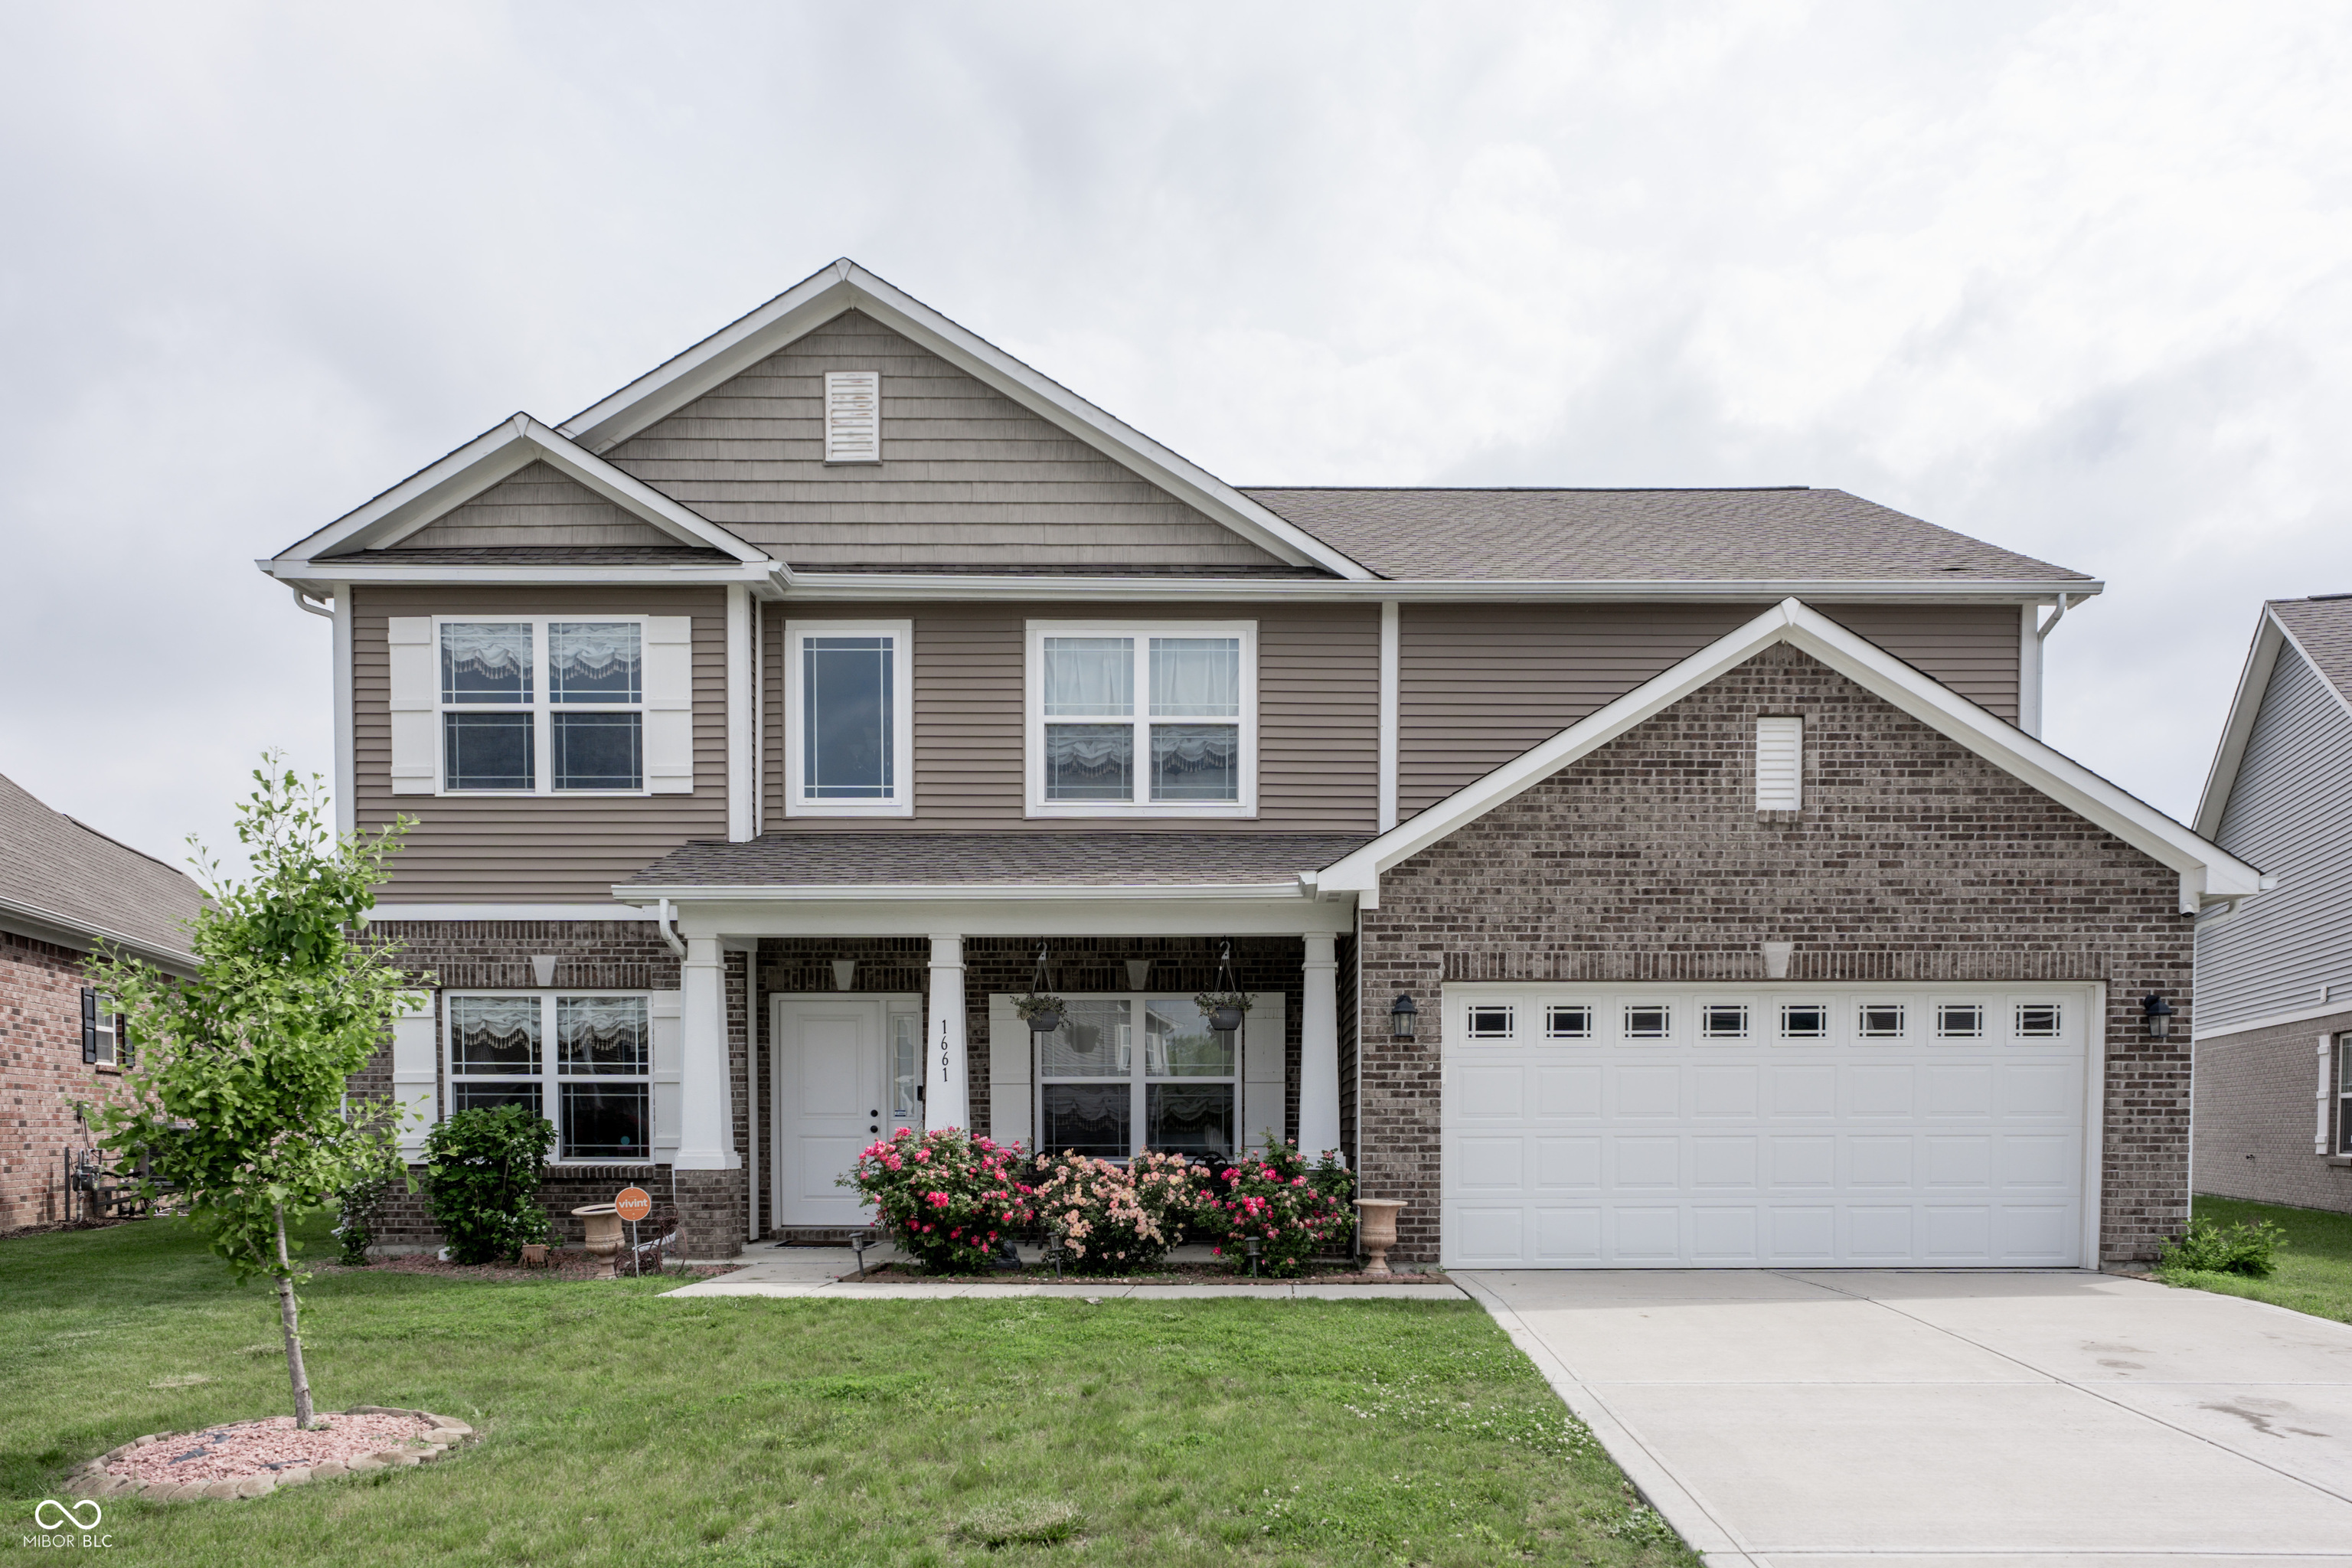
Active
$500,000
4
bds
|
3
ba
|
3,598
sqft
|
built
2018
1661 Devonshire Ave, Avon, IN 46123
$-722
Cash flow
-7.5%
Cash-on-Cash Return
4.6%
Cap rate
0.6%
Rent to Value Ratio
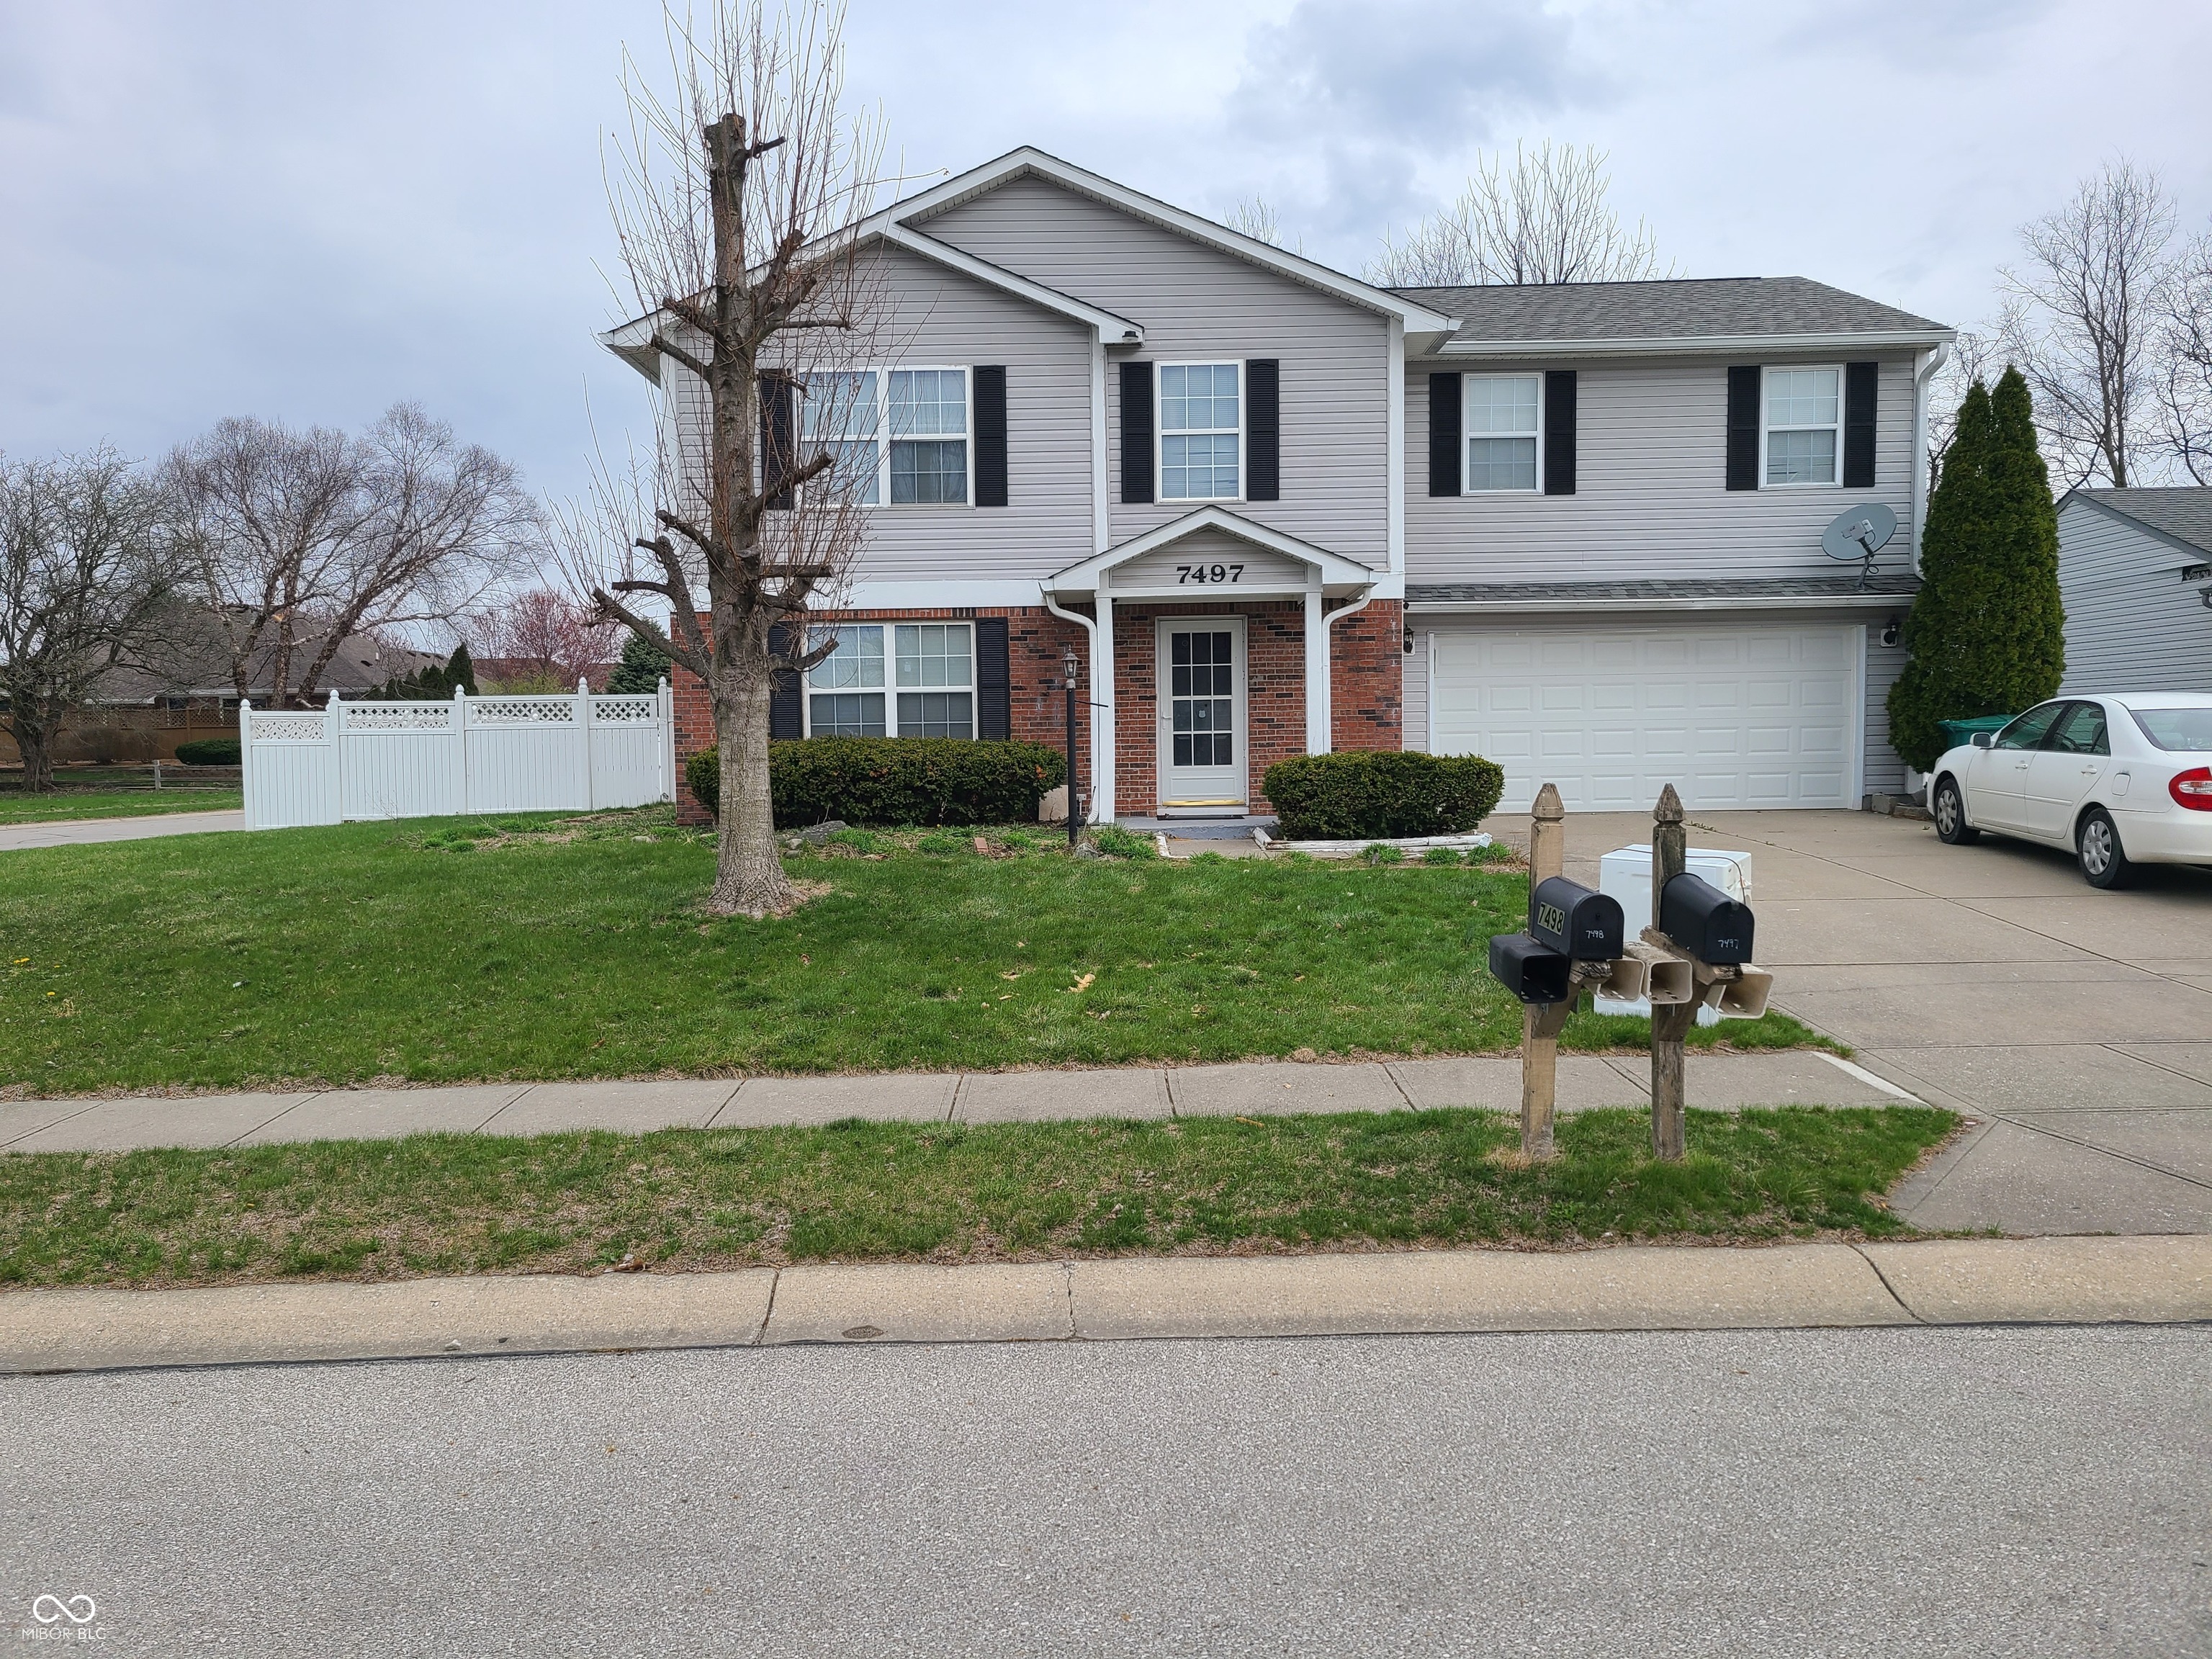
Active
$330,000
4
bds
|
4
ba
|
1,936
sqft
|
built
1997
7497 Grandview Dr, Avon, IN 46123
$-143
Cash flow
-2.3%
Cash-on-Cash Return
5.8%
Cap rate
0.7%
Rent to Value Ratio
Active
$385,000
2
bds
|
0
ba
|
0
sqft
|
built
1968
880 N Avon Ave, Avon, IN 46123
$-1,259
Cash flow
-17.1%
Cash-on-Cash Return
2.4%
Cap rate
0.3%
Rent to Value Ratio
Pending
$350,000
4
bds
|
3
ba
|
2,476
sqft
|
built
1991
6518 Springview Dr, Avon, IN 46123
$-110
Cash flow
-1.6%
Cash-on-Cash Return
5.9%
Cap rate
0.7%
Rent to Value Ratio

Active
$779,000
4
bds
|
5
ba
|
7,190
sqft
|
built
1998
6012 Yellow Birch Ct, Avon, IN 46123
$-1,265
Cash flow
-8.5%
Cash-on-Cash Return
4.3%
Cap rate
0.5%
Rent to Value Ratio
Active
$995,000
5
bds
|
4
ba
|
3,381
sqft
|
built
1989
4981 E County Road 200 S, Avon, IN 46123
$-2,801
Cash flow
-14.7%
Cash-on-Cash Return
2.9%
Cap rate
0.4%
Rent to Value Ratio
Active
$540,000
4
bds
|
4
ba
|
3,002
sqft
|
built
1991
5875 Annanhill Ct, Avon, IN 46123
$-378
Cash flow
-3.7%
Cash-on-Cash Return
5.5%
Cap rate
0.7%
Rent to Value Ratio
Active
$799,900
5
bds
|
5
ba
|
4,991
sqft
|
built
2014
621 Foxboro Dr, Avon, IN 46123
$-1,203
Cash flow
-7.8%
Cash-on-Cash Return
4.5%
Cap rate
0.6%
Rent to Value Ratio
Active
$289,900
3
bds
|
3
ba
|
1,708
sqft
|
built
2002
9664 Trail Dr, Avon, IN 46123
$-181
Cash flow
-3.3%
Cash-on-Cash Return
5.5%
Cap rate
0.7%
Rent to Value Ratio
Active
$399,900
5
bds
|
3
ba
|
3,118
sqft
|
built
2002
9949 Nightsong Ln, Avon, IN 46123
$-412
Cash flow
-5.4%
Cash-on-Cash Return
5.1%
Cap rate
0.6%
Rent to Value Ratio
Active
$324,900
4
bds
|
3
ba
|
2,013
sqft
|
built
1980
5325 Ridge Hill Way, Avon, IN 46123
$-210
Cash flow
-3.4%
Cash-on-Cash Return
5.5%
Cap rate
0.7%
Rent to Value Ratio
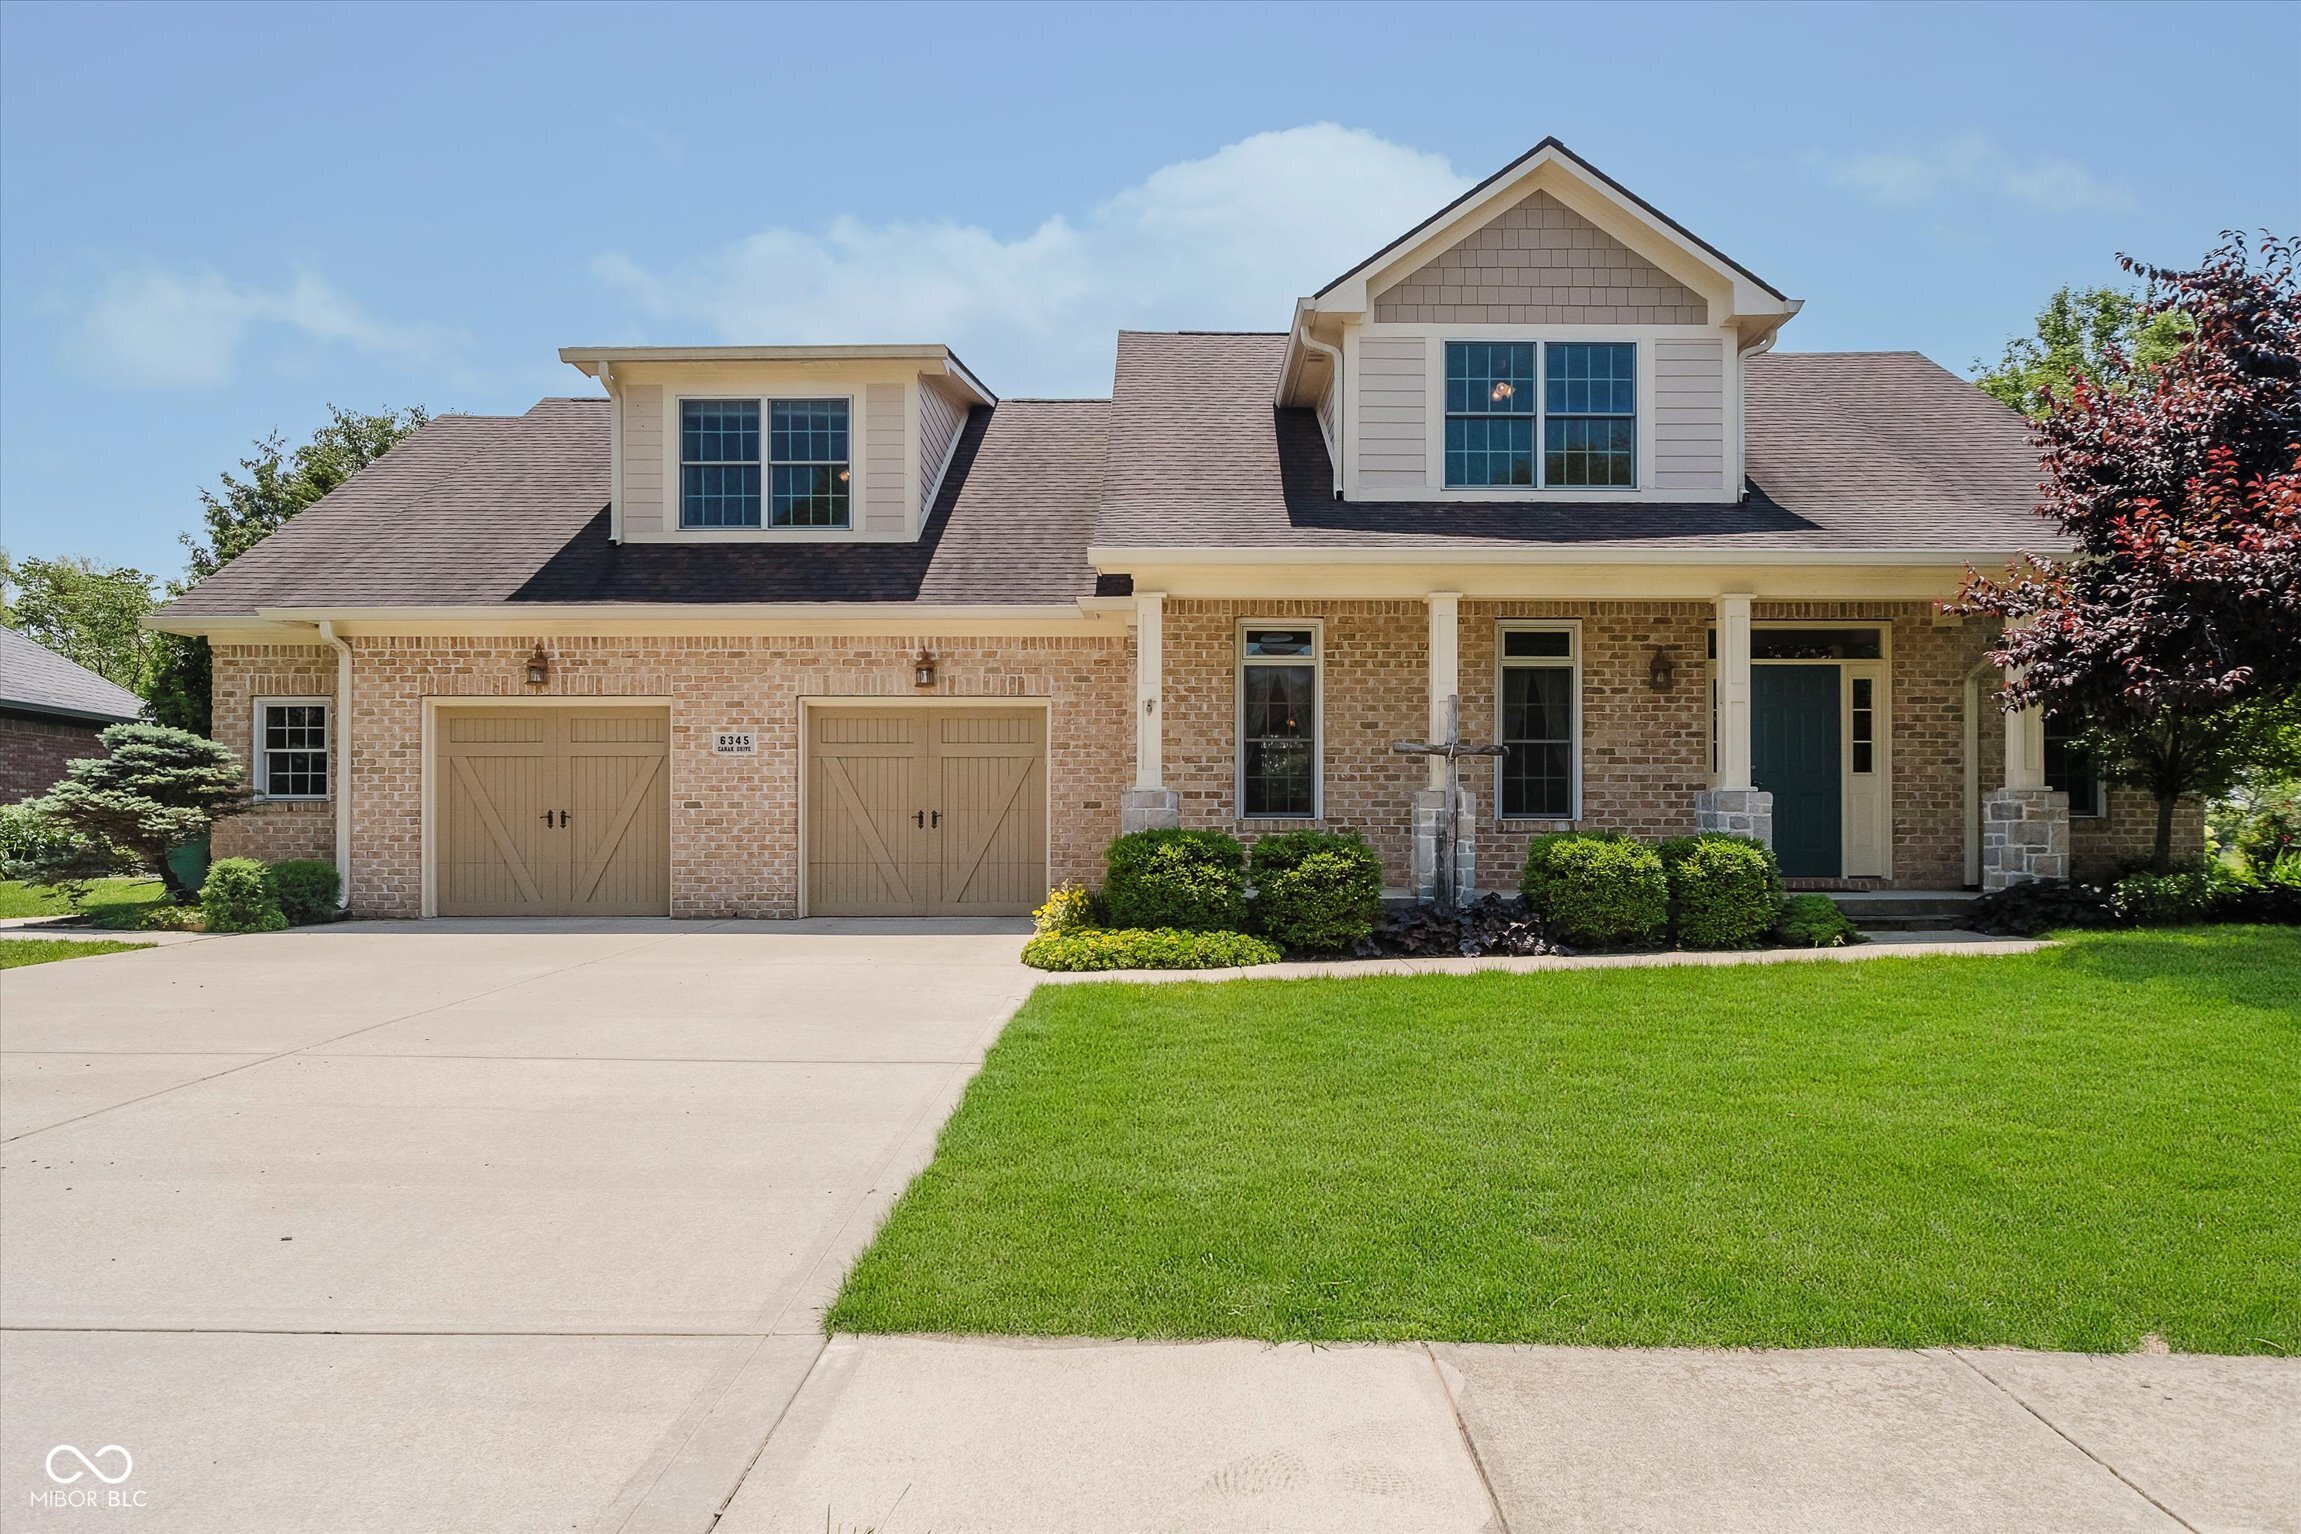
Active
$475,000
4
bds
|
3
ba
|
3,935
sqft
|
built
2004
6345 Canak Dr, Avon, IN 46123
$-382
Cash flow
-4.2%
Cash-on-Cash Return
5.3%
Cap rate
0.7%
Rent to Value Ratio
Active
$459,000
5
bds
|
3
ba
|
3,395
sqft
|
built
2020
9207 Foudray Cir N, Avon, IN 46123
$-507
Cash flow
-5.8%
Cash-on-Cash Return
5.0%
Cap rate
0.6%
Rent to Value Ratio
Active
$379,900
4
bds
|
2
ba
|
2,161
sqft
|
built
1935
2068 S Avon Ave, Avon, IN 46123
$-197
Cash flow
-2.7%
Cash-on-Cash Return
5.7%
Cap rate
0.7%
Rent to Value Ratio

Active
$194,900
3
bds
|
3
ba
|
1,775
sqft
|
built
1974
741 Ironwood Dr, Avon, IN 46123
$-121
Cash flow
-3.2%
Cash-on-Cash Return
5.5%
Cap rate
0.9%
Rent to Value Ratio
Active
$410,000
4
bds
|
3
ba
|
3,776
sqft
|
built
2004
8358 Balmoral Ln, Avon, IN 46123
$-342
Cash flow
-4.4%
Cash-on-Cash Return
5.3%
Cap rate
0.7%
Rent to Value Ratio
Active
$424,000
4
bds
|
3
ba
|
3,844
sqft
|
built
1994
6396 Granny Smith Ln, Avon, IN 46123
$-477
Cash flow
-5.9%
Cash-on-Cash Return
4.9%
Cap rate
0.6%
Rent to Value Ratio
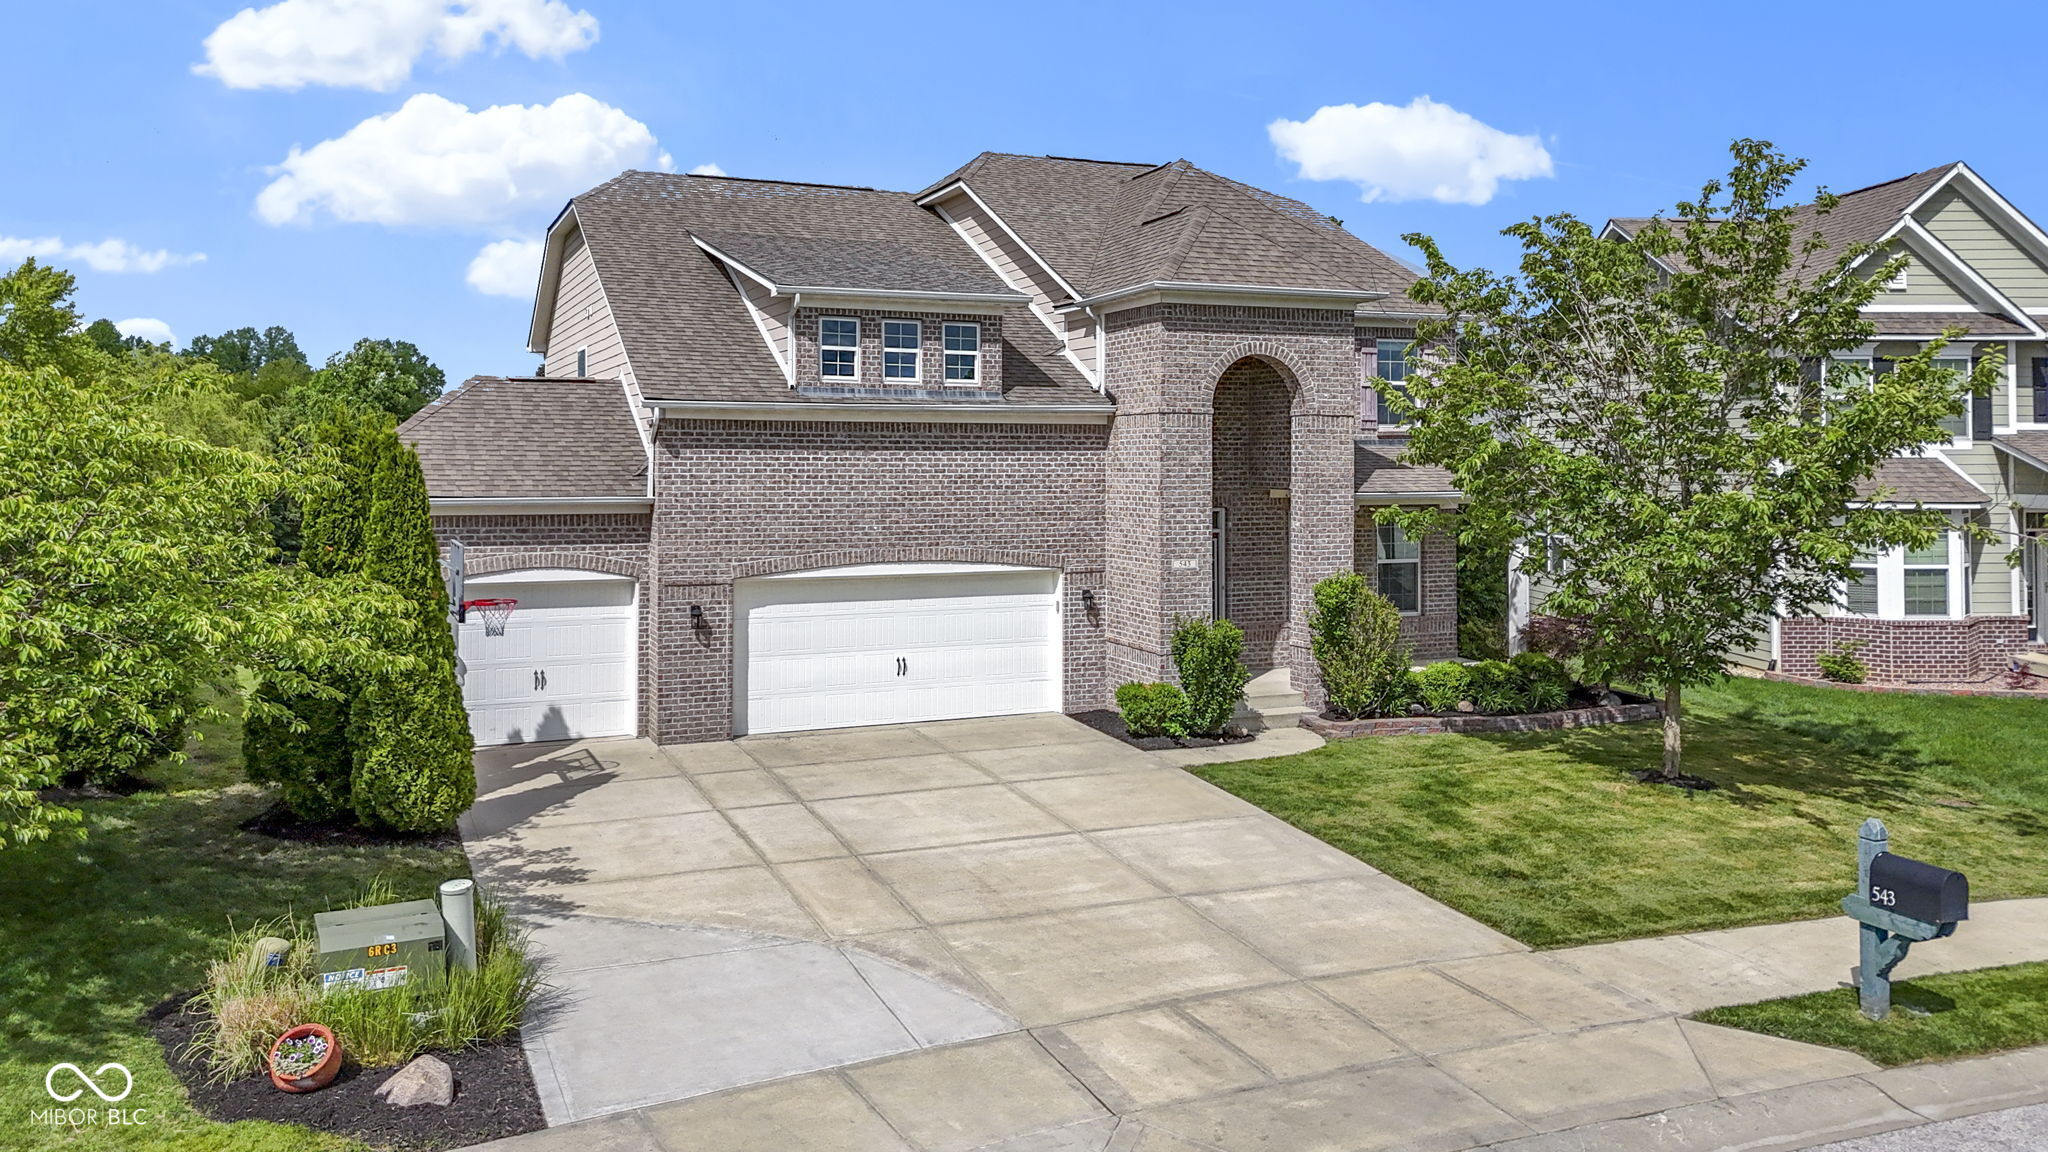
Active
$585,000
5
bds
|
4
ba
|
5,230
sqft
|
built
2014
543 Amersham Ct, Avon, IN 46123
$-422
Cash flow
-3.8%
Cash-on-Cash Return
5.4%
Cap rate
0.7%
Rent to Value Ratio

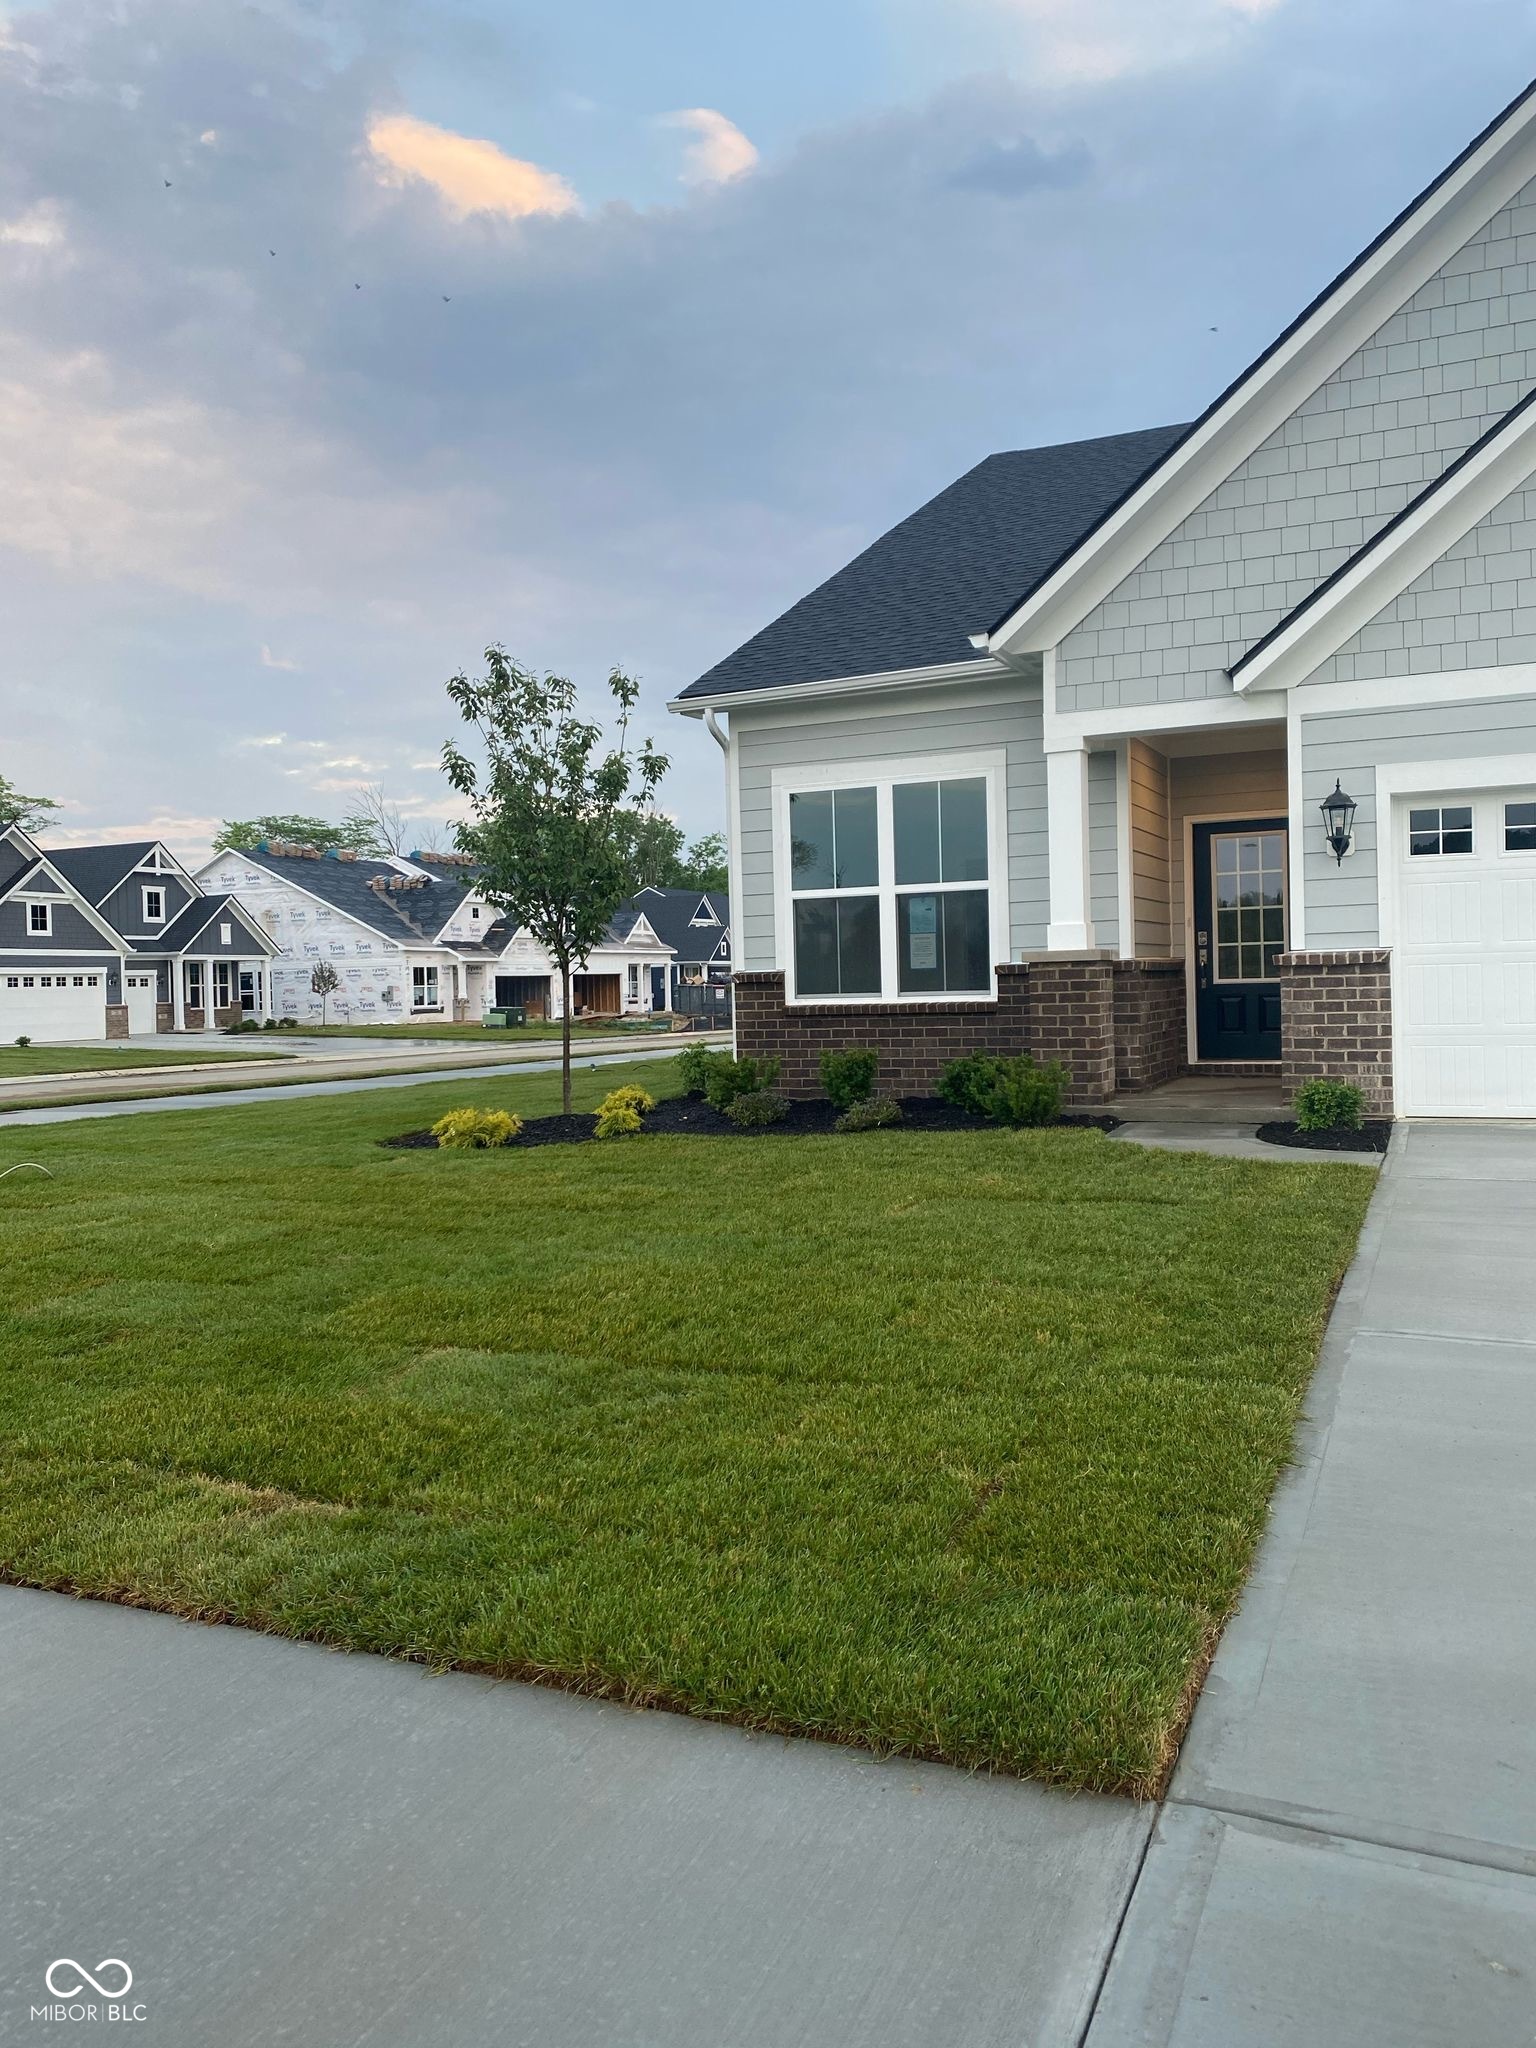
Active
$280,000
3
bds
|
3
ba
|
1,846
sqft
|
built
2022
9570 Beckett St, Avon, IN 46123
$-133
Cash flow
-2.5%
Cash-on-Cash Return
5.7%
Cap rate
0.8%
Rent to Value Ratio
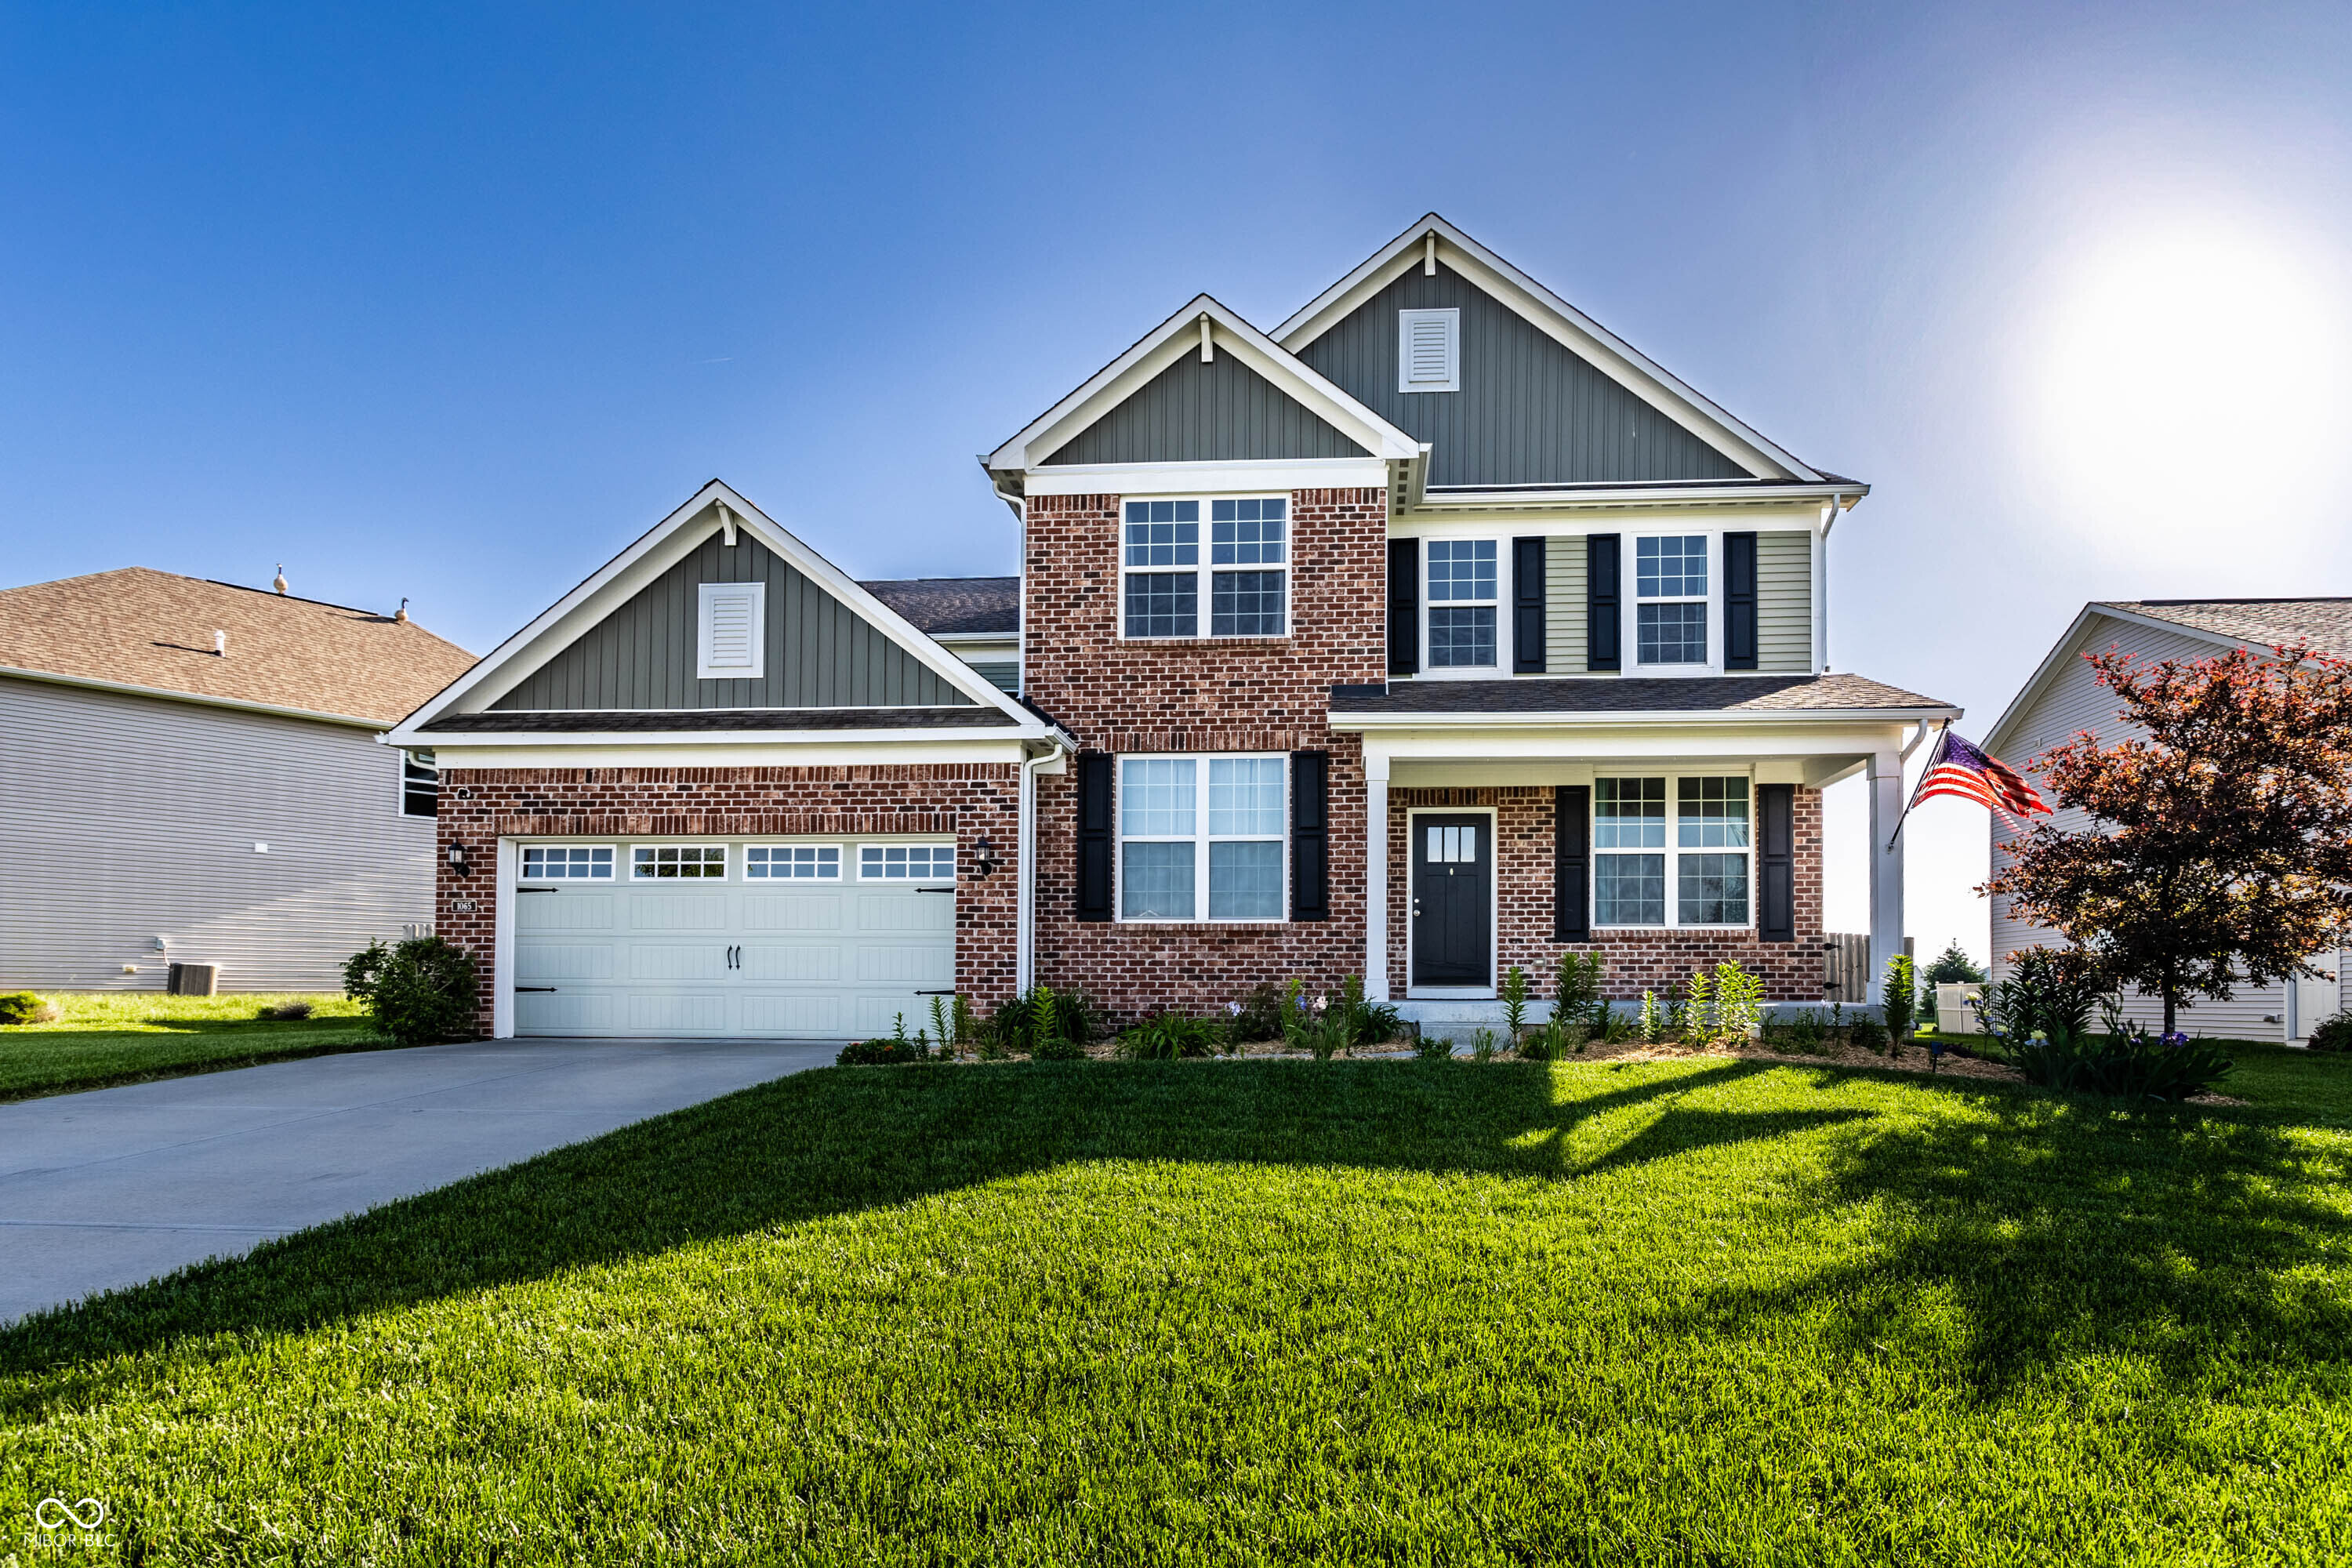
Active
$525,000
4
bds
|
3
ba
|
4,082
sqft
|
built
2018
1065 Park Ct, Avon, IN 46123
$-666
Cash flow
-6.6%
Cash-on-Cash Return
4.8%
Cap rate
0.6%
Rent to Value Ratio
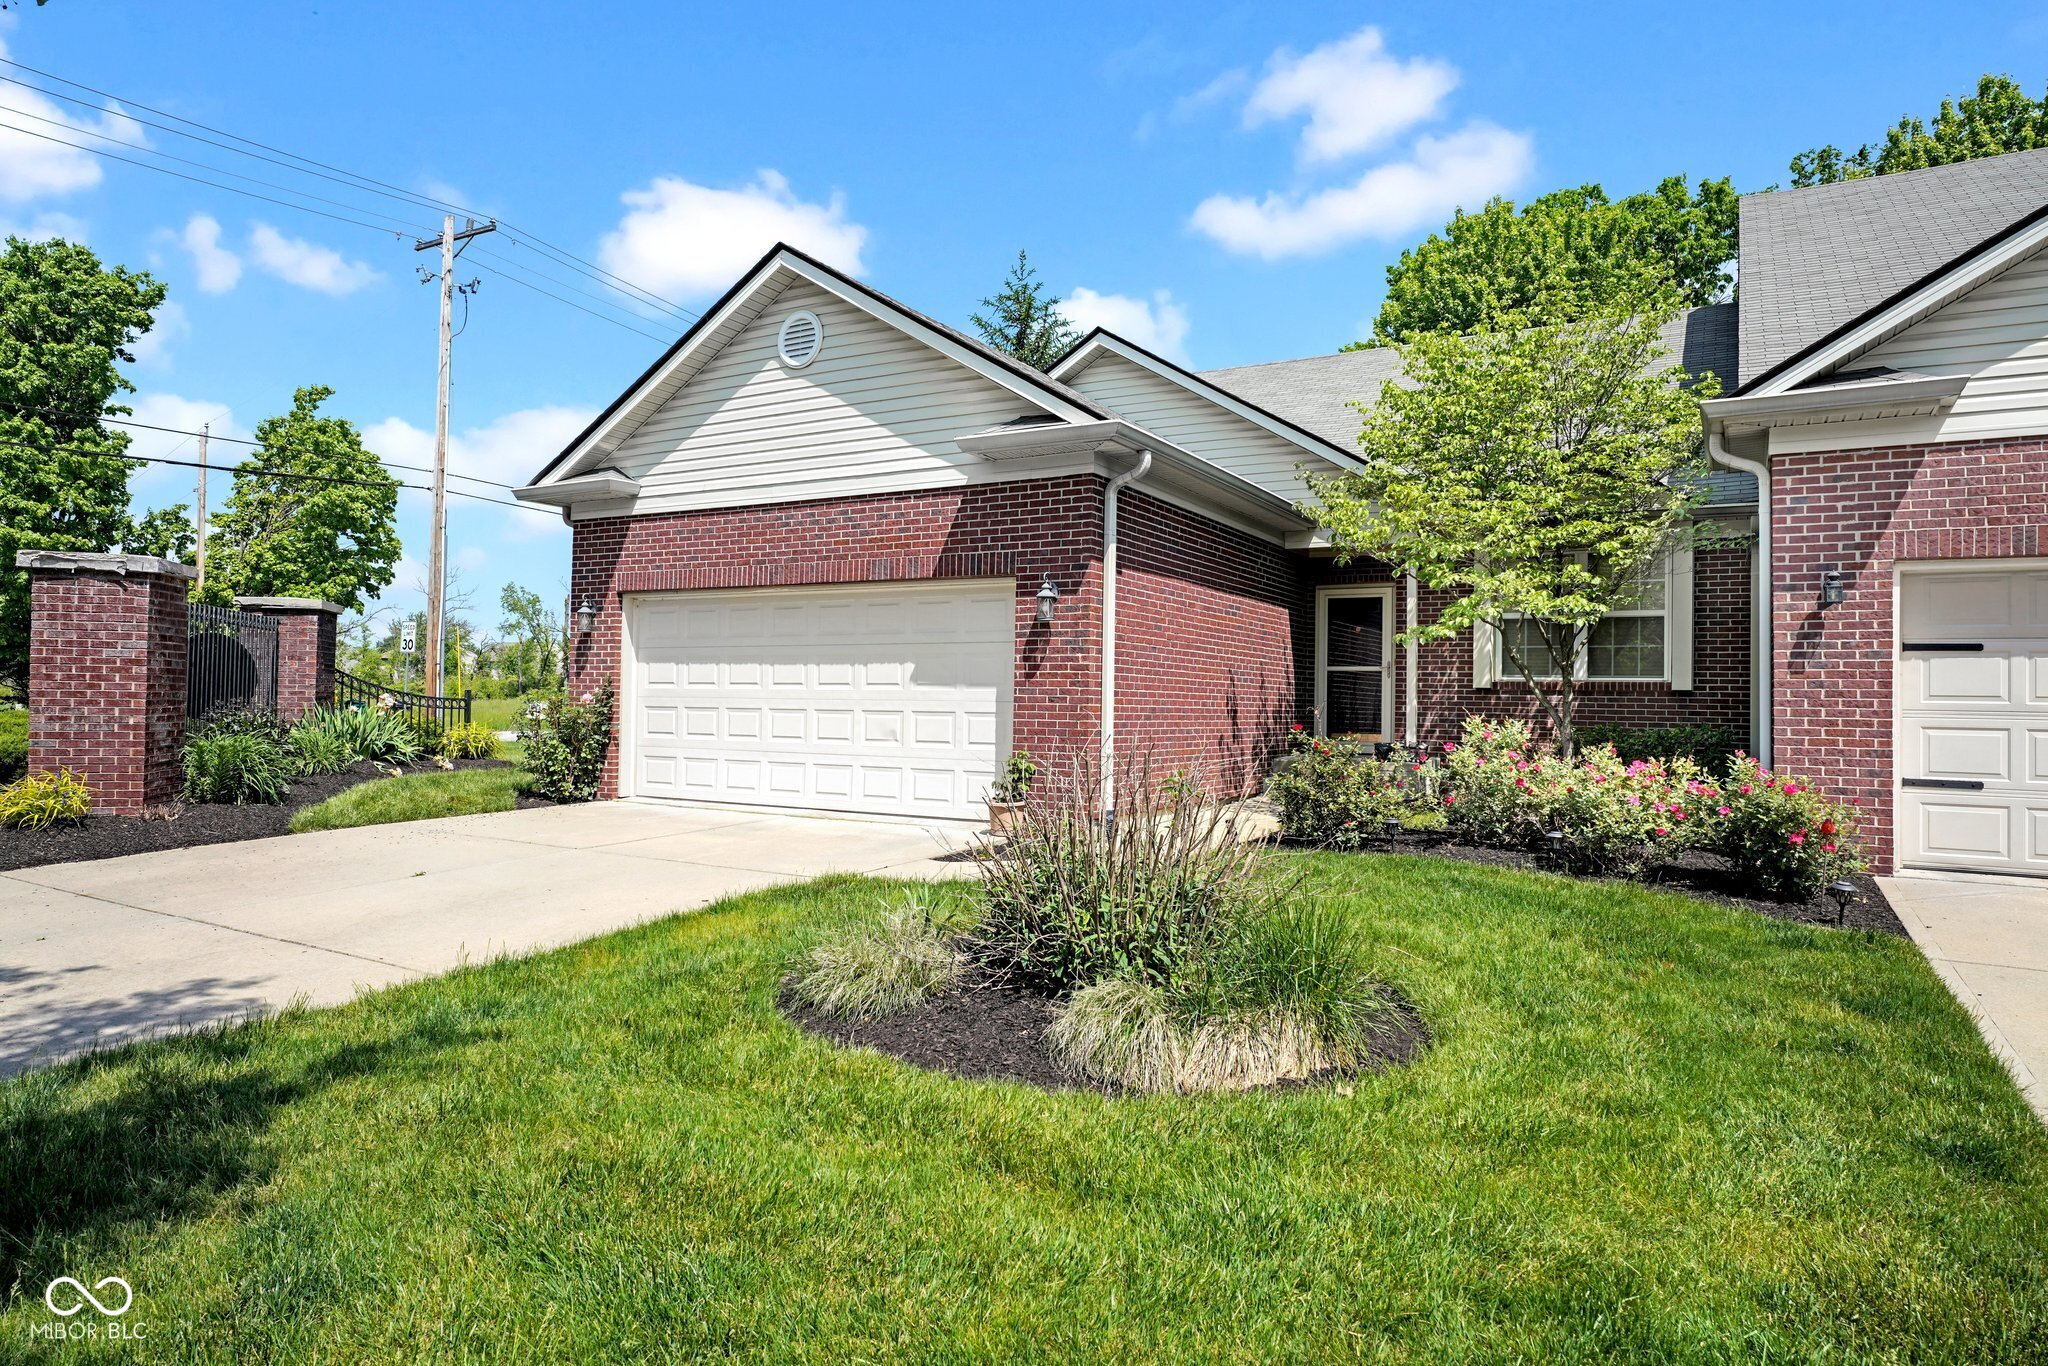
Active
$320,000
3
bds
|
3
ba
|
3,250
sqft
|
built
2008
575 Dylan Dr, Avon, IN 46123
$-254
Cash flow
-4.1%
Cash-on-Cash Return
5.3%
Cap rate
0.7%
Rent to Value Ratio
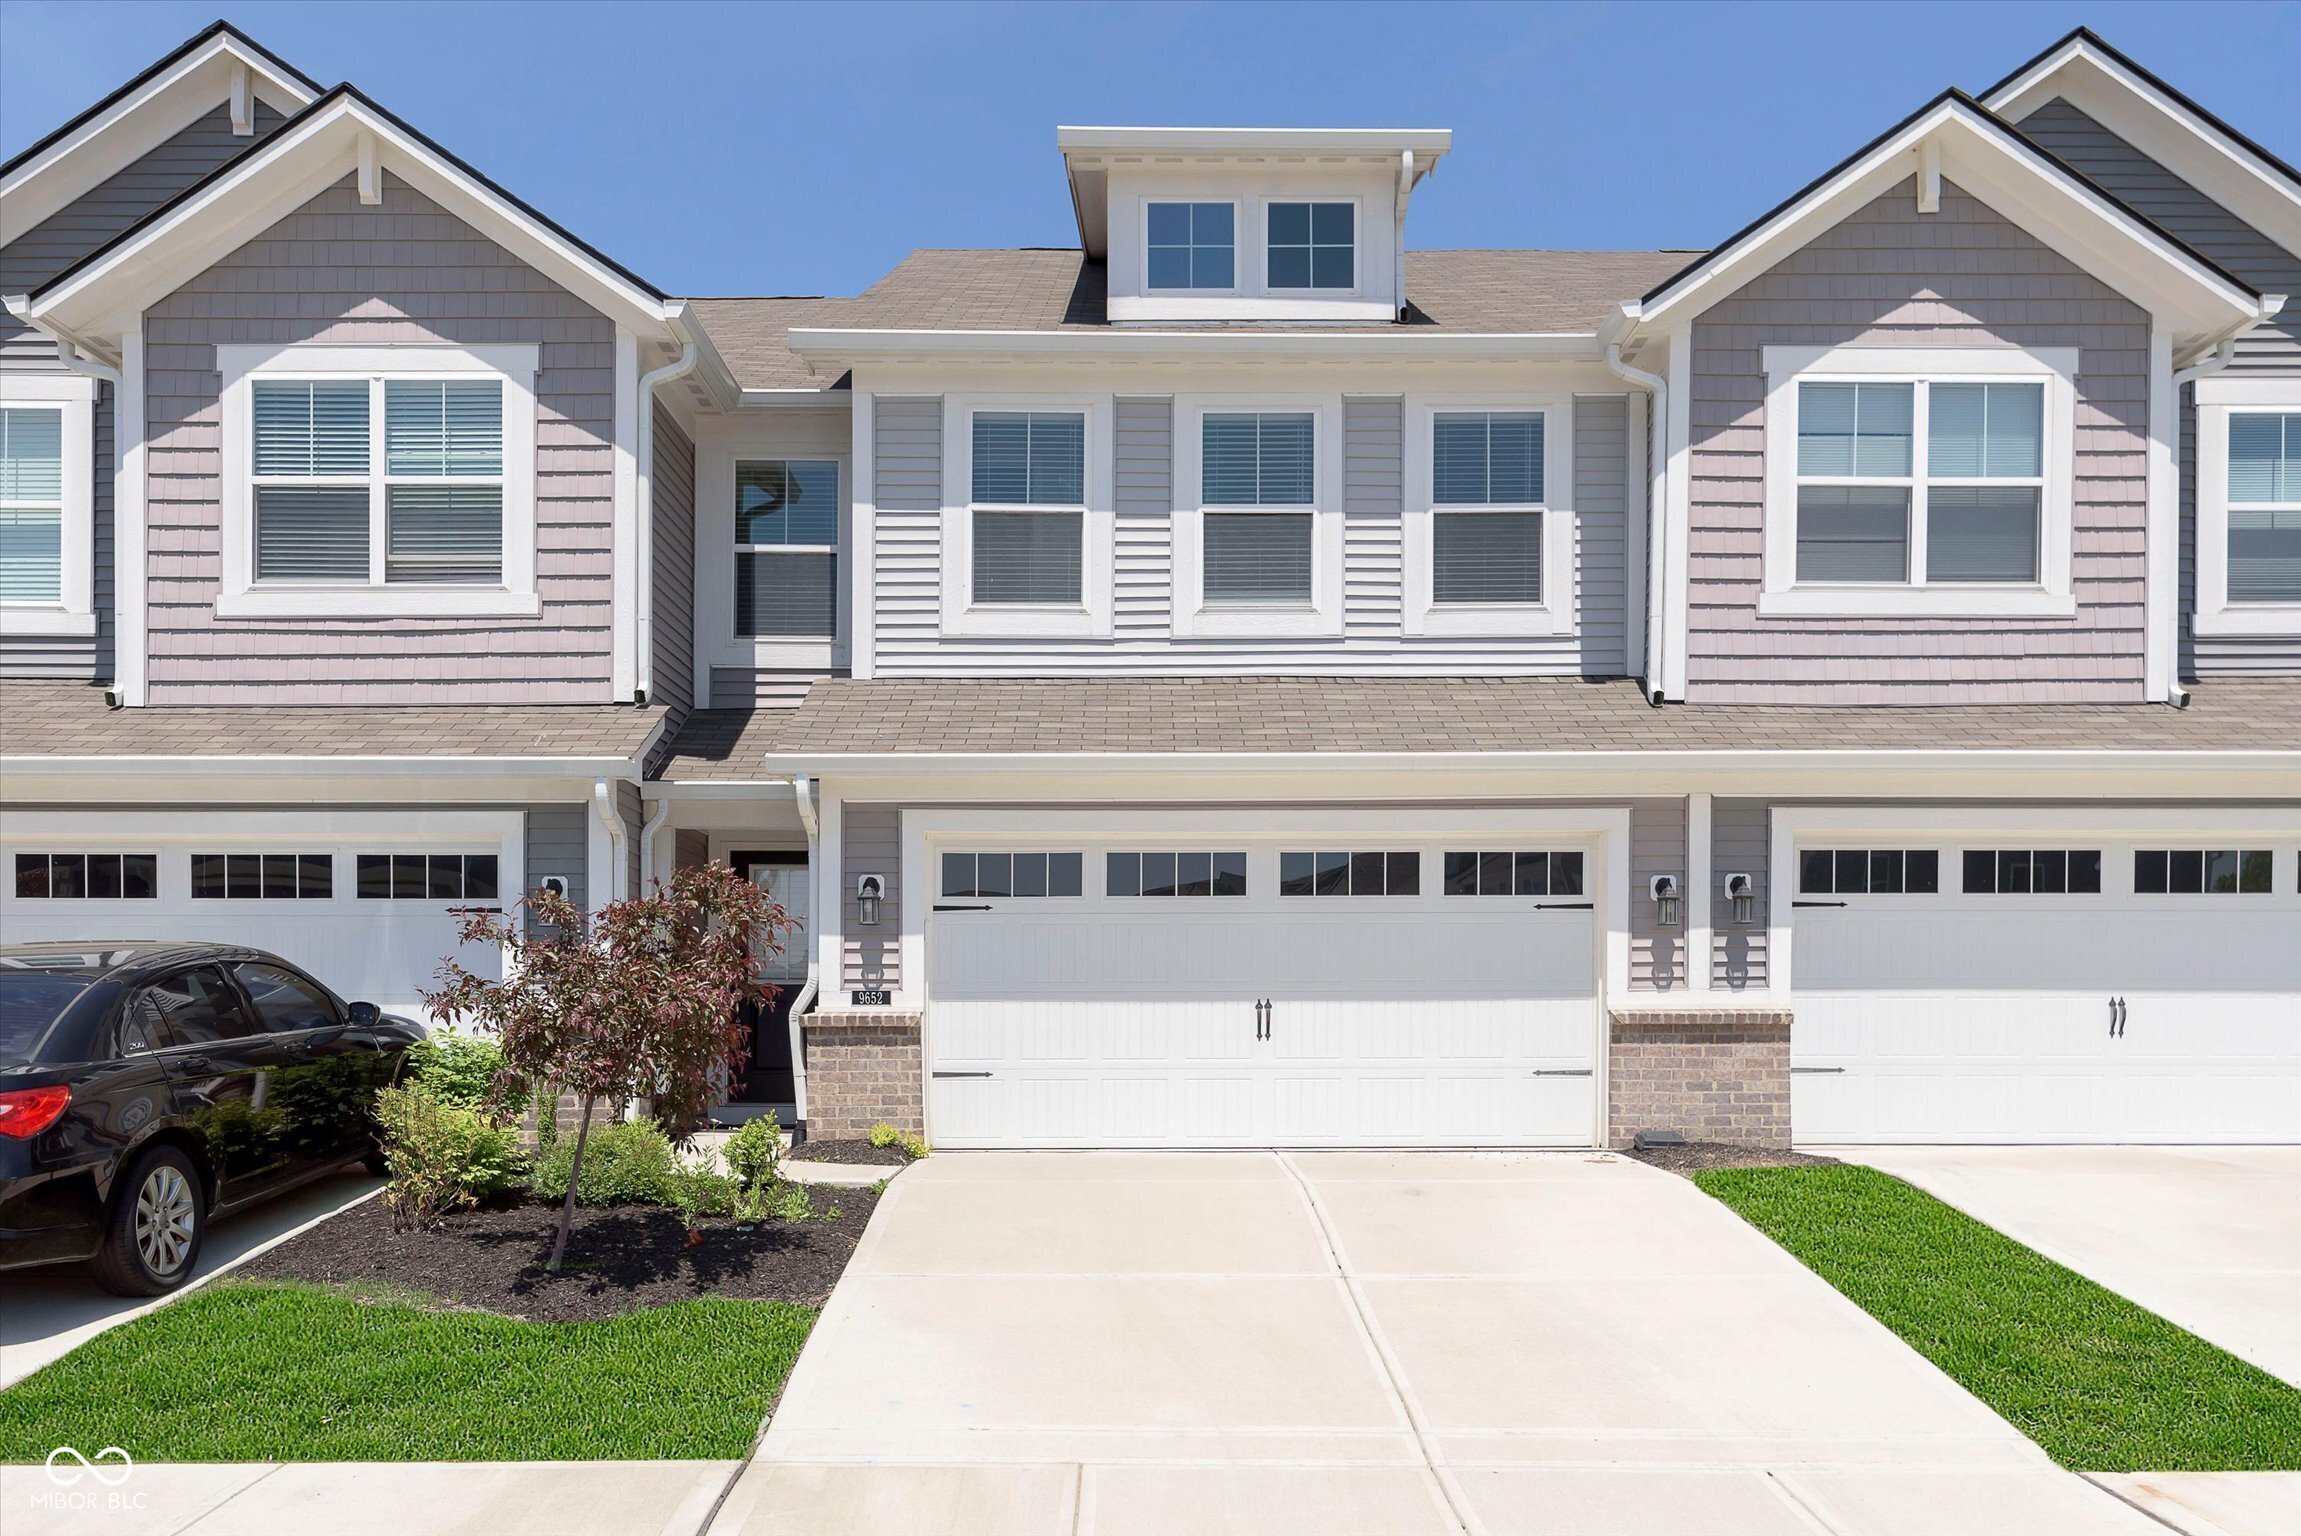
Active
$280,000
3
bds
|
3
ba
|
1,846
sqft
|
built
2022
9652 Beckett St, Avon, IN 46123
$-133
Cash flow
-2.5%
Cash-on-Cash Return
5.7%
Cap rate
0.8%
Rent to Value Ratio
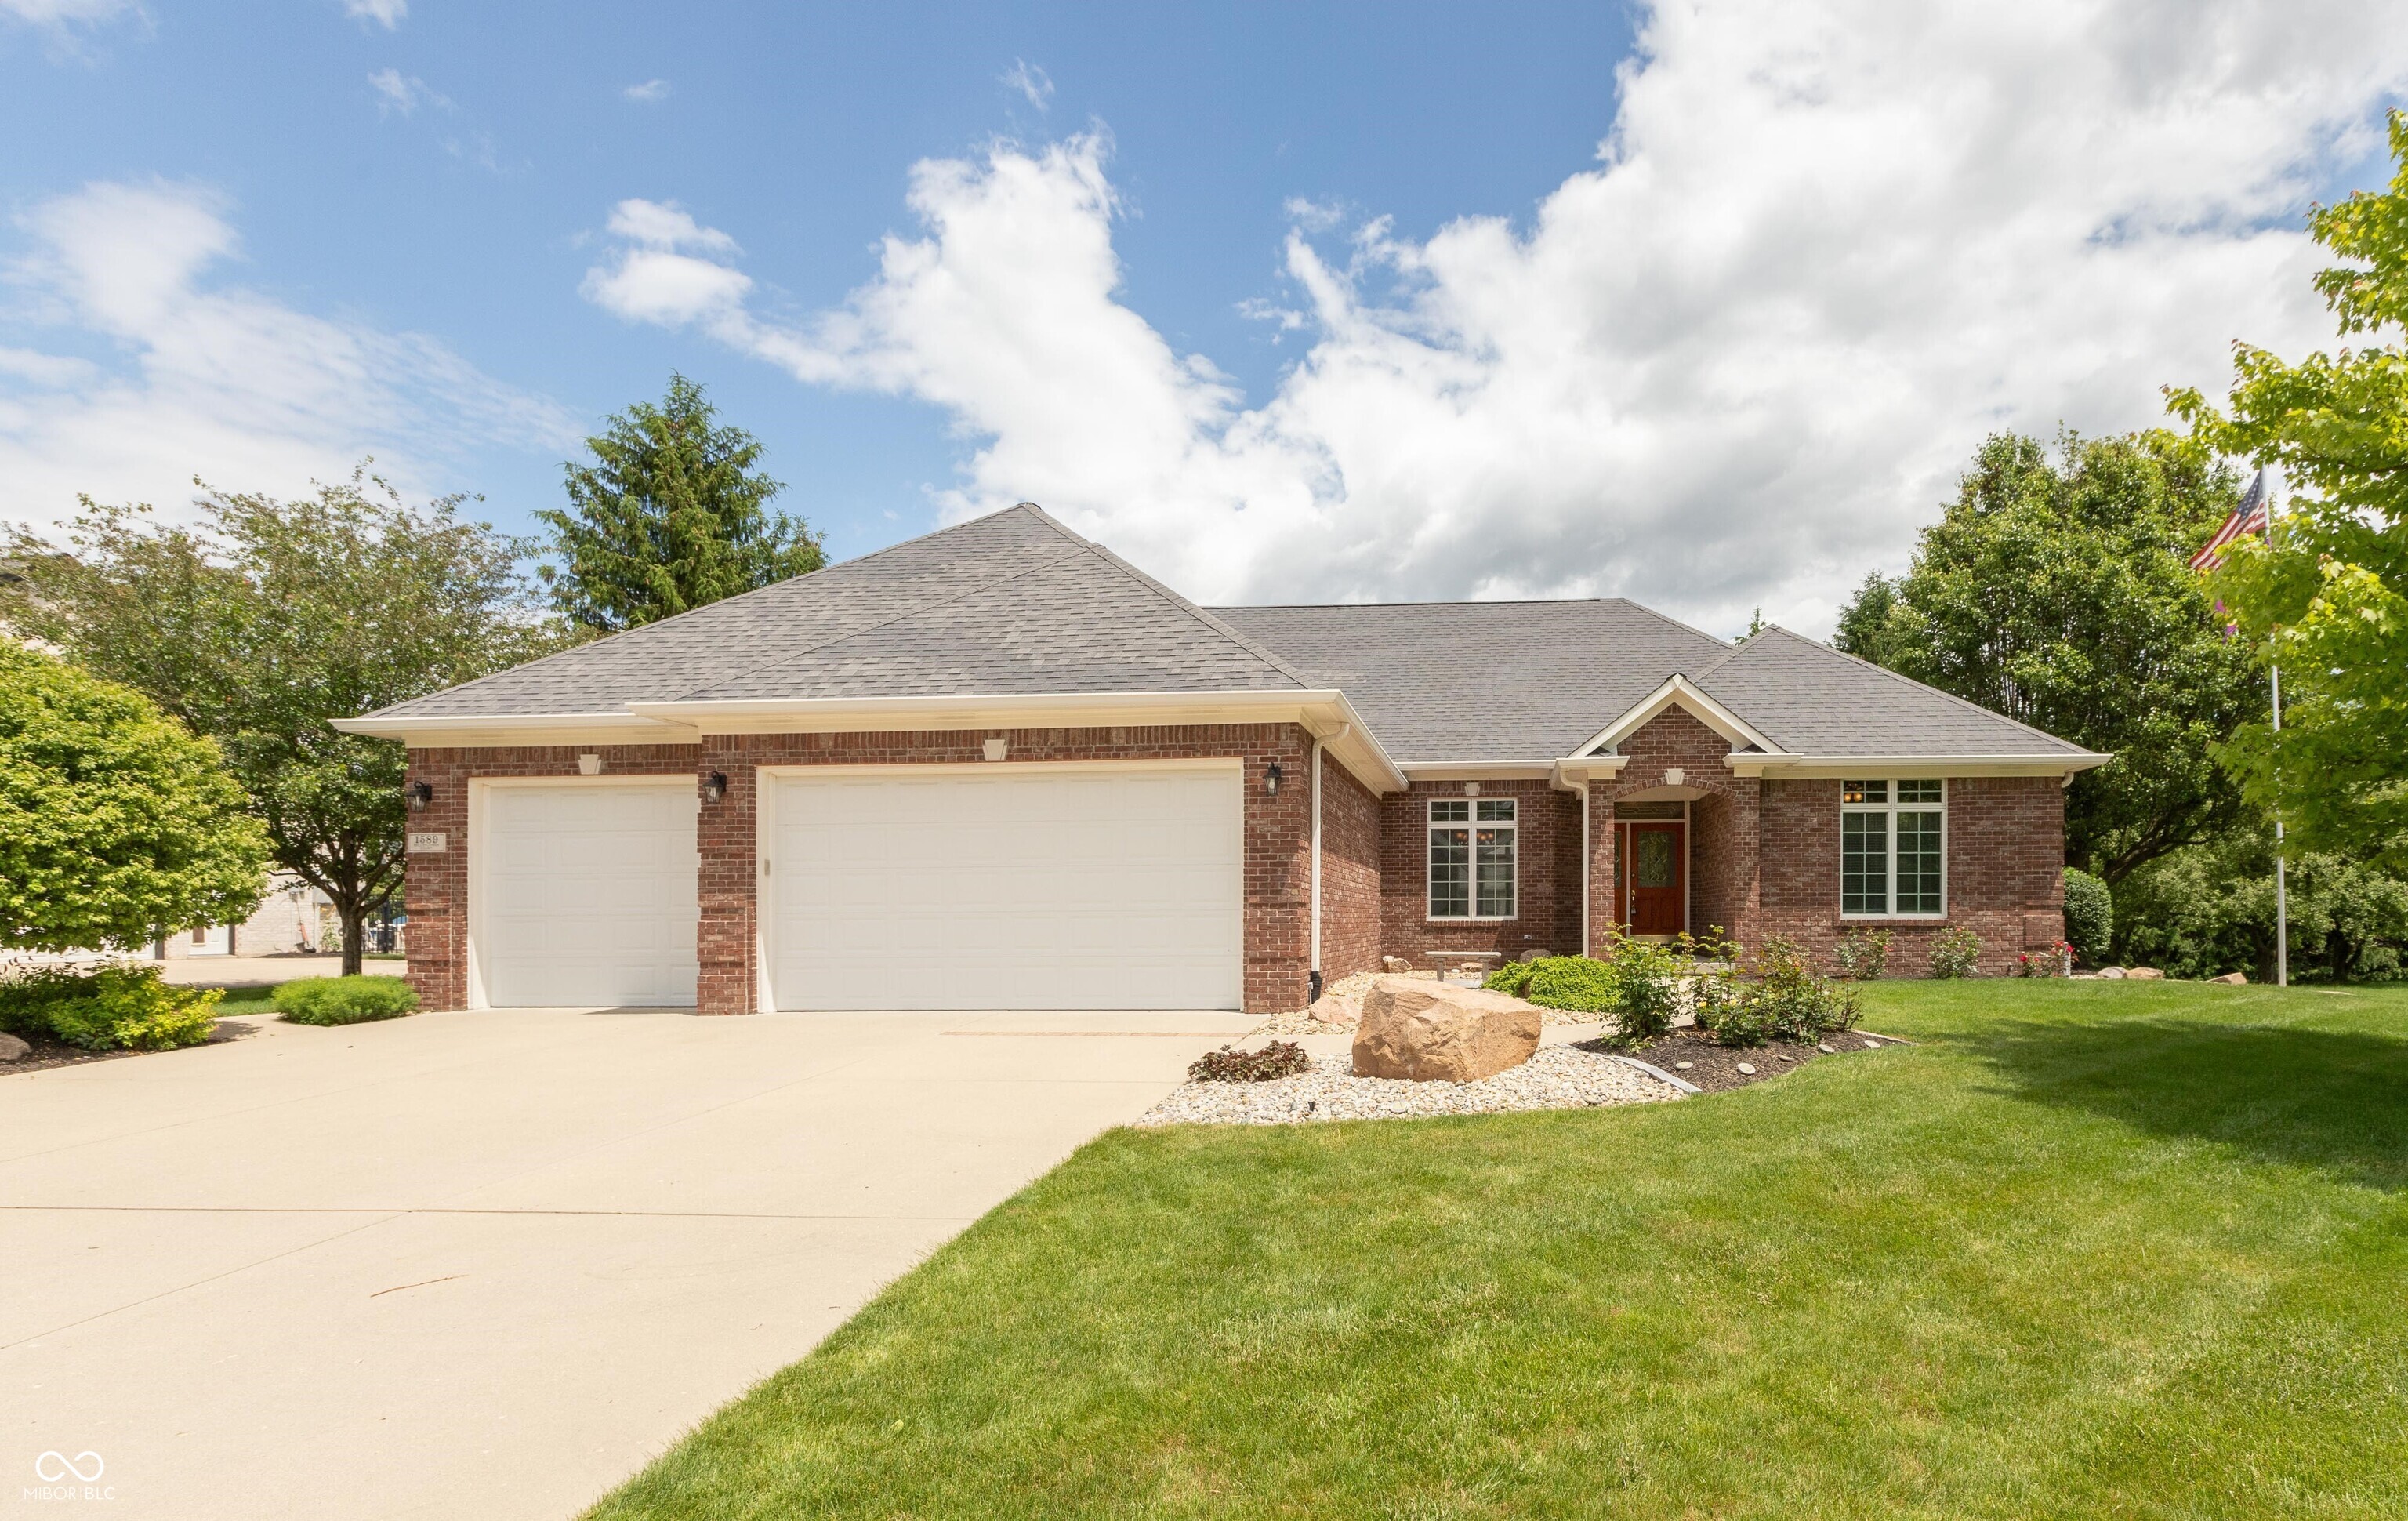
Active
$525,000
3
bds
|
3
ba
|
2,404
sqft
|
built
1999
1589 Belleflower Ct, Avon, IN 46123
$-571
Cash flow
-5.7%
Cash-on-Cash Return
5.0%
Cap rate
0.6%
Rent to Value Ratio
Active
$365,000
3
bds
|
2
ba
|
2,857
sqft
|
built
1996
7970 Cobblesprings Dr, Avon, IN 46123
$-226
Cash flow
-3.2%
Cash-on-Cash Return
5.5%
Cap rate
0.7%
Rent to Value Ratio

Active
$385,000
3
bds
|
2
ba
|
2,417
sqft
|
built
2014
1893 Devonshire Ave, Avon, IN 46123
$-395
Cash flow
-5.4%
Cash-on-Cash Return
5.1%
Cap rate
0.6%
Rent to Value Ratio
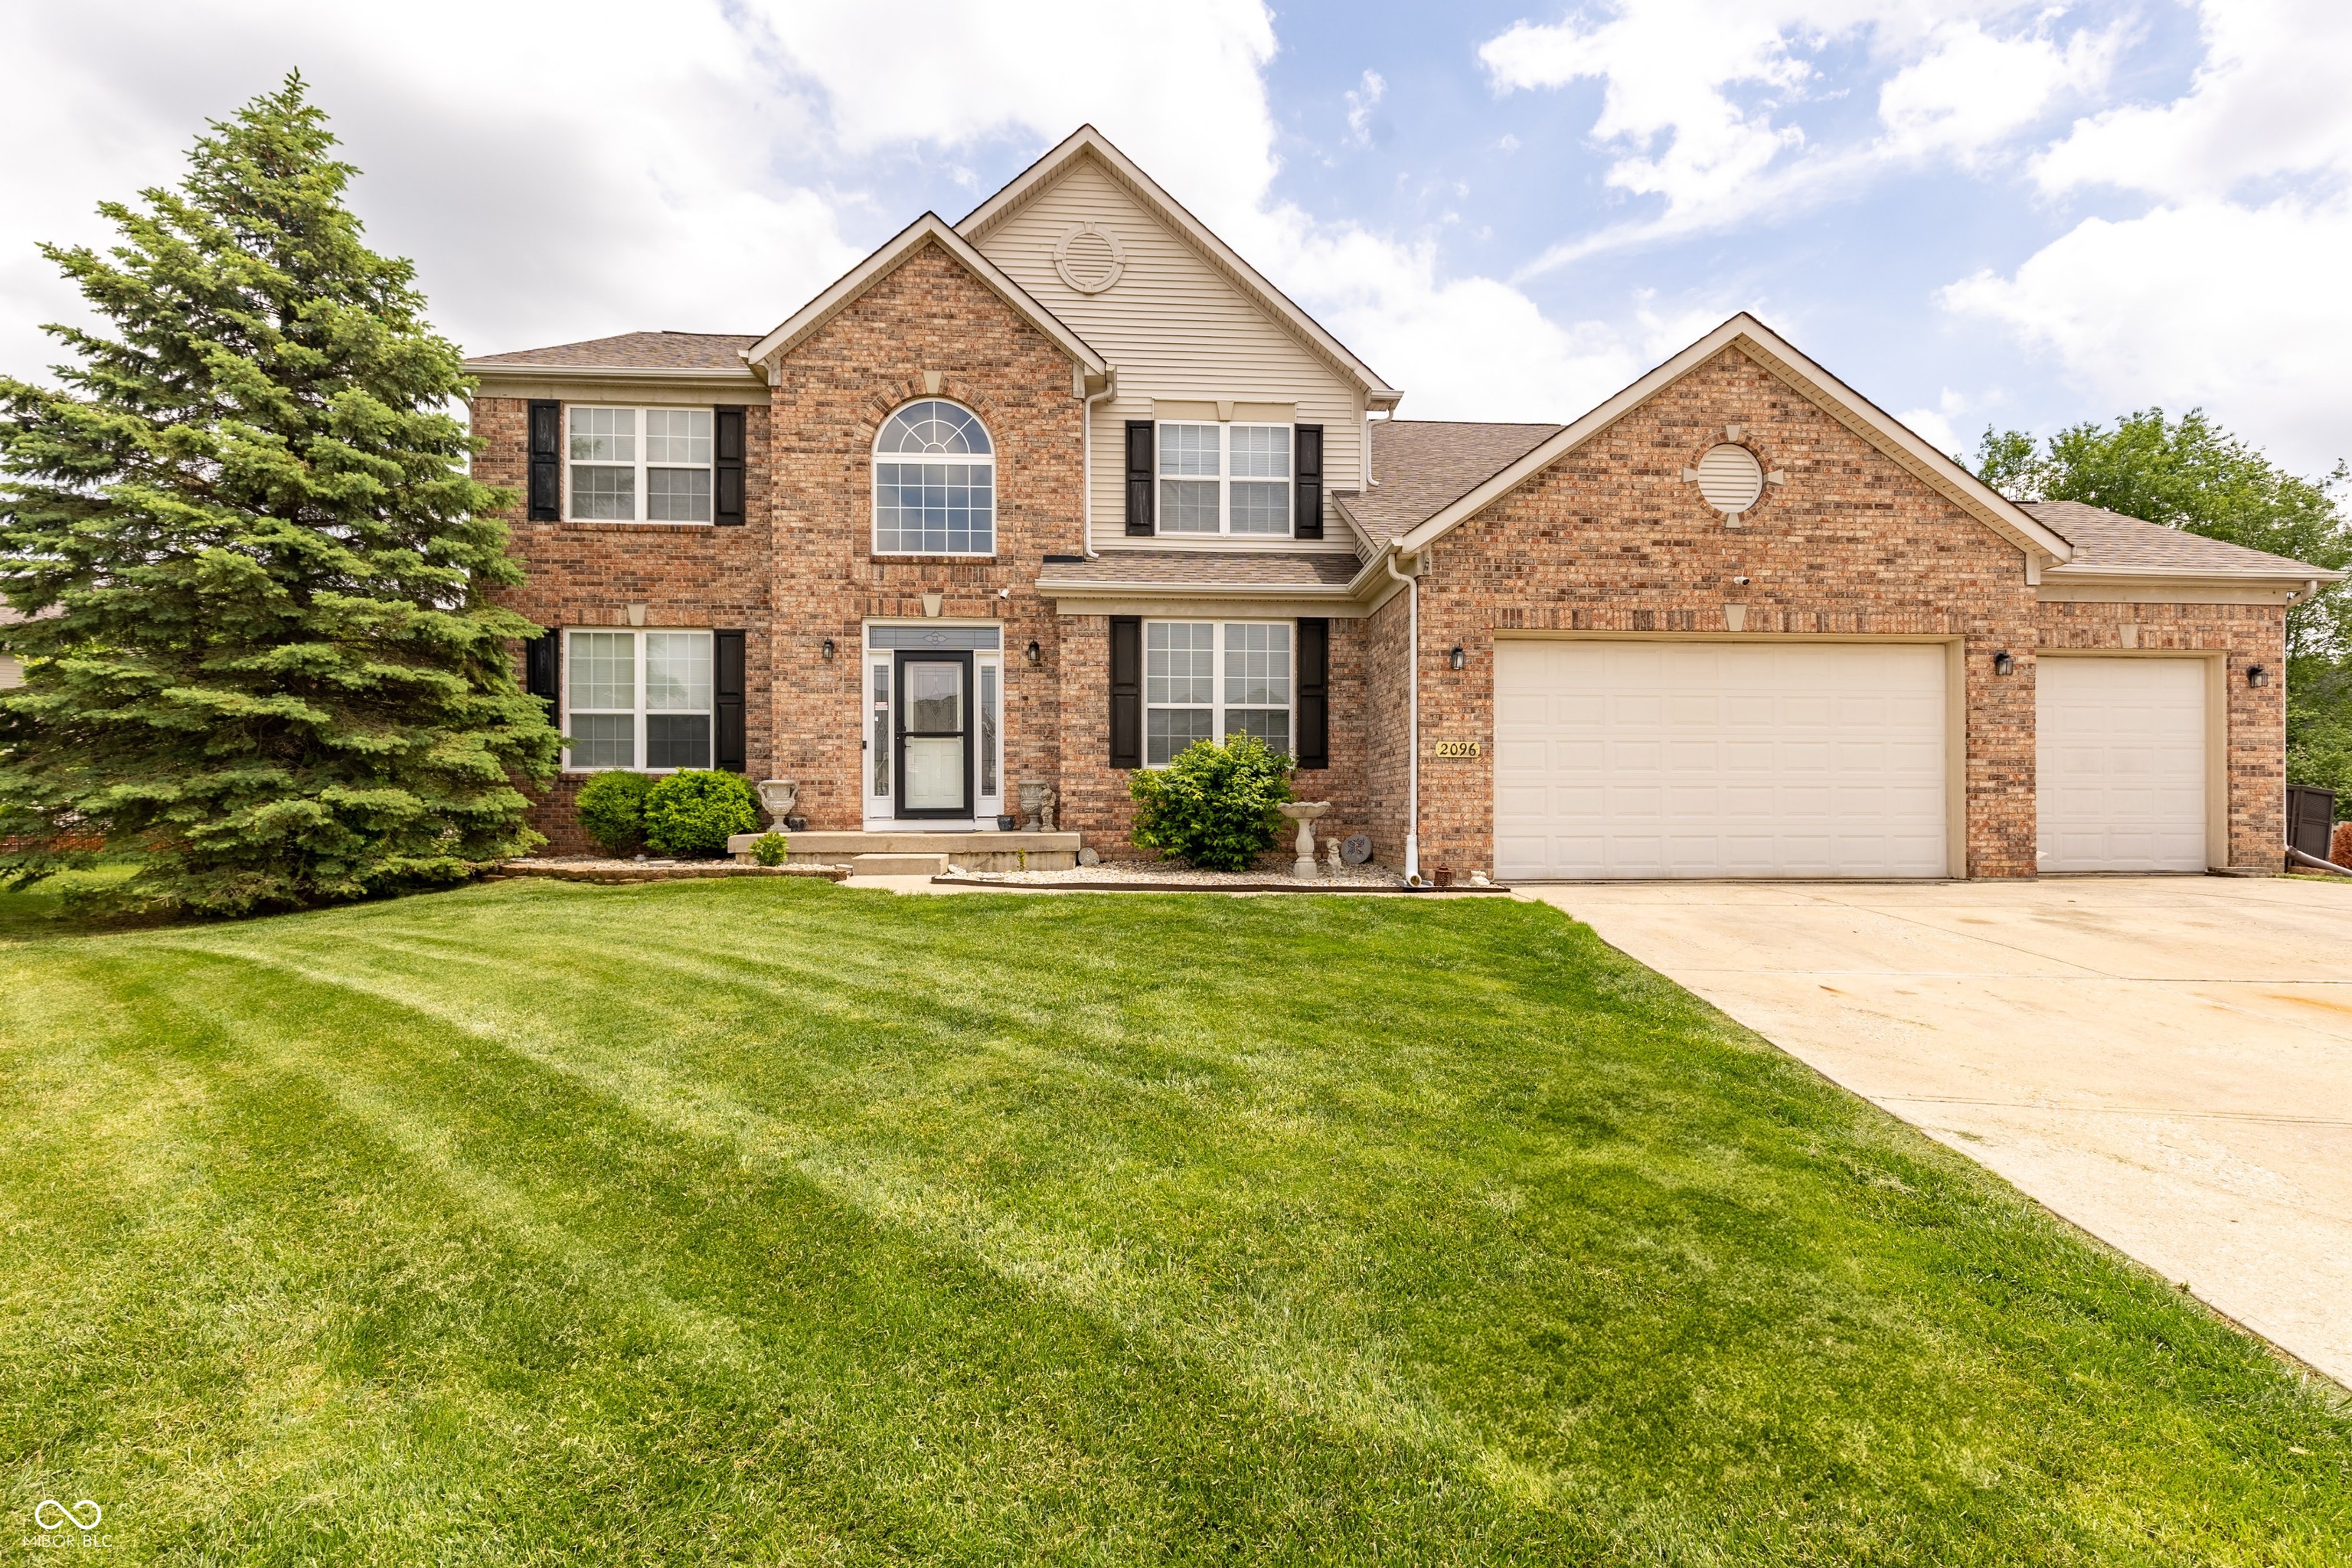
Active
$514,900
5
bds
|
3
ba
|
5,515
sqft
|
built
2002
2096 Whitetail Ct, Avon, IN 46123
$-597
Cash flow
-6.0%
Cash-on-Cash Return
4.9%
Cap rate
0.6%
Rent to Value Ratio
Active
$425,000
4
bds
|
2
ba
|
2,364
sqft
|
built
1999
8095 Christopher Ct, Avon, IN 46123
$-315
Cash flow
-3.9%
Cash-on-Cash Return
5.4%
Cap rate
0.7%
Rent to Value Ratio