Maricopa County Investment Properties for Sale
Browse homes for sale and investment properties in Maricopa County. Refine your search by price, property type, or more.
Best cash flowing properties in Maricopa County

Active
$185,000
1
bds
|
1
ba
|
629
sqft
|
built
1986
200 E Southern Ave, Tempe, AZ 85282
$-306
Cash flow
-8.6%
Cash-on-Cash Return
3.7%
Cap rate
0.7%
Rent to Value Ratio
Active
$459,000
3
bds
|
2
ba
|
1,422
sqft
|
built
1977
1233 W Dublin St, Chandler, AZ 85224
$-340
Cash flow
-3.9%
Cash-on-Cash Return
4.8%
Cap rate
0.6%
Rent to Value Ratio
9,237 out of 10,685 properties for sale in Maricopa County
Limited Results Shown
Create a free account, or log in to reveal all property listings and enjoy the complete experience.

Active
$550,000
3
bds
|
3
ba
|
2,343
sqft
|
built
2004
17012 S 27th Ln, Phoenix, AZ 85045
$-920
Cash flow
-8.7%
Cash-on-Cash Return
3.7%
Cap rate
0.5%
Rent to Value Ratio
Active
$714,900
4
bds
|
3
ba
|
2,883
sqft
|
built
2016
22174 E Creekside Dr, Queen Creek, AZ 85142
$-1,221
Cash flow
-8.9%
Cash-on-Cash Return
3.6%
Cap rate
0.5%
Rent to Value Ratio

Active
$429,000
3
bds
|
2
ba
|
1,710
sqft
|
built
2008
125 N 107th Dr, Avondale, AZ 85323
$-902
Cash flow
-11.0%
Cash-on-Cash Return
3.2%
Cap rate
0.5%
Rent to Value Ratio
Active
$299,000
3
bds
|
3
ba
|
1,315
sqft
|
built
1998
4743 W Alice Ave, Glendale, AZ 85302
$-354
Cash flow
-6.2%
Cash-on-Cash Return
4.3%
Cap rate
0.7%
Rent to Value Ratio
Active
$379,000
4
bds
|
2
ba
|
1,712
sqft
|
built
2006
7221 W Globe Ave, Phoenix, AZ 85043
$-397
Cash flow
-5.5%
Cash-on-Cash Return
4.4%
Cap rate
0.6%
Rent to Value Ratio
Active
$459,900
5
bds
|
2
ba
|
2,191
sqft
|
built
1972
4627 W Laurie Ln, Glendale, AZ 85302
$-746
Cash flow
-8.5%
Cash-on-Cash Return
3.7%
Cap rate
0.5%
Rent to Value Ratio
Active
$809,000
6
bds
|
3
ba
|
3,305
sqft
|
built
2004
9569 W Redbird Rd, Peoria, AZ 85383
$-1,444
Cash flow
-9.3%
Cash-on-Cash Return
3.5%
Cap rate
0.5%
Rent to Value Ratio
Active
$181,000
1
bds
|
1
ba
|
832
sqft
|
built
1985
17404 N 99th Ave, Sun City, AZ 85373
$-388
Cash flow
-11.2%
Cash-on-Cash Return
3.1%
Cap rate
0.9%
Rent to Value Ratio
Active
$675,000
4
bds
|
3
ba
|
3,207
sqft
|
built
2012
12241 W Patrick Ct, Sun City, AZ 85373
$-1,641
Cash flow
-12.7%
Cash-on-Cash Return
2.8%
Cap rate
0.4%
Rent to Value Ratio
Active
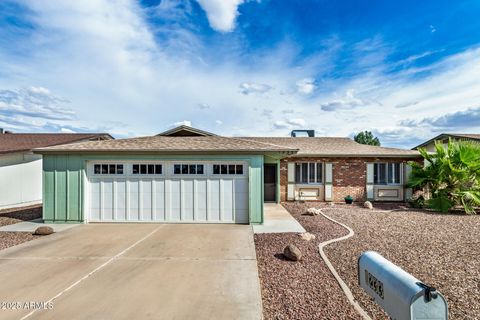
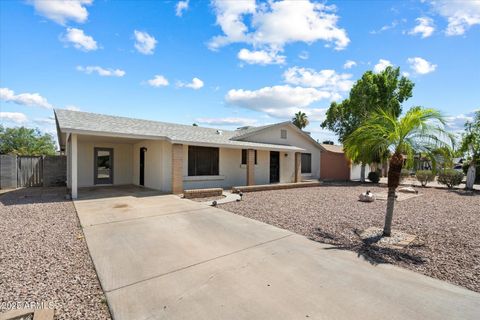
$629,000
6
bds
|
3
ba
|
2,047
sqft
|
built
1968
710 E La Jolla Dr, Tempe, AZ 85282
$-1,242
Cash flow
-10.3%
Cash-on-Cash Return
3.3%
Cap rate
0.4%
Rent to Value Ratio
Active
$549,900
5
bds
|
3
ba
|
1,923
sqft
|
built
1960
1835 E Palmcroft Dr, Tempe, AZ 85282
$-861
Cash flow
-8.2%
Cash-on-Cash Return
3.8%
Cap rate
0.5%
Rent to Value Ratio
Active
$939,000
5
bds
|
3
ba
|
2,813
sqft
|
built
1987
9276 S Myrtle Ave, Tempe, AZ 85284
$-2,215
Cash flow
-12.3%
Cash-on-Cash Return
2.8%
Cap rate
0.4%
Rent to Value Ratio
Active
$779,000
4
bds
|
3
ba
|
2,444
sqft
|
built
1981
401 E Barbara Dr, Tempe, AZ 85288
$-1,794
Cash flow
-12.0%
Cash-on-Cash Return
2.9%
Cap rate
0.4%
Rent to Value Ratio
Active
$465,000
3
bds
|
2
ba
|
1,615
sqft
|
built
1975
414 E Westchester Dr, Tempe, AZ 85283
$-1,011
Cash flow
-11.3%
Cash-on-Cash Return
3.1%
Cap rate
0.4%
Rent to Value Ratio
Active
$559,900
3
bds
|
2
ba
|
1,522
sqft
|
built
1962
206 E Manhatton Dr, Tempe, AZ 85282
$-817
Cash flow
-7.6%
Cash-on-Cash Return
3.9%
Cap rate
0.5%
Rent to Value Ratio
Active
$565,000
4
bds
|
2
ba
|
2,208
sqft
|
built
1976
1832 E Colgate Dr, Tempe, AZ 85283
$-984
Cash flow
-9.1%
Cash-on-Cash Return
3.6%
Cap rate
0.5%
Rent to Value Ratio
Active
$317,500
2
bds
|
2
ba
|
972
sqft
|
built
1984
633 W Southern Ave, Tempe, AZ 85282
$-712
Cash flow
-11.7%
Cash-on-Cash Return
3.0%
Cap rate
0.5%
Rent to Value Ratio
Active
$445,000
4
bds
|
2
ba
|
1,880
sqft
|
built
2022
6951 W Pedro Ln, Laveen, AZ 85339
$-940
Cash flow
-11.0%
Cash-on-Cash Return
3.1%
Cap rate
0.5%
Rent to Value Ratio
Active
$359,000
3
bds
|
2
ba
|
1,465
sqft
|
built
2006
4321 W Hasan Dr, Laveen, AZ 85339
$-511
Cash flow
-7.4%
Cash-on-Cash Return
4.0%
Cap rate
0.6%
Rent to Value Ratio
Active
$499,900
4
bds
|
2
ba
|
1,956
sqft
|
built
2020
5404 W Sweet Pea Ter, Laveen, AZ 85339
$-1,172
Cash flow
-12.2%
Cash-on-Cash Return
2.9%
Cap rate
0.5%
Rent to Value Ratio
Active
$330,000
3
bds
|
2
ba
|
1,206
sqft
|
built
2003
15557 W Durango St, Goodyear, AZ 85338
$-468
Cash flow
-7.4%
Cash-on-Cash Return
4.0%
Cap rate
0.5%
Rent to Value Ratio
Active
$375,000
3
bds
|
2
ba
|
1,266
sqft
|
built
1997
16184 W Hadley St, Goodyear, AZ 85338
$-692
Cash flow
-9.6%
Cash-on-Cash Return
3.5%
Cap rate
0.5%
Rent to Value Ratio
Active
$400,000
4
bds
|
2
ba
|
1,734
sqft
|
built
2017
18368 W Getty Dr, Goodyear, AZ 85338
$-771
Cash flow
-10.1%
Cash-on-Cash Return
3.4%
Cap rate
0.5%
Rent to Value Ratio
Active
$578,500
4
bds
|
3
ba
|
2,260
sqft
|
built
2022
153 S 156th Dr, Goodyear, AZ 85338
$-1,056
Cash flow
-9.5%
Cash-on-Cash Return
3.5%
Cap rate
0.5%
Rent to Value Ratio
Active
$399,900
3
bds
|
2
ba
|
1,848
sqft
|
built
2004
13332 S 176th Ln, Goodyear, AZ 85338
$-662
Cash flow
-8.6%
Cash-on-Cash Return
3.7%
Cap rate
0.6%
Rent to Value Ratio
Active
$610,000
4
bds
|
3
ba
|
3,121
sqft
|
built
2007
1442 S 167th Dr, Goodyear, AZ 85338
$-1,298
Cash flow
-11.1%
Cash-on-Cash Return
3.1%
Cap rate
0.5%
Rent to Value Ratio
Active
$415,000
4
bds
|
3
ba
|
2,138
sqft
|
built
2003
4315 W Carson Rd, Laveen, AZ 85339
$-479
Cash flow
-6.0%
Cash-on-Cash Return
4.3%
Cap rate
0.6%
Rent to Value Ratio
Active
$440,000
2
bds
|
1
ba
|
1,223
sqft
|
built
1945
512 E Mulberry Dr, Phoenix, AZ 85012
$-656
Cash flow
-7.8%
Cash-on-Cash Return
3.9%
Cap rate
0.5%
Rent to Value Ratio
Active
$425,000
4
bds
|
2
ba
|
1,923
sqft
|
built
2002
12532 W Apodaca Dr, Litchfield Park, AZ 85340
$-852
Cash flow
-10.5%
Cash-on-Cash Return
3.3%
Cap rate
0.5%
Rent to Value Ratio
Active
$639,900
4
bds
|
3
ba
|
2,985
sqft
|
built
2012
19257 W Oregon Ave, Litchfield Park, AZ 85340
$-1,516
Cash flow
-12.4%
Cash-on-Cash Return
2.8%
Cap rate
0.4%
Rent to Value Ratio
Active
$640,000
4
bds
|
4
ba
|
3,072
sqft
|
built
2013
5414 N Crestland Ct, Litchfield Park, AZ 85340
$-1,073
Cash flow
-8.7%
Cash-on-Cash Return
3.7%
Cap rate
0.5%
Rent to Value Ratio

Active
$1,000,000
5
bds
|
3
ba
|
3,454
sqft
|
built
2005
1434 E Venado Dr, New River, AZ 85087
$-2,093
Cash flow
-10.9%
Cash-on-Cash Return
3.2%
Cap rate
0.4%
Rent to Value Ratio
Active
$662,500
3
bds
|
2
ba
|
1,817
sqft
|
built
2018
49115 N 1st Ln, New River, AZ 85087
$-1,619
Cash flow
-12.8%
Cash-on-Cash Return
2.7%
Cap rate
0.4%
Rent to Value Ratio
Active
$1,349,000
4
bds
|
3
ba
|
3,466
sqft
|
built
1978
540 E Cercado Ln, Litchfield Park, AZ 85340
$-4,216
Cash flow
-16.3%
Cash-on-Cash Return
1.9%
Cap rate
0.3%
Rent to Value Ratio
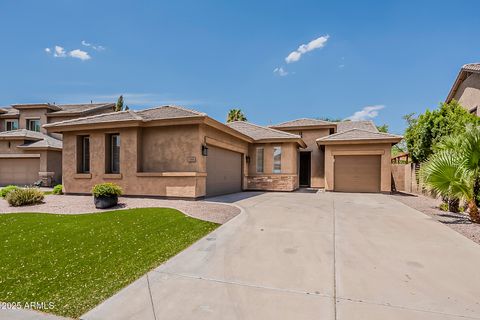
Active
$684,900
3
bds
|
2
ba
|
2,353
sqft
|
built
2002
180 W Roadrunner Dr, Chandler, AZ 85286
$-1,660
Cash flow
-12.6%
Cash-on-Cash Return
2.8%
Cap rate
0.4%
Rent to Value Ratio
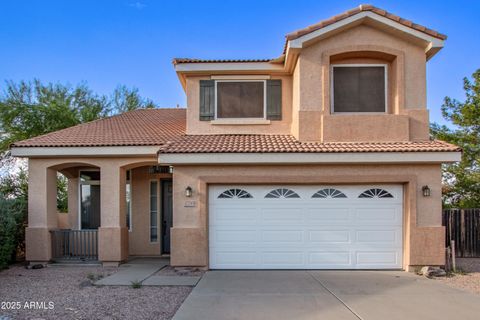
Active
$629,000
3
bds
|
2
ba
|
1,903
sqft
|
built
1991
5871 W Park Ave, Chandler, AZ 85226
$-1,362
Cash flow
-11.3%
Cash-on-Cash Return
3.1%
Cap rate
0.4%
Rent to Value Ratio
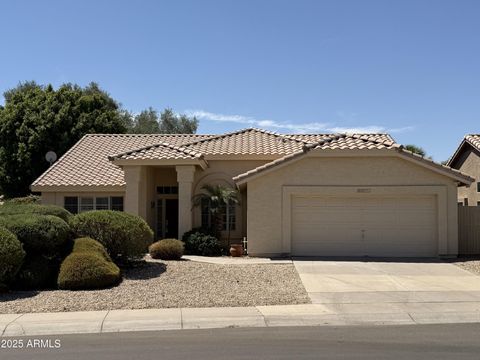
Active
$589,000
3
bds
|
3
ba
|
2,072
sqft
|
built
1996
1700 S Navajo Way, Chandler, AZ 85286
$-1,176
Cash flow
-10.4%
Cash-on-Cash Return
3.3%
Cap rate
0.5%
Rent to Value Ratio
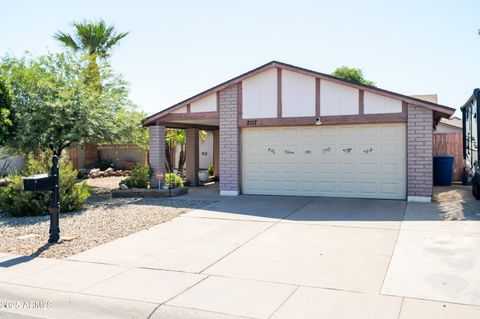
Active
$429,990
3
bds
|
2
ba
|
1,548
sqft
|
built
1979
2117 N Verano Way, Chandler, AZ 85224
$-631
Cash flow
-7.7%
Cash-on-Cash Return
3.9%
Cap rate
0.5%
Rent to Value Ratio