Maricopa County Investment Properties for Sale
Browse homes for sale and investment properties in Maricopa County. Refine your search by price, property type, or more.
Best cash flowing properties in Maricopa County
Active
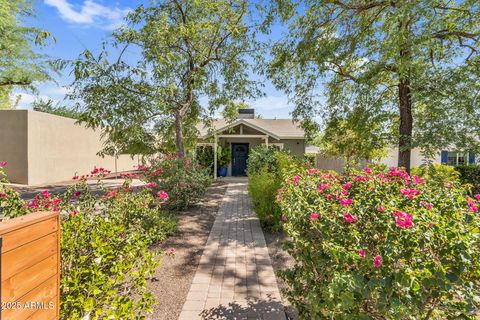
$280,000
3
bds
|
1
ba
|
1,192
sqft
|
built
1916
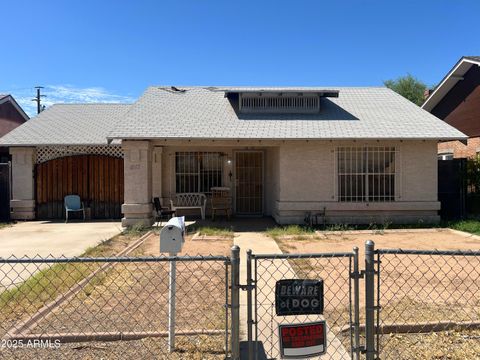
1213 E Moreland St, Phoenix, AZ 85006
$-181
Cash flow
-3.4%
Cash-on-Cash Return
4.9%
Cap rate
0.7%
Rent to Value Ratio

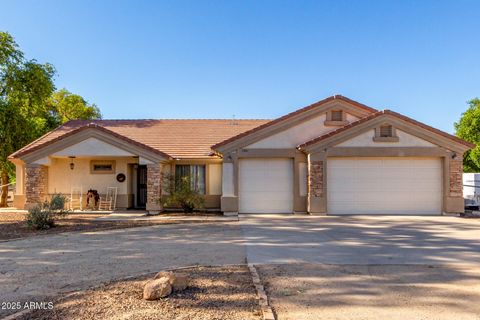
Active
$360,000
3
bds
|
2
ba
|
1,116
sqft
|
built
1959
1216 E Desert Park Ln, Phoenix, AZ 85020
$-306
Cash flow
-4.4%
Cash-on-Cash Return
4.7%
Cap rate
0.6%
Rent to Value Ratio
8,115 out of 9,442 properties for sale in Maricopa County
Limited Results Shown
Create a free account, or log in to reveal all property listings and enjoy the complete experience.

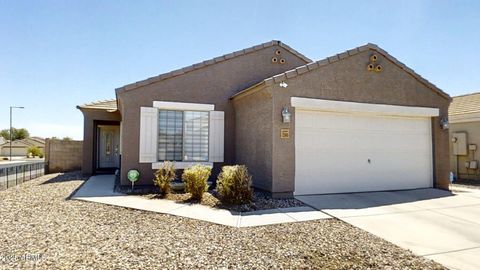
Active
$425,000
5
bds
|
2
ba
|
1,800
sqft
|
built
1983
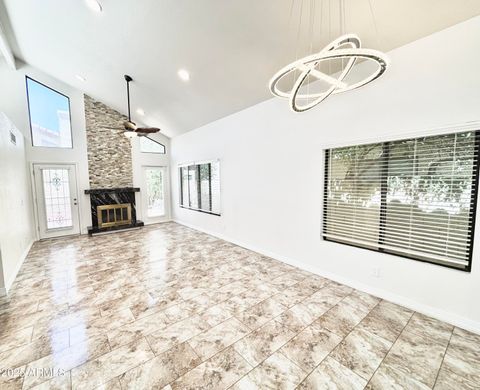
4737 W Villa Theresa Dr, Glendale, AZ 85308
$-721
Cash flow
-8.9%
Cash-on-Cash Return
3.6%
Cap rate
0.5%
Rent to Value Ratio
Active
$445,000
2
bds
|
2
ba
|
1,405
sqft
|
built
1985
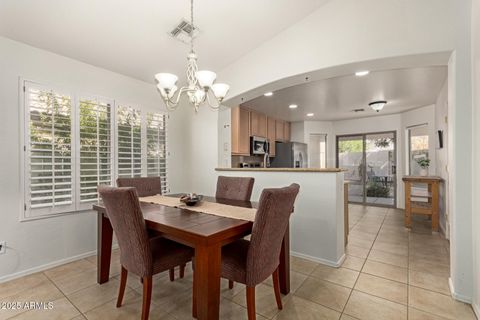
2674 N El Dorado Dr, Chandler, AZ 85224
$-881
Cash flow
-10.3%
Cash-on-Cash Return
3.3%
Cap rate
0.5%
Rent to Value Ratio

Active
$1,650,000
3
bds
|
3
ba
|
2,328
sqft
|
built
2000
10671 E Caribbean Ln, Scottsdale, AZ 85255
$-4,390
Cash flow
-13.9%
Cash-on-Cash Return
2.5%
Cap rate
0.3%
Rent to Value Ratio
Active
$416,750
3
bds
|
2
ba
|
1,242
sqft
|
built
2002
2736 E Dragoon Cir, Mesa, AZ 85204
$-810
Cash flow
-10.1%
Cash-on-Cash Return
3.3%
Cap rate
0.5%
Rent to Value Ratio
Active
$439,000
3
bds
|
2
ba
|
1,758
sqft
|
built
2021
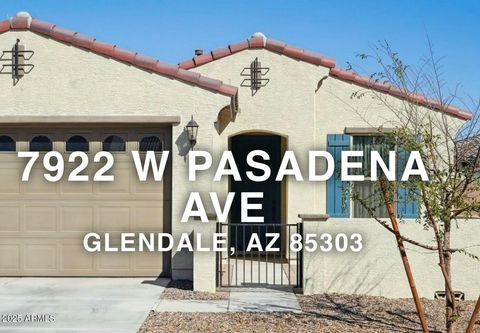
7922 W Pasadena Ave, Glendale, AZ 85303
$-953
Cash flow
-11.3%
Cash-on-Cash Return
3.1%
Cap rate
0.5%
Rent to Value Ratio
Active
$600,000
3
bds
|
2
ba
|
1,316
sqft
|
built
1904
717 E Myrtle Ave, Phoenix, AZ 85020
$-1,117
Cash flow
-9.7%
Cash-on-Cash Return
3.4%
Cap rate
0.5%
Rent to Value Ratio

Active
$599,000
5
bds
|
5
ba
|
3,484
sqft
|
built
2021
21950 N 260th Ln, Buckeye, AZ 85396
$-1,242
Cash flow
-10.8%
Cash-on-Cash Return
3.2%
Cap rate
0.5%
Rent to Value Ratio
Active
$749,000
4
bds
|
2
ba
|
2,238
sqft
|
built
2001
18420 E Navajo Dr, Queen Creek, AZ 85142
$-1,387
Cash flow
-9.7%
Cash-on-Cash Return
3.5%
Cap rate
0.5%
Rent to Value Ratio
Active
$355,000
4
bds
|
2
ba
|
1,569
sqft
|
built
2008
23969 W Pecan Rd, Buckeye, AZ 85326
$-632
Cash flow
-9.3%
Cash-on-Cash Return
3.5%
Cap rate
0.5%
Rent to Value Ratio
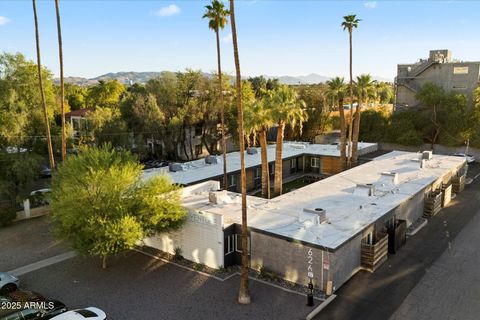
Active
$2,750,000
bds
|
0
ba
|
0
sqft
|
built
1960
626 S Wilson St, Tempe, AZ 85281
$-10,006
Cash flow
-19.0%
Cash-on-Cash Return
1.3%
Cap rate
0.2%
Rent to Value Ratio
Active
$1,735,000
3
bds
|
4
ba
|
3,836
sqft
|
built
2018
31023 N 117th Dr, Peoria, AZ 85383
$-3,585
Cash flow
-10.8%
Cash-on-Cash Return
3.2%
Cap rate
0.4%
Rent to Value Ratio

Active
$279,950
2
bds
|
2
ba
|
864
sqft
|
built
1972
8055 E Thomas Rd, Scottsdale, AZ 85251
$-838
Cash flow
-15.6%
Cash-on-Cash Return
2.1%
Cap rate
0.5%
Rent to Value Ratio
Active
$389,900
4
bds
|
2
ba
|
1,819
sqft
|
built
2004
15172 W Monroe St, Goodyear, AZ 85338
$-665
Cash flow
-8.9%
Cash-on-Cash Return
3.6%
Cap rate
0.5%
Rent to Value Ratio
Active
$899,900
4
bds
|
5
ba
|
3,401
sqft
|
built
2014
1541 E Sagittarius Pl, Chandler, AZ 85249
$-2,213
Cash flow
-12.8%
Cash-on-Cash Return
2.7%
Cap rate
0.4%
Rent to Value Ratio

Active
$455,000
3
bds
|
2
ba
|
2,100
sqft
|
built
1967
5654 N 39th Ave, Phoenix, AZ 85019
$-735
Cash flow
-8.4%
Cash-on-Cash Return
3.7%
Cap rate
0.5%
Rent to Value Ratio

Active
$369,000
3
bds
|
2
ba
|
1,662
sqft
|
built
2019
20168 W Monroe St, Buckeye, AZ 85326
$-442
Cash flow
-6.2%
Cash-on-Cash Return
4.2%
Cap rate
0.6%
Rent to Value Ratio
Active
$429,900
4
bds
|
2
ba
|
2,023
sqft
|
built
2003
15108 W Adams St, Goodyear, AZ 85338
$-864
Cash flow
-10.5%
Cash-on-Cash Return
3.3%
Cap rate
0.5%
Rent to Value Ratio
Active
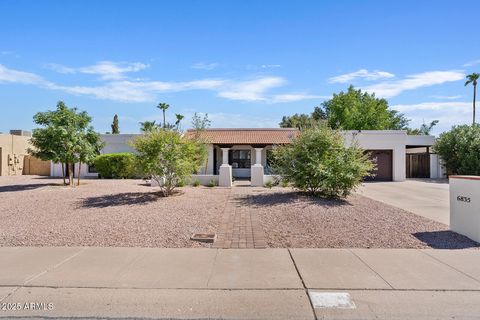
$1,125,000
4
bds
|
3
ba
|
2,309
sqft
|
built
1978
6835 E Hearn Rd, Scottsdale, AZ 85254
$-2,457
Cash flow
-11.4%
Cash-on-Cash Return
3.1%
Cap rate
0.4%
Rent to Value Ratio
Active
$585,000
4
bds
|
2
ba
|
2,326
sqft
|
built
1988
16818 S 34th St, Phoenix, AZ 85048
$-1,081
Cash flow
-9.6%
Cash-on-Cash Return
3.5%
Cap rate
0.5%
Rent to Value Ratio
Active
$615,000
4
bds
|
3
ba
|
2,347
sqft
|
built
1997
3452 W Sands Dr, Phoenix, AZ 85027
$-1,344
Cash flow
-11.4%
Cash-on-Cash Return
3.1%
Cap rate
0.4%
Rent to Value Ratio

Active
$815,000
4
bds
|
4
ba
|
3,789
sqft
|
built
2021
5432 S 106th Pl, Mesa, AZ 85212
$-2,027
Cash flow
-13.0%
Cash-on-Cash Return
2.7%
Cap rate
0.4%
Rent to Value Ratio
Active
$1,375,000
3
bds
|
2
ba
|
2,868
sqft
|
built
1982
9688 E Cinnabar Ave, Scottsdale, AZ 85258
$-4,053
Cash flow
-15.4%
Cash-on-Cash Return
2.1%
Cap rate
0.3%
Rent to Value Ratio
Active
$780,000
5
bds
|
3
ba
|
2,895
sqft
|
built
1972
1337 E Northshore Dr, Tempe, AZ 85283
$-1,645
Cash flow
-11.0%
Cash-on-Cash Return
3.1%
Cap rate
0.5%
Rent to Value Ratio

Active
$529,900
3
bds
|
2
ba
|
2,112
sqft
|
built
2004
12744 W Lone Tree Trl, Peoria, AZ 85383
$-810
Cash flow
-8.0%
Cash-on-Cash Return
3.8%
Cap rate
0.5%
Rent to Value Ratio
Active
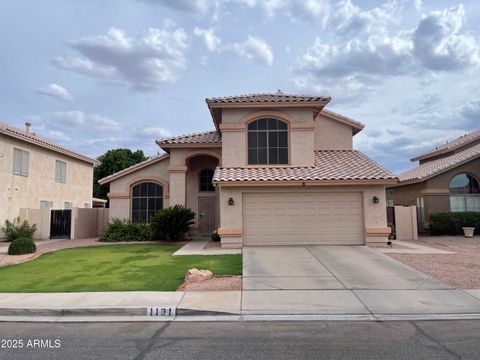
$615,000
4
bds
|
3
ba
|
2,337
sqft
|
built
1995
1131 W Goldfinch Way, Chandler, AZ 85286
$-1,285
Cash flow
-10.9%
Cash-on-Cash Return
3.2%
Cap rate
0.5%
Rent to Value Ratio
Active
$489,900
3
bds
|
2
ba
|
1,667
sqft
|
built
1995
19016 N 79th Ln, Glendale, AZ 85308
$-830
Cash flow
-8.8%
Cash-on-Cash Return
3.6%
Cap rate
0.5%
Rent to Value Ratio

Active
$2,125,000
3
bds
|
4
ba
|
3,596
sqft
|
built
1998
21157 N 74th Pl, Scottsdale, AZ 85255
$-7,215
Cash flow
-17.7%
Cash-on-Cash Return
1.6%
Cap rate
0.2%
Rent to Value Ratio
Active
$465,000
4
bds
|
2
ba
|
1,957
sqft
|
built
2001
2618 N 110th Dr, Avondale, AZ 85392
$-507
Cash flow
-5.7%
Cash-on-Cash Return
4.4%
Cap rate
0.6%
Rent to Value Ratio
Active
$447,990
3
bds
|
2
ba
|
1,331
sqft
|
built
1946
2027 W Medlock Dr, Phoenix, AZ 85015
$-1,018
Cash flow
-11.9%
Cash-on-Cash Return
3.0%
Cap rate
0.4%
Rent to Value Ratio
Active
$420,000
2
bds
|
2
ba
|
1,468
sqft
|
built
2008
5450 E Deer Valley Dr, Phoenix, AZ 85054
$-1,186
Cash flow
-14.7%
Cash-on-Cash Return
2.3%
Cap rate
0.5%
Rent to Value Ratio
Active
$825,000
5
bds
|
4
ba
|
3,683
sqft
|
built
2017
20252 E Quintero Rd, Queen Creek, AZ 85142
$-1,797
Cash flow
-11.4%
Cash-on-Cash Return
3.1%
Cap rate
0.4%
Rent to Value Ratio
Active
$498,000
3
bds
|
3
ba
|
1,954
sqft
|
built
2019
529 S 199th Dr, Buckeye, AZ 85326
$-863
Cash flow
-9.0%
Cash-on-Cash Return
3.6%
Cap rate
0.5%
Rent to Value Ratio

Active
$425,000
3
bds
|
2
ba
|
2,172
sqft
|
built
2021
25967 W Sands Dr, Buckeye, AZ 85396
$-584
Cash flow
-7.2%
Cash-on-Cash Return
4.0%
Cap rate
0.6%
Rent to Value Ratio

Active
$1,680,000
5
bds
|
6
ba
|
4,371
sqft
|
built
2022
20984 S 188th Pl, Queen Creek, AZ 85142
$-5,656
Cash flow
-17.6%
Cash-on-Cash Return
1.6%
Cap rate
0.2%
Rent to Value Ratio
Active
$864,999
5
bds
|
4
ba
|
3,910
sqft
|
built
2017
3133 N Loma Vis, Mesa, AZ 85213
$-2,042
Cash flow
-12.3%
Cash-on-Cash Return
2.8%
Cap rate
0.4%
Rent to Value Ratio

Active
$1,175,000
6
bds
|
4
ba
|
4,553
sqft
|
built
2003
5312 N Sierra Hermosa Ct, Litchfield Park, AZ 85340
$-3,001
Cash flow
-13.3%
Cash-on-Cash Return
2.6%
Cap rate
0.4%
Rent to Value Ratio
Active
$499,000
5
bds
|
4
ba
|
3,548
sqft
|
built
2007
26078 W Potter Dr, Buckeye, AZ 85396
$-684
Cash flow
-7.2%
Cash-on-Cash Return
4.0%
Cap rate
0.6%
Rent to Value Ratio
Active
$1,165,000
5
bds
|
3
ba
|
3,892
sqft
|
built
1999
2935 E Cathy Dr, Gilbert, AZ 85296
$-3,702
Cash flow
-16.6%
Cash-on-Cash Return
1.9%
Cap rate
0.3%
Rent to Value Ratio