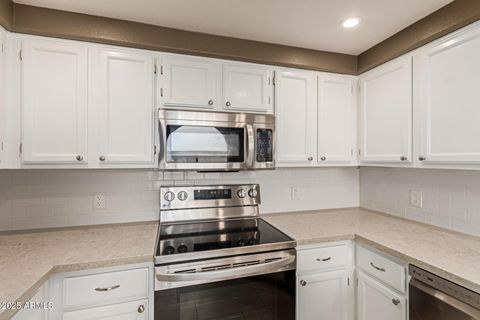
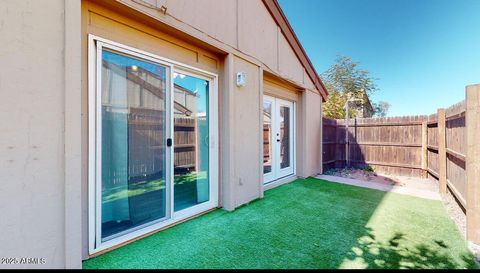
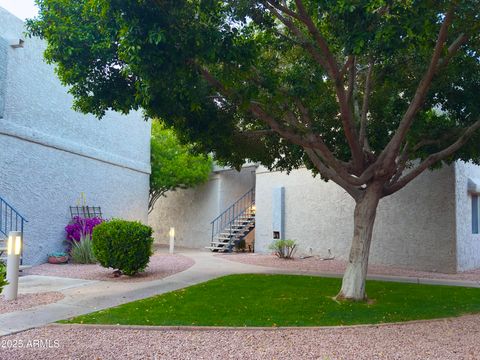
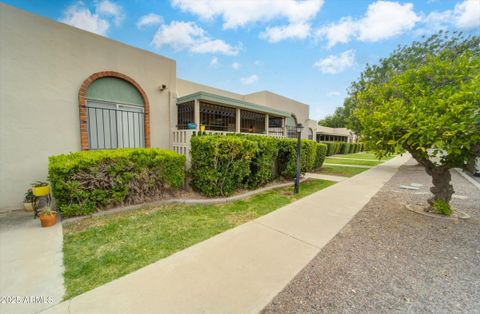
Maricopa County Investment Properties for Sale
Browse homes for sale and investment properties in Maricopa County. Refine your search by price, property type, or more.
Best cash flowing properties in Maricopa County
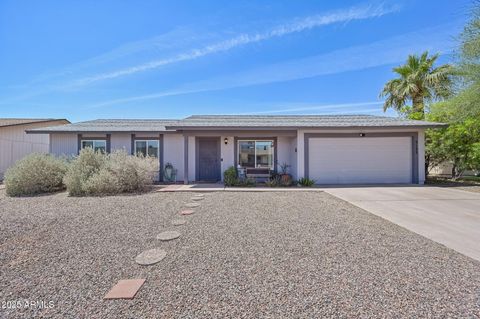
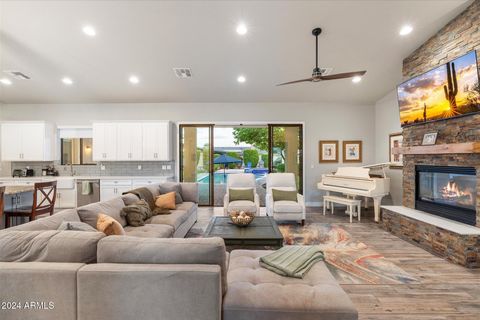
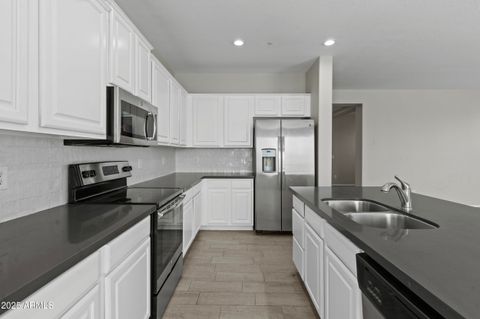
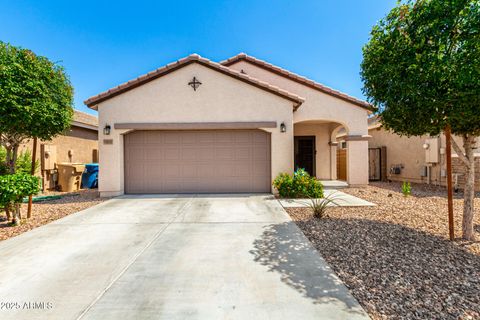
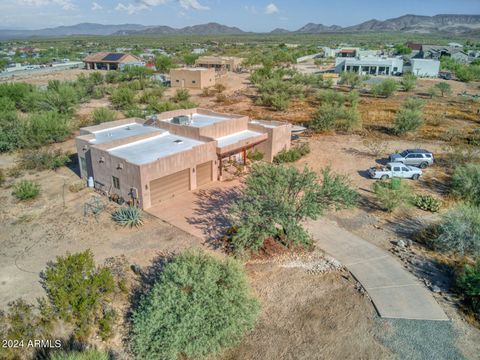
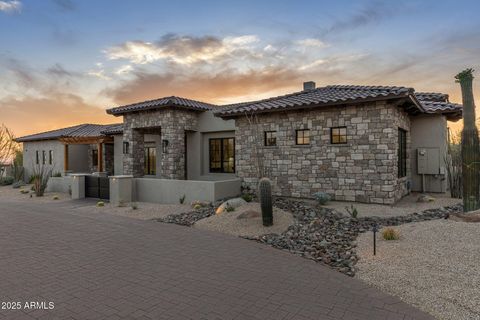
Active
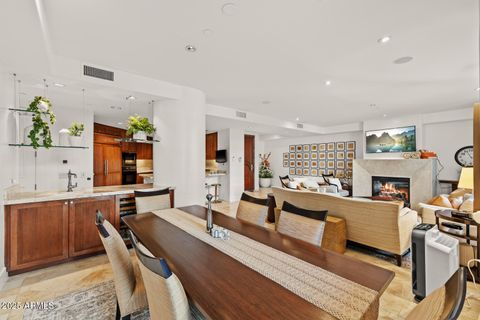
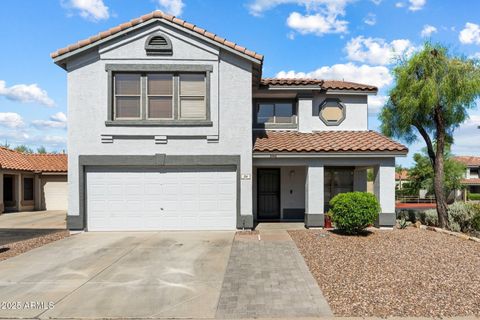
$699,000
2
bds
|
3
ba
|
1,520
sqft
|
built
2016
4438 N 27th St, Phoenix, AZ 85016
$74
Cash flow
0.6%
Cash-on-Cash Return
5.8%
Cap rate
0.8%
Rent to Value Ratio

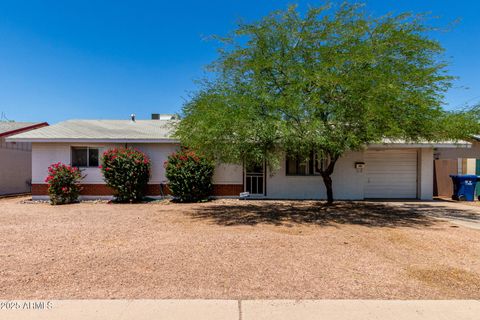
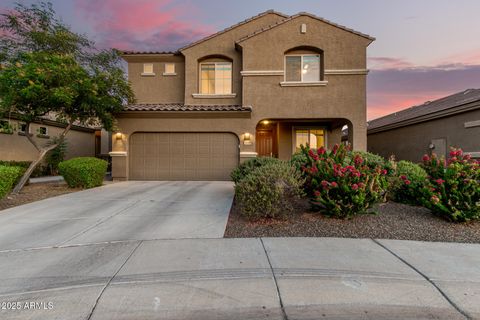
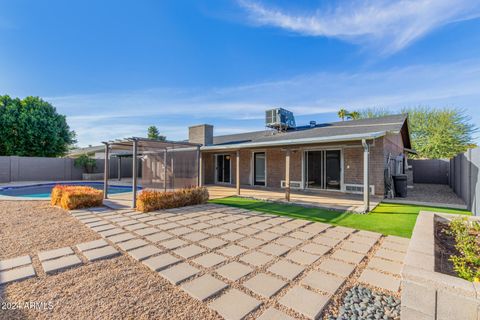
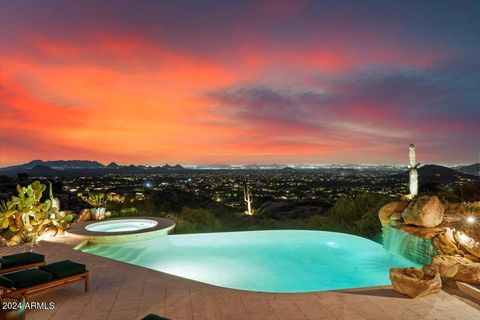
Active
$775,000
3
bds
|
3
ba
|
1,956
sqft
|
built
2018
7338 E Casitas Del Rio Dr, Scottsdale, AZ 85255
$24
Cash flow
0.2%
Cash-on-Cash Return
5.7%
Cap rate
0.8%
Rent to Value Ratio
9,315 out of 10,772 properties for sale in Maricopa County
Limited Results Shown
Create a free account, or log in to reveal all property listings and enjoy the complete experience.
Active
$1,499,000
5
bds
|
4
ba
|
4,686
sqft
|
built
2000
2625 N 24th St, Mesa, AZ 85213
$-3,074
Cash flow
-10.7%
Cash-on-Cash Return
3.2%
Cap rate
0.4%
Rent to Value Ratio
Active
$419,900
4
bds
|
3
ba
|
2,543
sqft
|
built
2007
18123 W Lundberg St, Surprise, AZ 85388
$-603
Cash flow
-7.5%
Cash-on-Cash Return
4.0%
Cap rate
0.5%
Rent to Value Ratio
Active
$847,000
4
bds
|
2
ba
|
2,357
sqft
|
built
2002
5537 E Dusty Wren Dr, Cave Creek, AZ 85331
$-1,298
Cash flow
-8.0%
Cash-on-Cash Return
3.8%
Cap rate
0.5%
Rent to Value Ratio
Active
$398,900
3
bds
|
2
ba
|
1,278
sqft
|
built
2001
2341 S Gordon, Mesa, AZ 85209
$-665
Cash flow
-8.7%
Cash-on-Cash Return
3.7%
Cap rate
0.5%
Rent to Value Ratio
Active
$428,000
3
bds
|
2
ba
|
1,244
sqft
|
built
1981
5133 E Keresan St, Phoenix, AZ 85044
$-779
Cash flow
-9.5%
Cash-on-Cash Return
3.5%
Cap rate
0.5%
Rent to Value Ratio
Active
$1,070,900
4
bds
|
4
ba
|
2,925
sqft
|
built
2017
115 S Galaxy Dr, Chandler, AZ 85226
$-1,985
Cash flow
-9.7%
Cash-on-Cash Return
3.5%
Cap rate
0.5%
Rent to Value Ratio
Active
$474,900
3
bds
|
2
ba
|
2,285
sqft
|
built
2004
29302 N 126th Ln, Peoria, AZ 85383
$-821
Cash flow
-9.0%
Cash-on-Cash Return
3.6%
Cap rate
0.5%
Rent to Value Ratio
Active
$611,000
3
bds
|
2
ba
|
1,269
sqft
|
built
1960
230 E Fairmont Dr, Tempe, AZ 85282
$-1,490
Cash flow
-12.7%
Cash-on-Cash Return
2.8%
Cap rate
0.4%
Rent to Value Ratio
Active
$325,000
2
bds
|
2
ba
|
1,022
sqft
|
built
1992
750 E Northern Ave, Phoenix, AZ 85020
$-495
Cash flow
-7.9%
Cash-on-Cash Return
3.9%
Cap rate
0.6%
Rent to Value Ratio
Active
$209,900
2
bds
|
2
ba
|
1,080
sqft
|
built
1981
12445 N 21st Ave, Phoenix, AZ 85029
$-316
Cash flow
-7.9%
Cash-on-Cash Return
3.9%
Cap rate
0.7%
Rent to Value Ratio
Active
$294,990
2
bds
|
2
ba
|
1,000
sqft
|
built
1980
4444 E Paradise Village Pkwy N, Phoenix, AZ 85032
$-686
Cash flow
-12.1%
Cash-on-Cash Return
2.9%
Cap rate
0.5%
Rent to Value Ratio
Active
$317,900
2
bds
|
1
ba
|
881
sqft
|
built
1965
8141 N Central Ave, Phoenix, AZ 85020
$-786
Cash flow
-12.9%
Cash-on-Cash Return
2.7%
Cap rate
0.5%
Rent to Value Ratio
Active
$1,195,000
2
bds
|
2
ba
|
2,417
sqft
|
built
2002
2402 E Esplanade Ln, Phoenix, AZ 85016
$-3,788
Cash flow
-16.5%
Cash-on-Cash Return
1.9%
Cap rate
0.6%
Rent to Value Ratio

Active
$449,999
2
bds
|
2
ba
|
1,234
sqft
|
built
2007
11640 N Tatum Blvd, Phoenix, AZ 85028
$-446
Cash flow
-5.2%
Cash-on-Cash Return
4.5%
Cap rate
0.7%
Rent to Value Ratio
Active
$189,990
1
bds
|
1
ba
|
622
sqft
|
built
1979
3619 E Monterosa St, Phoenix, AZ 85018
$-375
Cash flow
-10.3%
Cash-on-Cash Return
3.3%
Cap rate
0.7%
Rent to Value Ratio

Active
$345,000
2
bds
|
2
ba
|
975
sqft
|
built
1996
1633 E Lakeside Dr, Gilbert, AZ 85234
$-787
Cash flow
-11.9%
Cash-on-Cash Return
2.9%
Cap rate
0.6%
Rent to Value Ratio
Active
$500,000
3
bds
|
2
ba
|
1,616
sqft
|
built
2002
41333 N Belfair Way, Anthem, AZ 85086
$-1,048
Cash flow
-10.9%
Cash-on-Cash Return
3.2%
Cap rate
0.5%
Rent to Value Ratio

Active
$295,000
3
bds
|
2
ba
|
1,367
sqft
|
built
1986
10410 N Cave Creek Rd, Phoenix, AZ 85020
$-708
Cash flow
-12.5%
Cash-on-Cash Return
2.8%
Cap rate
0.6%
Rent to Value Ratio
Active
$273,900
3
bds
|
3
ba
|
1,534
sqft
|
built
1986
2315 W Union Hills Dr, Phoenix, AZ 85027
$-445
Cash flow
-8.5%
Cash-on-Cash Return
3.7%
Cap rate
0.7%
Rent to Value Ratio

Active
$249,000
2
bds
|
1
ba
|
715
sqft
|
built
1942
140 W 8th Ave, Mesa, AZ 85210
$-18
Cash flow
-0.4%
Cash-on-Cash Return
5.6%
Cap rate
0.7%
Rent to Value Ratio
Active
$625,000
3
bds
|
3
ba
|
1,872
sqft
|
built
1999
7500 E Deer Valley Rd, Scottsdale, AZ 85255
$-1,081
Cash flow
-9.0%
Cash-on-Cash Return
3.6%
Cap rate
0.5%
Rent to Value Ratio
Active
$229,900
2
bds
|
2
ba
|
1,049
sqft
|
built
1988
2020 W Union Hills Dr, Phoenix, AZ 85027
$-298
Cash flow
-6.8%
Cash-on-Cash Return
4.1%
Cap rate
0.7%
Rent to Value Ratio
Active
$360,000
2
bds
|
3
ba
|
1,552
sqft
|
built
1987
2875 W Highland St, Chandler, AZ 85224
$-644
Cash flow
-9.3%
Cash-on-Cash Return
3.5%
Cap rate
0.6%
Rent to Value Ratio
Active
$530,000
2
bds
|
2
ba
|
1,494
sqft
|
built
1981
3401 N 37th St, Phoenix, AZ 85018
$-1,605
Cash flow
-15.8%
Cash-on-Cash Return
2.0%
Cap rate
0.4%
Rent to Value Ratio

Active
$350,000
3
bds
|
2
ba
|
1,470
sqft
|
built
2017
3602 N 300th Dr, Buckeye, AZ 85396
$-608
Cash flow
-9.1%
Cash-on-Cash Return
3.6%
Cap rate
0.5%
Rent to Value Ratio
Active
$390,000
3
bds
|
2
ba
|
1,610
sqft
|
built
2018
19847 W Monroe St, Buckeye, AZ 85326
$-601
Cash flow
-8.0%
Cash-on-Cash Return
3.8%
Cap rate
0.5%
Rent to Value Ratio

Active
$599,000
4
bds
|
3
ba
|
2,185
sqft
|
built
2018
20906 E Macaw Dr, Queen Creek, AZ 85142
$-951
Cash flow
-8.3%
Cash-on-Cash Return
3.8%
Cap rate
0.5%
Rent to Value Ratio
Active
$635,000
4
bds
|
3
ba
|
2,633
sqft
|
built
2016
2149 E Aire Libre Ave, Phoenix, AZ 85022
$-1,391
Cash flow
-11.4%
Cash-on-Cash Return
3.1%
Cap rate
0.4%
Rent to Value Ratio
Active
$425,000
2
bds
|
2
ba
|
1,211
sqft
|
built
2006
4808 N 24th St, Phoenix, AZ 85016
$-919
Cash flow
-11.3%
Cash-on-Cash Return
3.1%
Cap rate
0.8%
Rent to Value Ratio
Active
$680,000
3
bds
|
3
ba
|
2,356
sqft
|
built
2015
26860 N 102nd Ln, Peoria, AZ 85383
$-1,303
Cash flow
-10.0%
Cash-on-Cash Return
3.4%
Cap rate
0.5%
Rent to Value Ratio
Active
$634,900
3
bds
|
2
ba
|
2,072
sqft
|
built
2004
44811 N 12th St, New River, AZ 85087
$-967
Cash flow
-7.9%
Cash-on-Cash Return
3.9%
Cap rate
0.5%
Rent to Value Ratio
Active
$695,000
4
bds
|
2
ba
|
2,047
sqft
|
built
1970
3033 E Sierra St, Phoenix, AZ 85028
$-1,014
Cash flow
-7.6%
Cash-on-Cash Return
3.9%
Cap rate
0.5%
Rent to Value Ratio
Active
$499,999
4
bds
|
2
ba
|
2,334
sqft
|
built
1991
3853 W Calle Lejos, Glendale, AZ 85310
$-622
Cash flow
-6.5%
Cash-on-Cash Return
4.2%
Cap rate
0.6%
Rent to Value Ratio

Active
$365,000
3
bds
|
3
ba
|
1,951
sqft
|
built
2014
4745 W Fremont Rd, Laveen, AZ 85339
$-562
Cash flow
-8.0%
Cash-on-Cash Return
3.8%
Cap rate
0.6%
Rent to Value Ratio
Active
$665,000
6
bds
|
4
ba
|
3,539
sqft
|
built
1987
6925 W Tonto Dr, Glendale, AZ 85308
$-1,190
Cash flow
-9.3%
Cash-on-Cash Return
3.5%
Cap rate
0.5%
Rent to Value Ratio
Active
$5,850,000
3
bds
|
4
ba
|
4,484
sqft
|
built
2025
9456 E Sands Dr, Scottsdale, AZ 85255
$-22,160
Cash flow
-19.8%
Cash-on-Cash Return
1.1%
Cap rate
0.2%
Rent to Value Ratio
Active
$6,150,000
5
bds
|
7
ba
|
7,527
sqft
|
built
1998
11155 E Honda Bow Rd, Scottsdale, AZ 85262
$-22,751
Cash flow
-19.3%
Cash-on-Cash Return
1.2%
Cap rate
0.2%
Rent to Value Ratio

Active
$464,000
2
bds
|
2
ba
|
1,302
sqft
|
built
1998
15225 N 100th St, Scottsdale, AZ 85260
$-862
Cash flow
-9.7%
Cash-on-Cash Return
3.5%
Cap rate
0.5%
Rent to Value Ratio