Arizona Investment Properties for Sale
Browse homes for sale and investment properties in Arizona. Refine your search by price, property type, or more.
Best cash flowing properties in Arizona

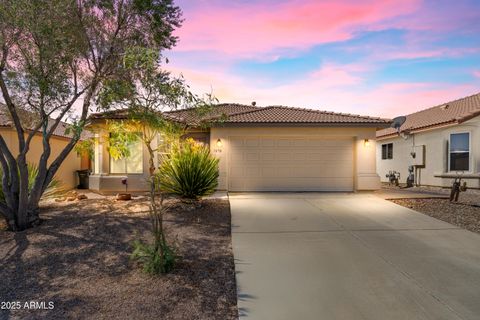
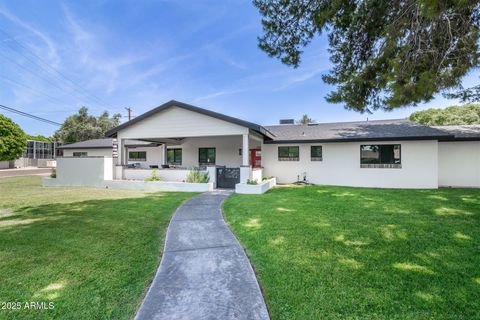
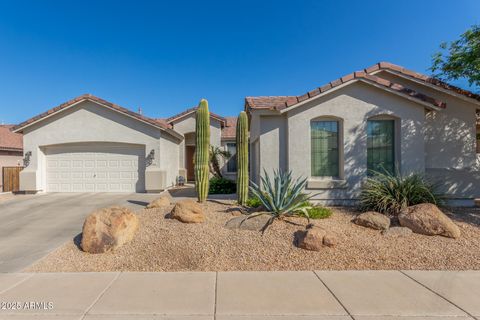
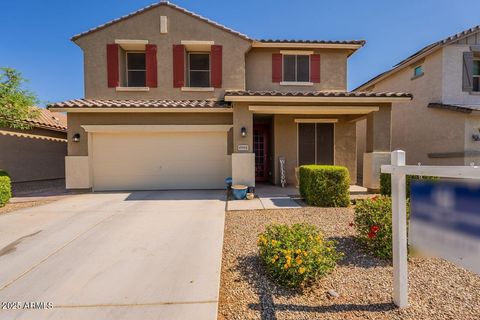
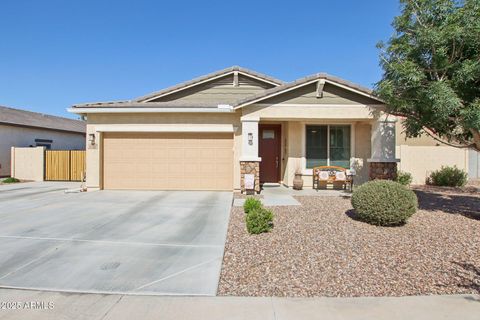
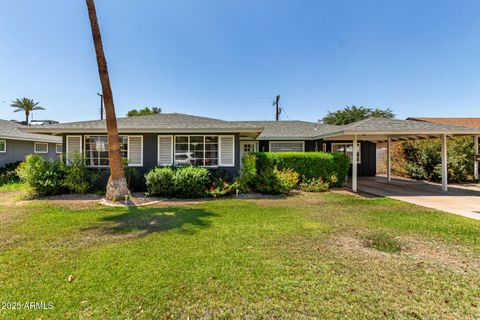
Active
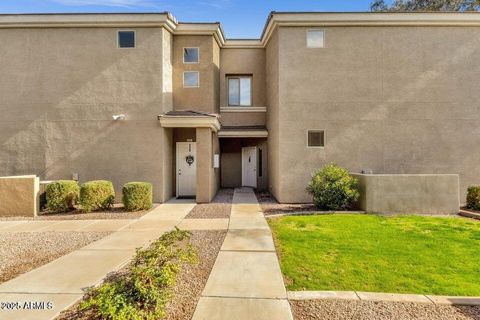
$315,000
3
bds
|
2
ba
|
1,101
sqft
|
built
1963
4113 W Sheridan St, Phoenix, AZ 85009
$-311
Cash flow
-5.2%
Cash-on-Cash Return
4.5%
Cap rate
0.6%
Rent to Value Ratio
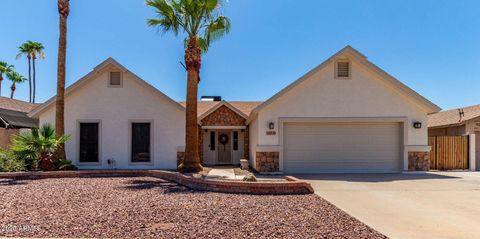
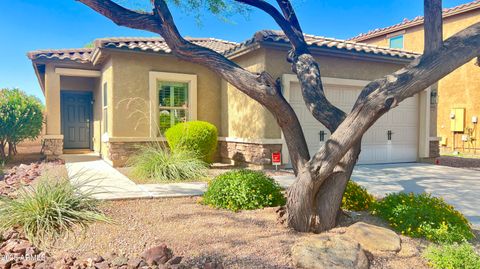
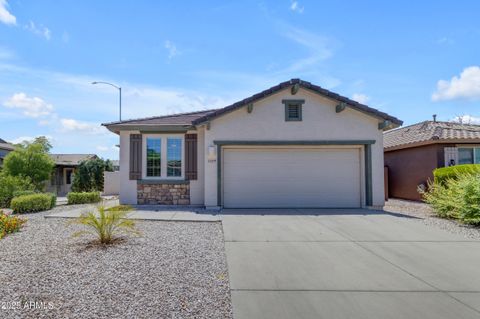
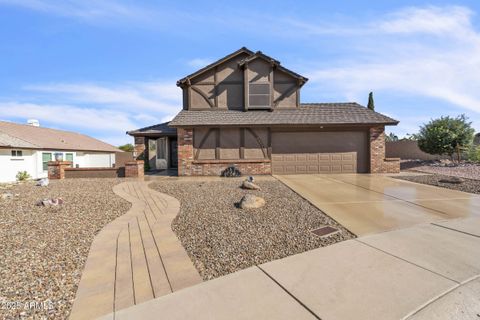
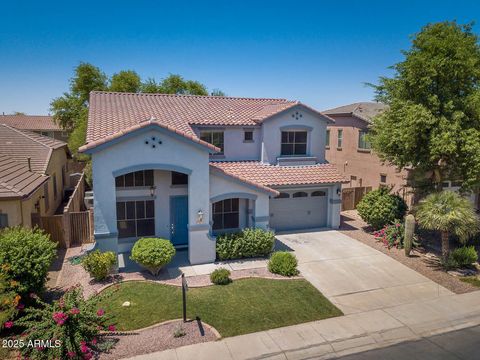
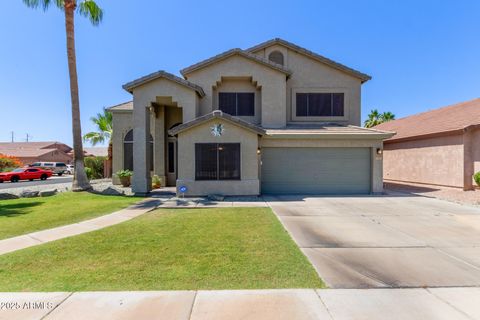
Active
$339,900
3
bds
|
2
ba
|
1,669
sqft
|
built
2006
1630 Silverado Dr, Sierra Vista, AZ 85635
$-508
Cash flow
-7.8%
Cash-on-Cash Return
3.9%
Cap rate
0.5%
Rent to Value Ratio
10,000 out of 18,725 properties for sale in Arizona
Limited Results Shown
Create a free account, or log in to reveal all property listings and enjoy the complete experience.

Active
$680,000
5
bds
|
3
ba
|
2,517
sqft
|
built
2005
36008 N 213th Dr, Wittmann, AZ 85361
$-1,529
Cash flow
-11.7%
Cash-on-Cash Return
3.6%
Cap rate
0.5%
Rent to Value Ratio
Active
$630,000
3
bds
|
2
ba
|
1,786
sqft
|
built
1983
10029 S 44th St, Phoenix, AZ 85044
$-1,031
Cash flow
-8.5%
Cash-on-Cash Return
3.7%
Cap rate
0.5%
Rent to Value Ratio
Active
$1,099,987
5
bds
|
4
ba
|
3,429
sqft
|
built
2009
9864 E Baseline Ave, Gold Canyon, AZ 85118
$-2,994
Cash flow
-14.2%
Cash-on-Cash Return
2.4%
Cap rate
0.4%
Rent to Value Ratio
Active
$440,000
4
bds
|
3
ba
|
2,048
sqft
|
built
2007
9205 W Williams St, Tolleson, AZ 85353
$-1,114
Cash flow
-13.2%
Cash-on-Cash Return
3.2%
Cap rate
0.5%
Rent to Value Ratio

Active
$725,000
3
bds
|
3
ba
|
2,372
sqft
|
built
1989
25821 N Bolero Bnd, Rio Verde, AZ 85263
$-1,279
Cash flow
-9.2%
Cash-on-Cash Return
3.6%
Cap rate
0.6%
Rent to Value Ratio
Active
$330,000
2
bds
|
2
ba
|
1,252
sqft
|
built
2001
1335 E June St, Mesa, AZ 85203
$-938
Cash flow
-14.8%
Cash-on-Cash Return
2.9%
Cap rate
0.5%
Rent to Value Ratio
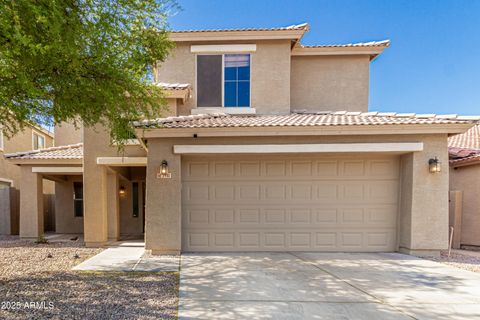
Active
$315,000
3
bds
|
2
ba
|
1,101
sqft
|
built
1963
4113 W Sheridan St, Phoenix, AZ 85009
$-311
Cash flow
-5.2%
Cash-on-Cash Return
4.5%
Cap rate
0.6%
Rent to Value Ratio
Active
$549,900
4
bds
|
4
ba
|
2,340
sqft
|
built
2016
778 W Lowell Dr, San Tan Valley, AZ 85140
$-1,102
Cash flow
-10.5%
Cash-on-Cash Return
3.9%
Cap rate
0.5%
Rent to Value Ratio

Active
$1,150,000
4
bds
|
3
ba
|
2,971
sqft
|
built
1983
16818 E Parlin Dr, Fountain Hills, AZ 85268
$-3,210
Cash flow
-14.6%
Cash-on-Cash Return
2.3%
Cap rate
0.3%
Rent to Value Ratio
Active
$1,489,000
5
bds
|
4
ba
|
3,468
sqft
|
built
1998
6423 E Maria Dr, Cave Creek, AZ 85331
$-2,837
Cash flow
-9.9%
Cash-on-Cash Return
3.4%
Cap rate
0.4%
Rent to Value Ratio
Active
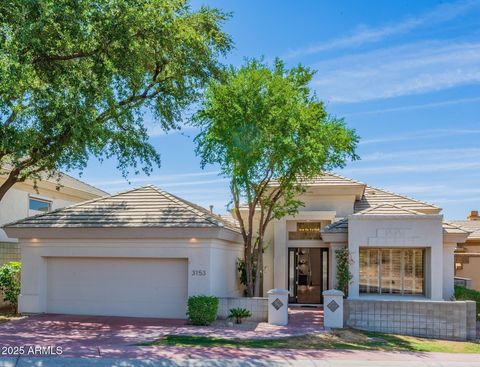
$2,395,000
3
bds
|
4
ba
|
3,091
sqft
|
built
1996
3153 E Sierra Vista Dr, Phoenix, AZ 85016
$-8,161
Cash flow
-17.8%
Cash-on-Cash Return
1.6%
Cap rate
0.3%
Rent to Value Ratio
Active
$1,550,000
4
bds
|
4
ba
|
3,421
sqft
|
built
1955
3102 E Mariposa St, Phoenix, AZ 85016
$-4,775
Cash flow
-16.1%
Cash-on-Cash Return
2.0%
Cap rate
0.3%
Rent to Value Ratio
Active
$440,000
3
bds
|
2
ba
|
1,776
sqft
|
built
2011
10850 W Avenida Del Rey, Peoria, AZ 85383
$-1,012
Cash flow
-12.0%
Cash-on-Cash Return
3.5%
Cap rate
0.5%
Rent to Value Ratio

Active
$585,000
3
bds
|
2
ba
|
2,036
sqft
|
built
1998
7435 W Trails Dr, Glendale, AZ 85308
$-1,290
Cash flow
-11.5%
Cash-on-Cash Return
3.6%
Cap rate
0.5%
Rent to Value Ratio
Active
$499,900
3
bds
|
3
ba
|
1,982
sqft
|
built
2003
2511 W Blue Sky Dr, Phoenix, AZ 85085
$-848
Cash flow
-8.9%
Cash-on-Cash Return
3.6%
Cap rate
0.5%
Rent to Value Ratio
Active
$687,500
4
bds
|
2
ba
|
2,478
sqft
|
built
2000
2230 E Whitten St, Chandler, AZ 85225
$-1,568
Cash flow
-11.9%
Cash-on-Cash Return
2.9%
Cap rate
0.4%
Rent to Value Ratio
Active
$465,000
4
bds
|
2
ba
|
1,823
sqft
|
built
2003
9623 S 25th Ln, Phoenix, AZ 85041
$-972
Cash flow
-10.9%
Cash-on-Cash Return
3.2%
Cap rate
0.5%
Rent to Value Ratio
Active
$494,000
3
bds
|
2
ba
|
1,240
sqft
|
built
1970
3615 E Hearn Rd, Phoenix, AZ 85032
$-698
Cash flow
-7.4%
Cash-on-Cash Return
4.0%
Cap rate
0.5%
Rent to Value Ratio
Active
$680,000
3
bds
|
3
ba
|
1,862
sqft
|
built
1992
14186 N 100th Pl, Scottsdale, AZ 85260
$-1,365
Cash flow
-10.5%
Cash-on-Cash Return
3.3%
Cap rate
0.5%
Rent to Value Ratio

Active
$2,400,000
5
bds
|
5
ba
|
5,195
sqft
|
built
2000
2558 E Page Ct, Gilbert, AZ 85234
$-8,625
Cash flow
-18.8%
Cash-on-Cash Return
1.4%
Cap rate
0.2%
Rent to Value Ratio
Active
$485,000
4
bds
|
2
ba
|
1,798
sqft
|
built
2012
11159 E Sebring Ave, Mesa, AZ 85212
$-989
Cash flow
-10.6%
Cash-on-Cash Return
3.8%
Cap rate
0.5%
Rent to Value Ratio
Active
$449,999
5
bds
|
3
ba
|
3,018
sqft
|
built
2020
17552 W Patrick Ln, Surprise, AZ 85387
$-827
Cash flow
-9.6%
Cash-on-Cash Return
4.1%
Cap rate
0.6%
Rent to Value Ratio
Active
$630,000
4
bds
|
3
ba
|
2,030
sqft
|
built
1984
4547 E Buist Ave, Phoenix, AZ 85044
$-1,727
Cash flow
-14.3%
Cash-on-Cash Return
3.0%
Cap rate
0.4%
Rent to Value Ratio

Active
$329,000
1
bds
|
1
ba
|
866
sqft
|
built
2008
11640 N Tatum Blvd, Phoenix, AZ 85028
$-853
Cash flow
-13.5%
Cash-on-Cash Return
3.2%
Cap rate
0.6%
Rent to Value Ratio
Active
$339,900
3
bds
|
2
ba
|
1,669
sqft
|
built
2006
1630 Silverado Dr, Sierra Vista, AZ 85635
$-508
Cash flow
-7.8%
Cash-on-Cash Return
3.9%
Cap rate
0.5%
Rent to Value Ratio
Active
$456,749
4
bds
|
3
ba
|
2,350
sqft
|
built
2006
3910 W Goldmine Mountain Dr, San Tan Valley, AZ 85144
$-647
Cash flow
-7.4%
Cash-on-Cash Return
4.0%
Cap rate
0.5%
Rent to Value Ratio
Active
$1,142,000
3
bds
|
3
ba
|
2,414
sqft
|
built
1950
1208 E Tuckey Ln, Phoenix, AZ 85014
$-3,274
Cash flow
-15.0%
Cash-on-Cash Return
2.2%
Cap rate
0.3%
Rent to Value Ratio
Active
$460,000
3
bds
|
2
ba
|
1,632
sqft
|
built
2021
5724 N 108th Ave, Phoenix, AZ 85037
$-1,151
Cash flow
-13.1%
Cash-on-Cash Return
2.7%
Cap rate
0.4%
Rent to Value Ratio
Active
$280,000
2
bds
|
1
ba
|
783
sqft
|
built
1975
6739 N 16th St, Phoenix, AZ 85016
$-607
Cash flow
-11.3%
Cash-on-Cash Return
3.1%
Cap rate
0.5%
Rent to Value Ratio
Active
$879,000
5
bds
|
3
ba
|
2,997
sqft
|
built
2001
2041 E Palm Beach Dr, Chandler, AZ 85249
$-2,286
Cash flow
-13.6%
Cash-on-Cash Return
2.6%
Cap rate
0.4%
Rent to Value Ratio
Active
$439,900
5
bds
|
3
ba
|
2,988
sqft
|
built
2006
567 E Tropical Dr, Casa Grande, AZ 85122
$-842
Cash flow
-10.0%
Cash-on-Cash Return
3.4%
Cap rate
0.5%
Rent to Value Ratio
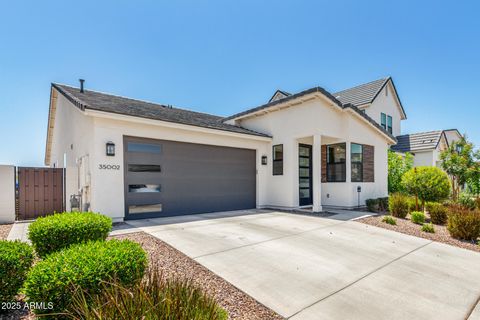
Active
$539,900
4
bds
|
3
ba
|
2,003
sqft
|
built
2023
35002 N Augite Way, San Tan Valley, AZ 85144
$-787
Cash flow
-7.6%
Cash-on-Cash Return
3.9%
Cap rate
0.6%
Rent to Value Ratio
Active
$725,000
4
bds
|
2
ba
|
2,278
sqft
|
built
1992
5731 W Gail Dr, Chandler, AZ 85226
$-1,782
Cash flow
-12.8%
Cash-on-Cash Return
2.7%
Cap rate
0.4%
Rent to Value Ratio
Active
$860,000
3
bds
|
3
ba
|
2,939
sqft
|
built
2003
3225 E Cardinal Ct, Chandler, AZ 85286
$-2,449
Cash flow
-14.9%
Cash-on-Cash Return
2.8%
Cap rate
0.4%
Rent to Value Ratio

Active
$2,699,900
5
bds
|
5
ba
|
4,057
sqft
|
built
1981
8001 E Voltaire Ave, Scottsdale, AZ 85260
$-9,236
Cash flow
-17.8%
Cash-on-Cash Return
1.6%
Cap rate
0.2%
Rent to Value Ratio
Active
$530,000
2
bds
|
2
ba
|
1,867
sqft
|
built
2003
12642 N Mountainside Dr, Fountain Hills, AZ 85268
$-704
Cash flow
-6.9%
Cash-on-Cash Return
4.1%
Cap rate
0.5%
Rent to Value Ratio
Active
$599,000
3
bds
|
2
ba
|
1,462
sqft
|
built
1957
1209 W Colter St, Phoenix, AZ 85013
$-590
Cash flow
-5.1%
Cash-on-Cash Return
4.5%
Cap rate
0.6%
Rent to Value Ratio

Active
$589,999
3
bds
|
4
ba
|
2,648
sqft
|
built
2002
3150 E Beardsley Rd, Phoenix, AZ 85050
$-1,400
Cash flow
-12.4%
Cash-on-Cash Return
2.8%
Cap rate
0.5%
Rent to Value Ratio
Active
$715,000
6
bds
|
3
ba
|
2,956
sqft
|
built
2001
4331 E Redwood Ln, Phoenix, AZ 85048
$-1,478
Cash flow
-10.8%
Cash-on-Cash Return
3.2%
Cap rate
0.4%
Rent to Value Ratio
Active
$335,000
2
bds
|
2
ba
|
1,000
sqft
|
built
1980
4554 E Paradise Village Pkwy N, Phoenix, AZ 85032
$-876
Cash flow
-13.6%
Cash-on-Cash Return
3.1%
Cap rate
0.5%
Rent to Value Ratio