Baton Rouge, LA Investment Properties for Sale
Browse homes for sale and investment properties in Baton Rouge, LA. Refine your search by price, property type, or more.
Best cash flowing properties in Baton Rouge, LA
Active
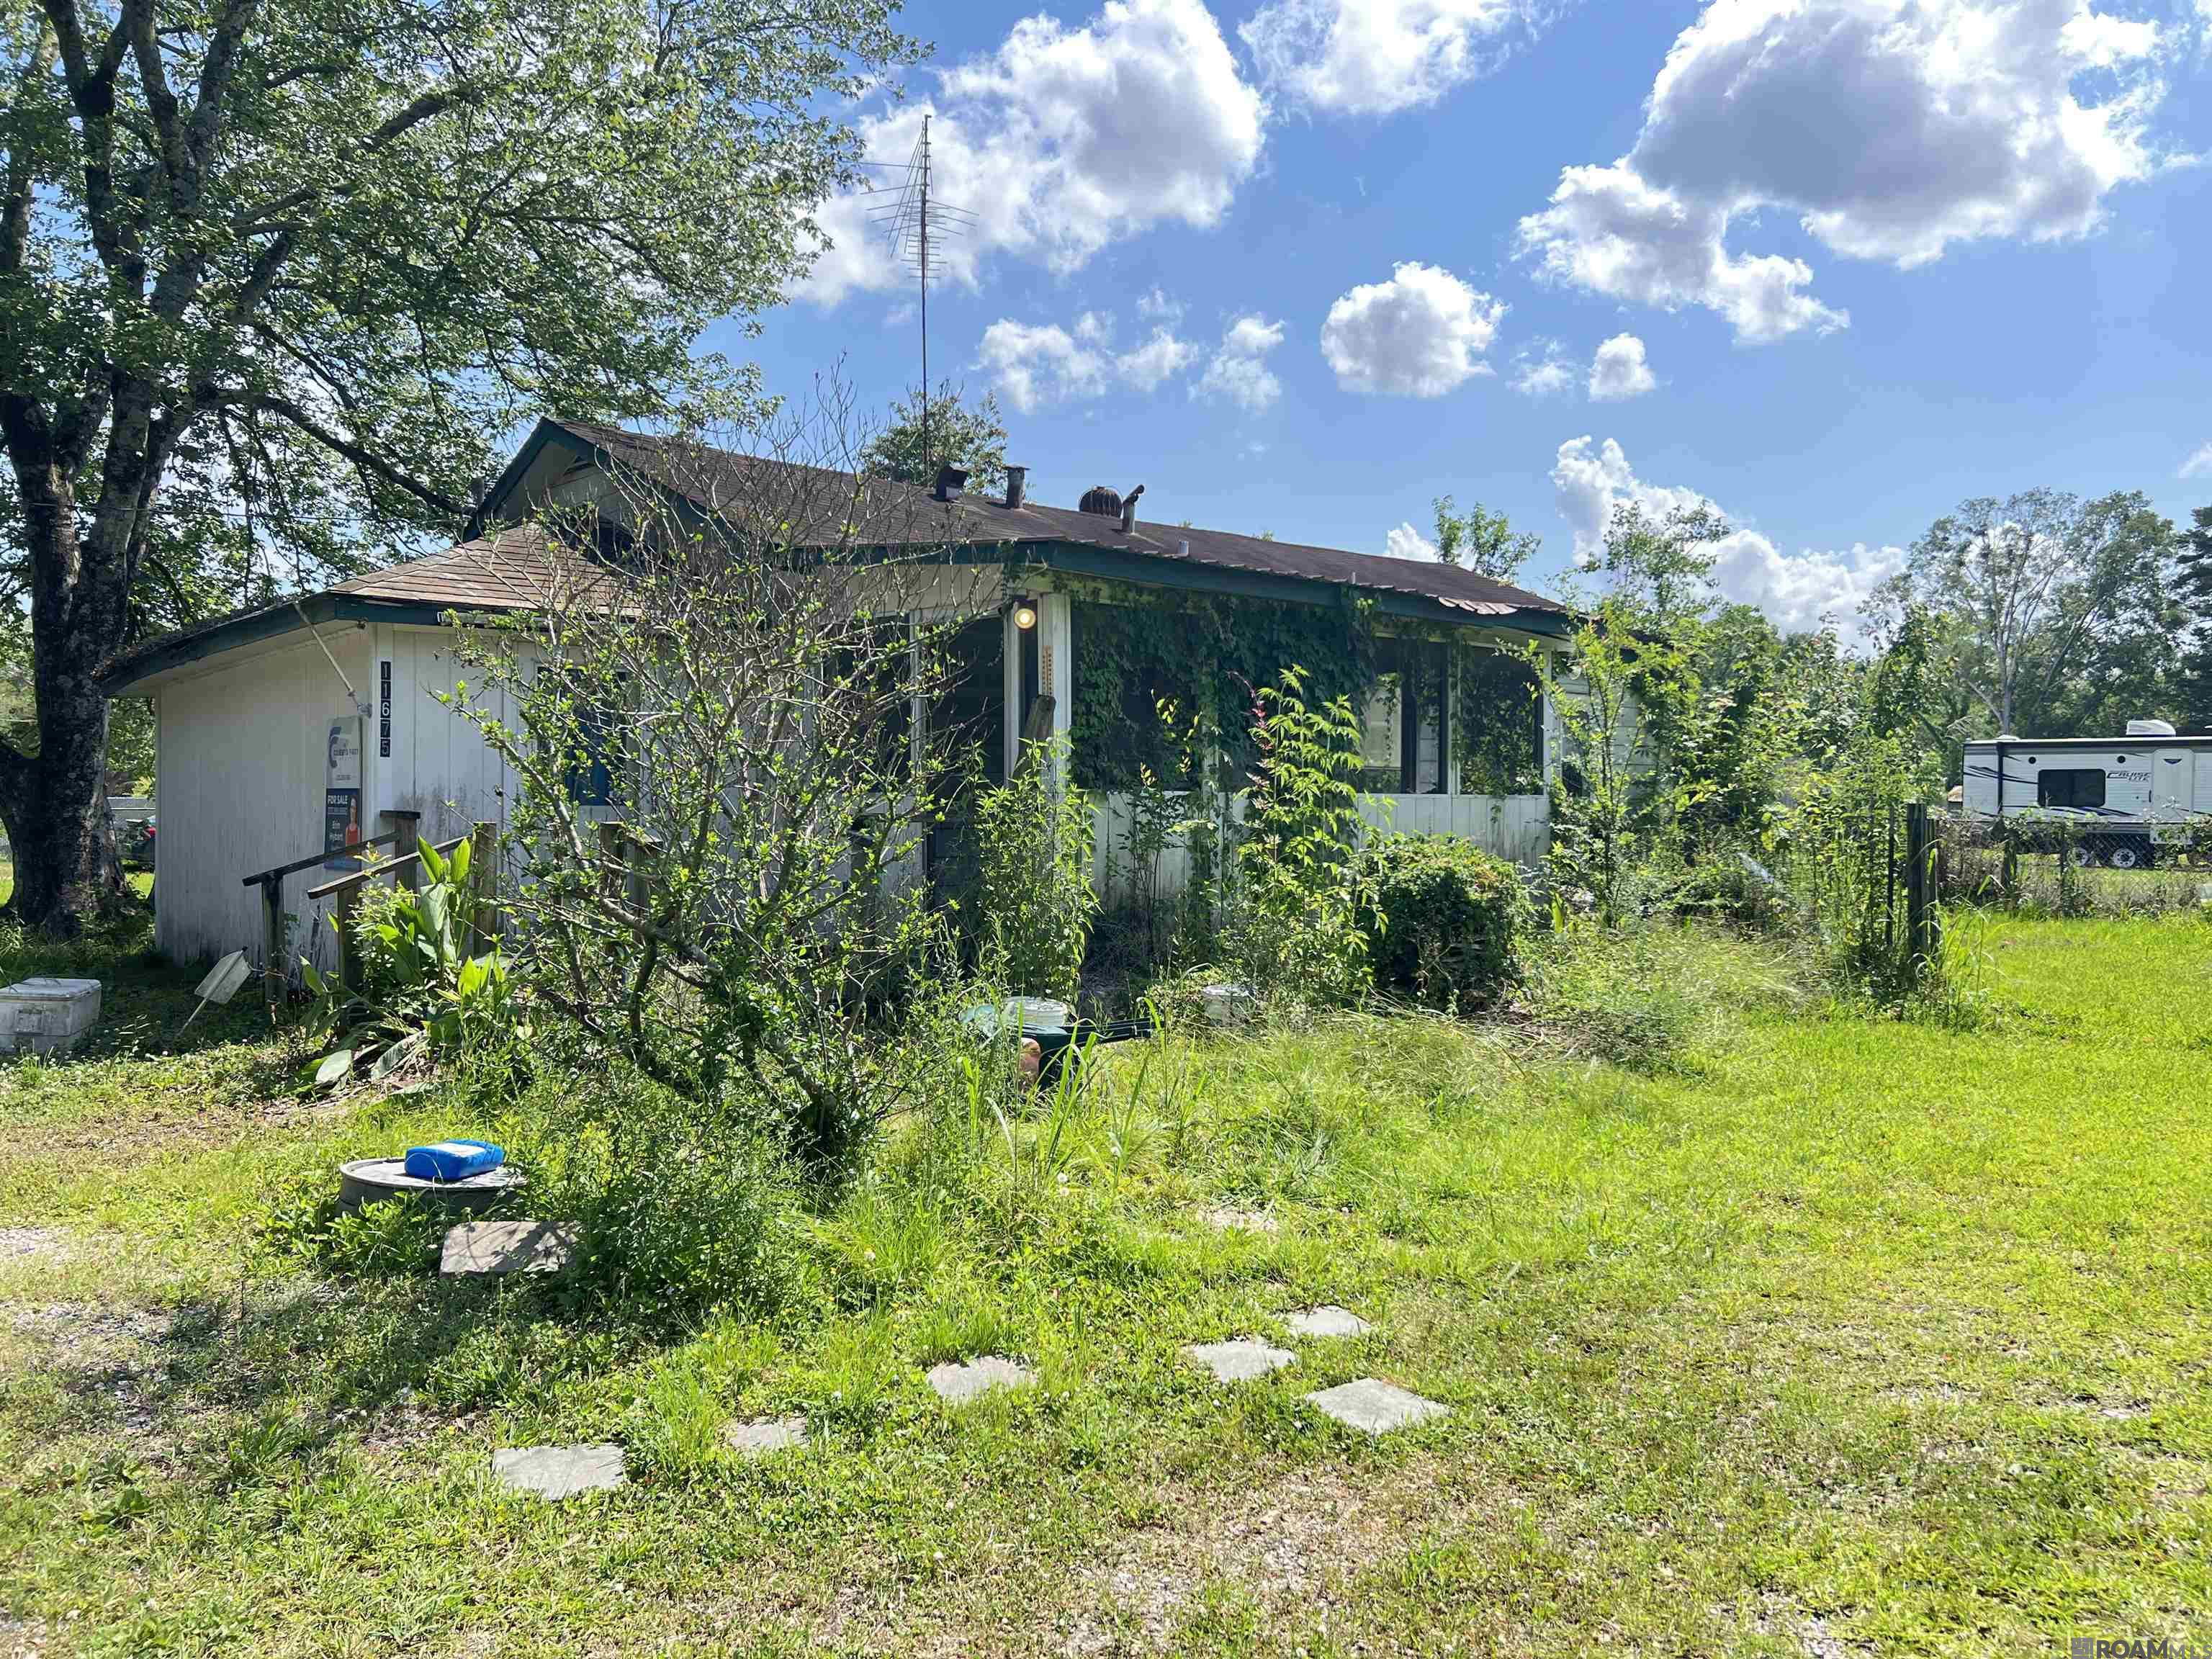
$49,990
2
bds
|
1
ba
|
830
sqft
|
built
1975
11675 Ellen Dr, Baton Rouge, LA 70811
$897
Cash flow
20.9%
Cash-on-Cash Return
21.5%
Cap rate
2.6%
Rent to Value Ratio

Active
$60,000
2
bds
|
1
ba
|
1,234
sqft
|
built
1970
5089 Sycamore St, Baton Rouge, LA 70805
$828
Cash flow
16.1%
Cash-on-Cash Return
16.6%
Cap rate
2.0%
Rent to Value Ratio
986 out of 1,271 properties for sale in Baton Rouge, LA
Limited Results Shown
Create a free account, or log in to reveal all property listings and enjoy the complete experience.
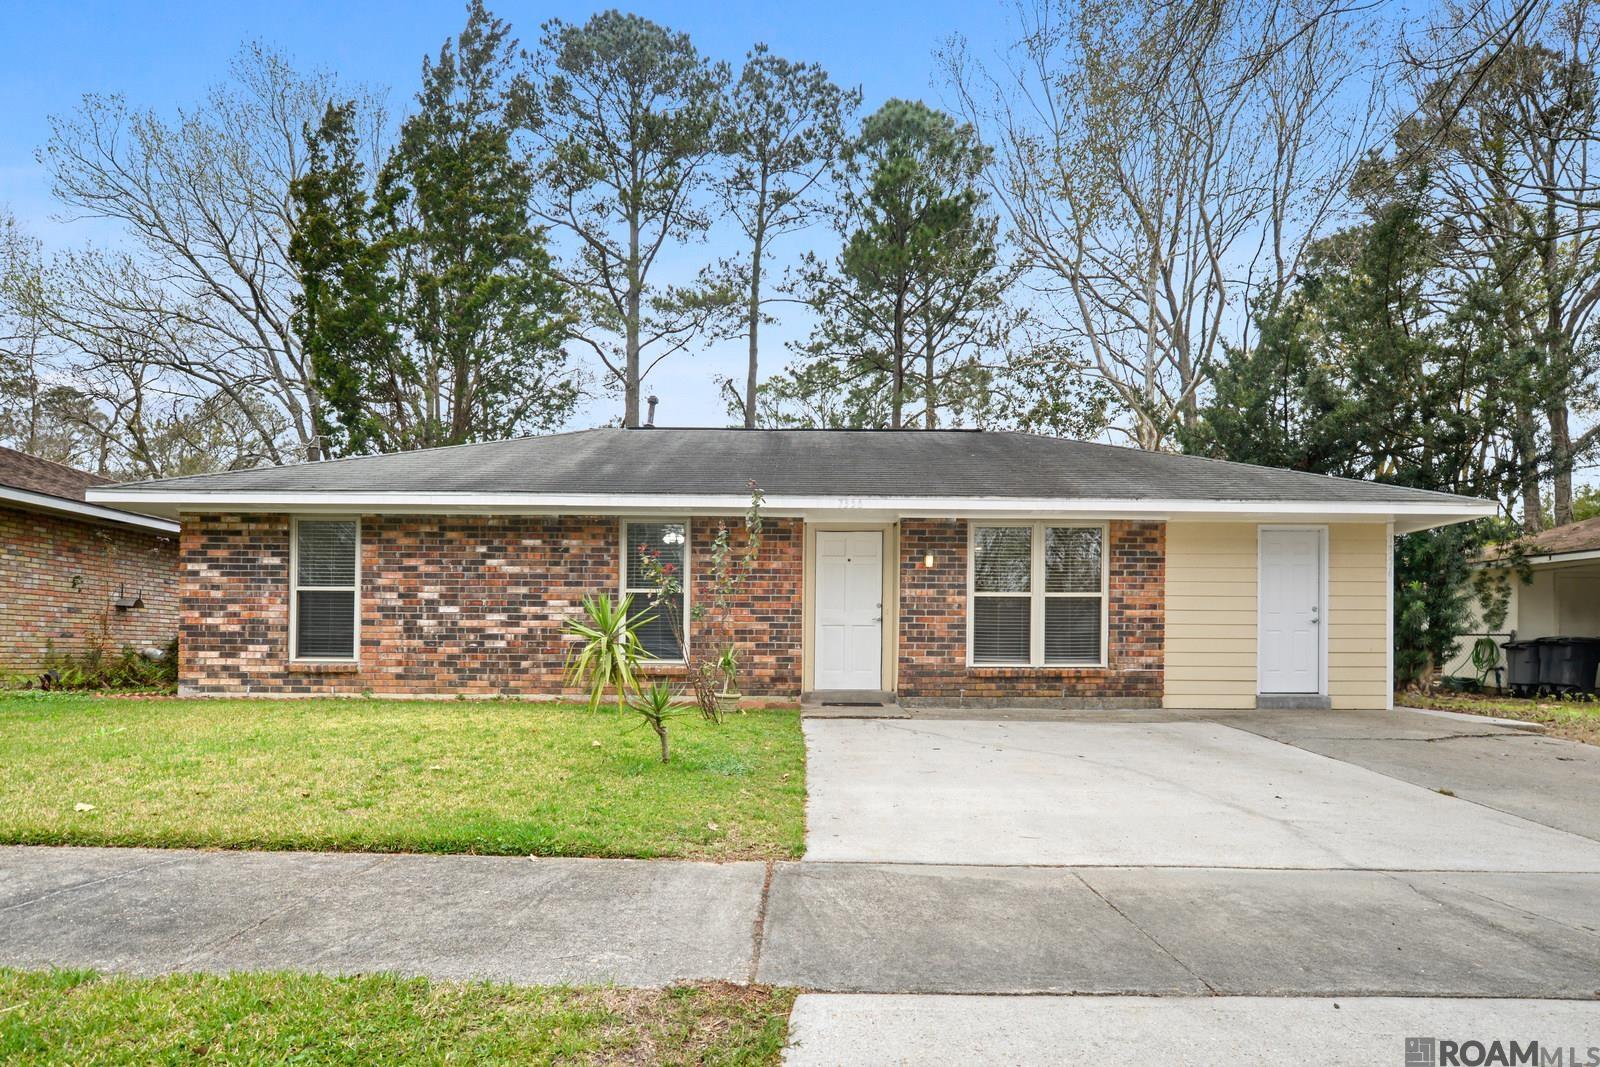
Active
$155,000
3
bds
|
2
ba
|
1,185
sqft
|
built
1982
5224 Cumberland Cove Dr, Baton Rouge, LA 70817
$133
Cash flow
4.5%
Cash-on-Cash Return
7.3%
Cap rate
0.9%
Rent to Value Ratio
Active
$199,000
4
bds
|
2
ba
|
1,330
sqft
|
built
1977
7356 Meadowview Ave, Baton Rouge, LA 70810
$200
Cash flow
5.2%
Cash-on-Cash Return
7.5%
Cap rate
0.9%
Rent to Value Ratio

Active
$90,000
3
bds
|
2
ba
|
1,400
sqft
|
built
1950
6525 Village St, Baton Rouge, LA 70807
$357
Cash flow
20.7%
Cash-on-Cash Return
11.0%
Cap rate
1.3%
Rent to Value Ratio
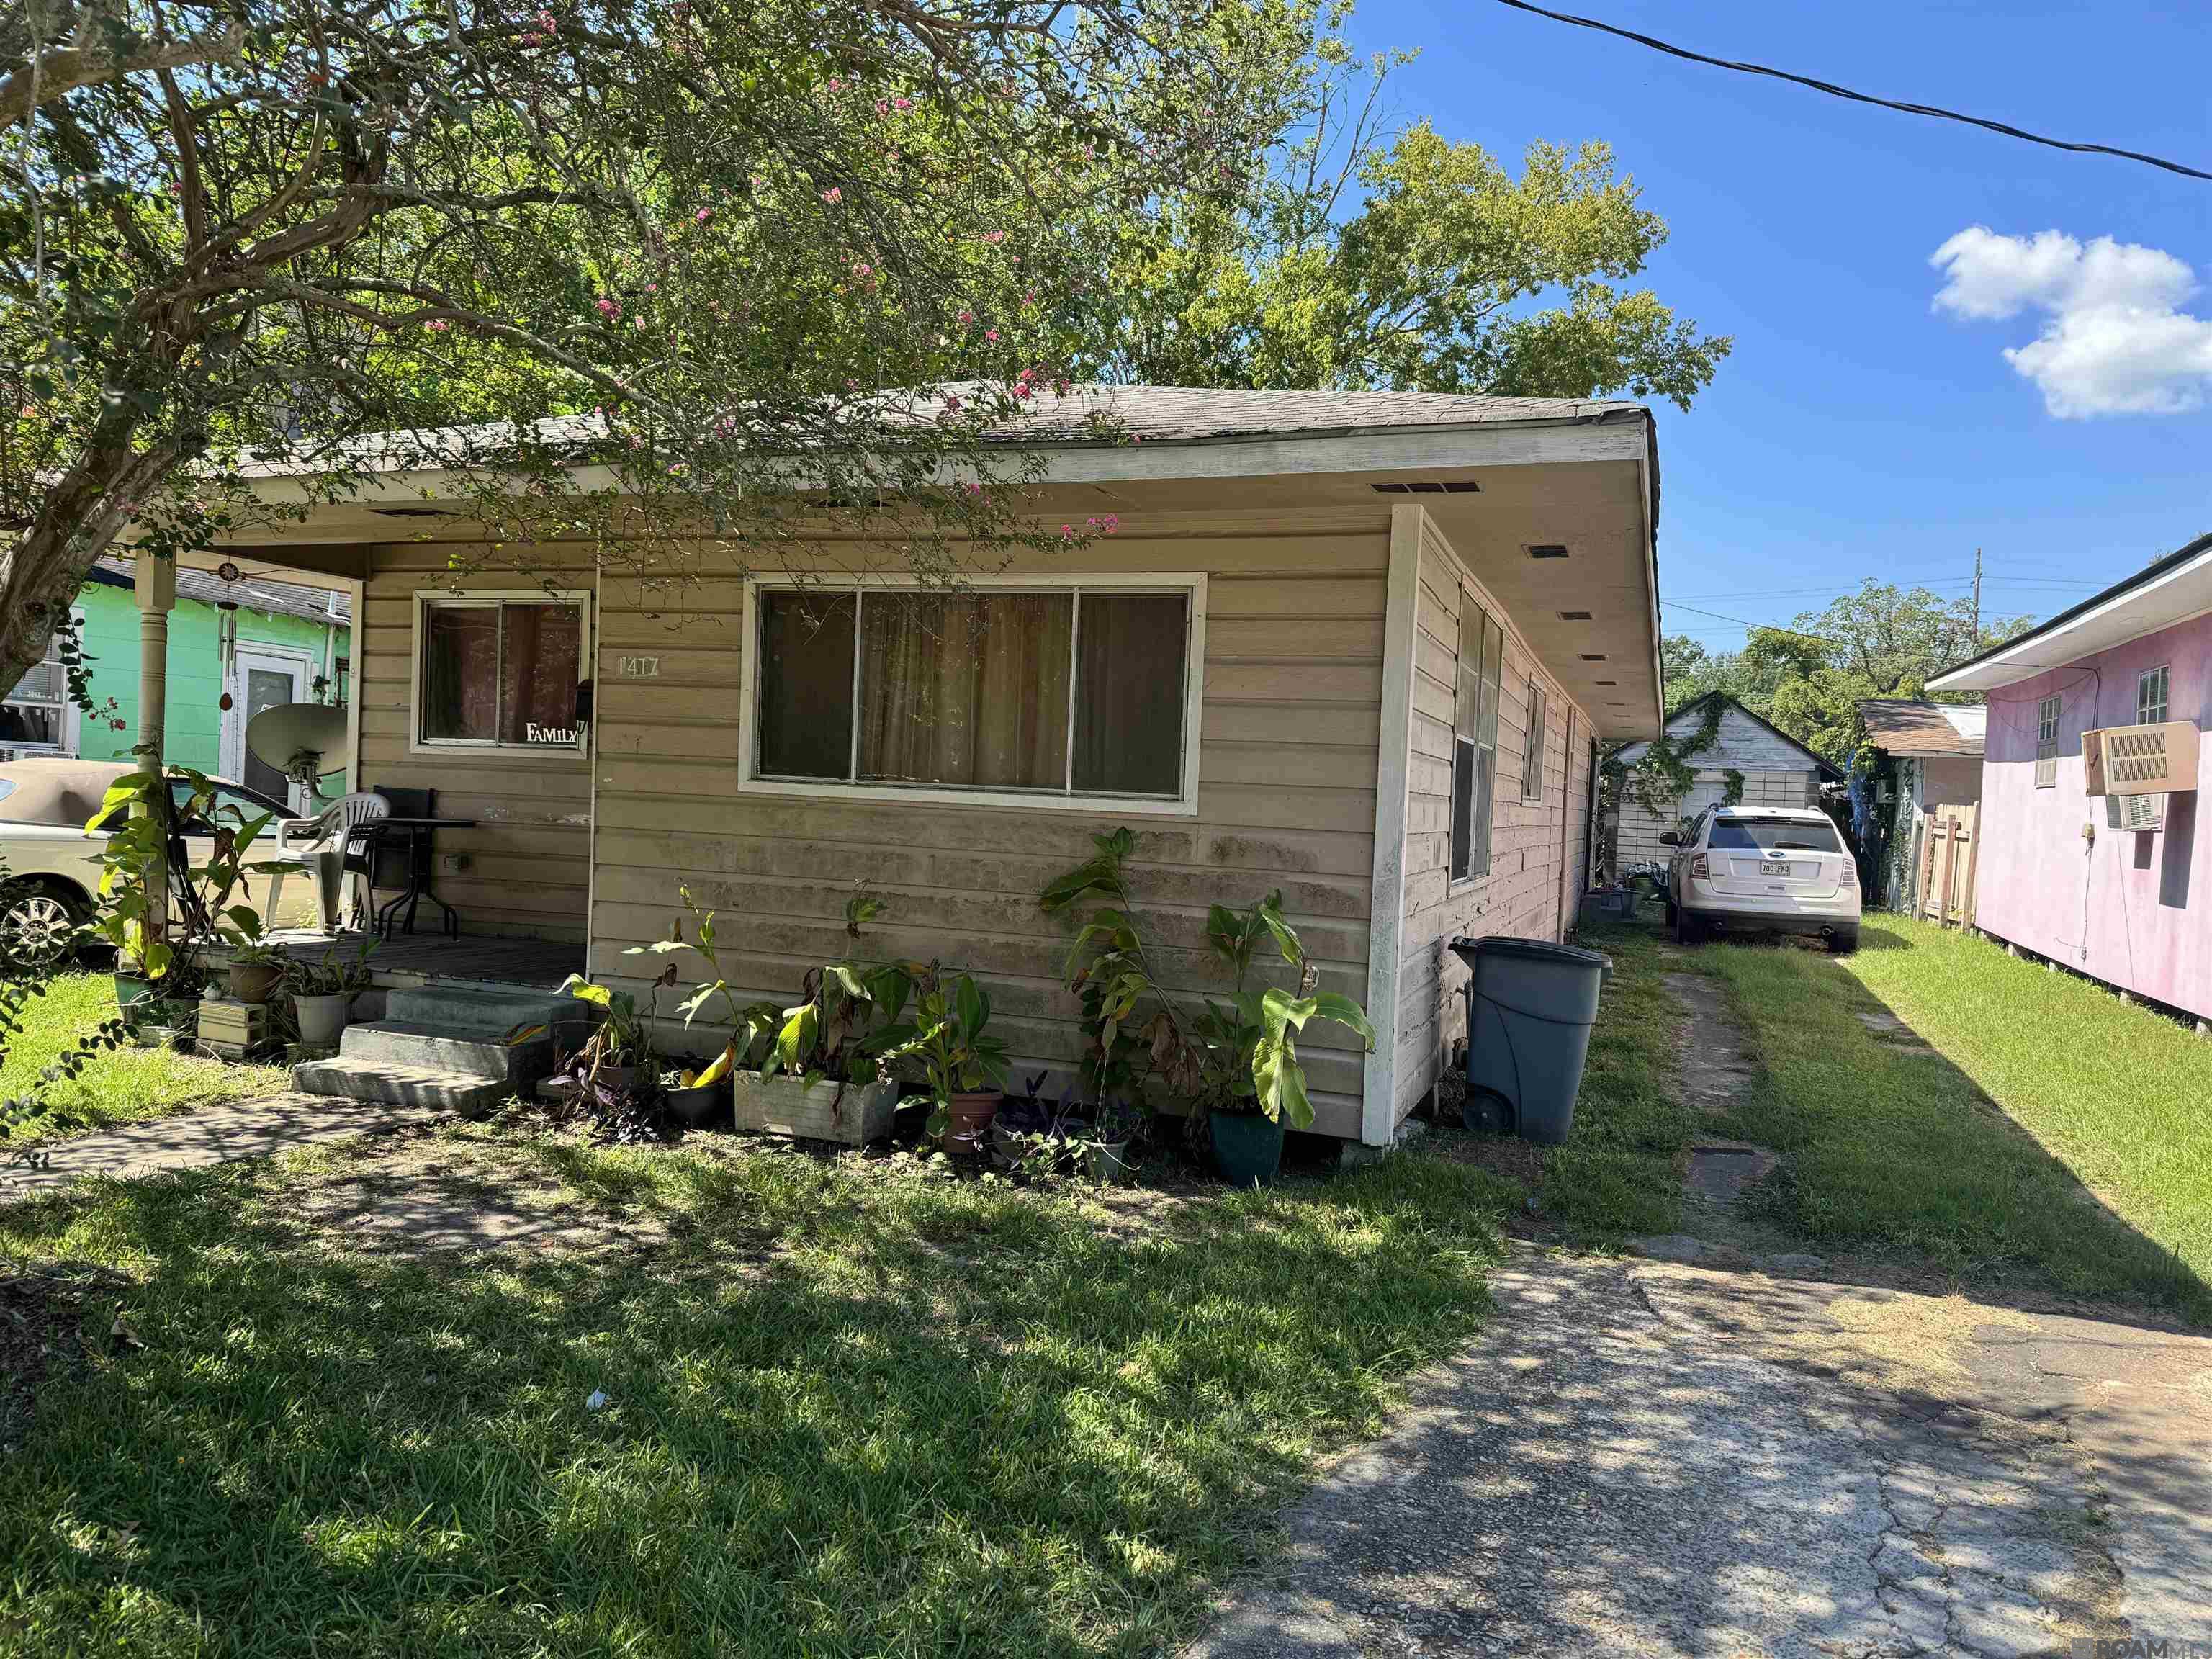
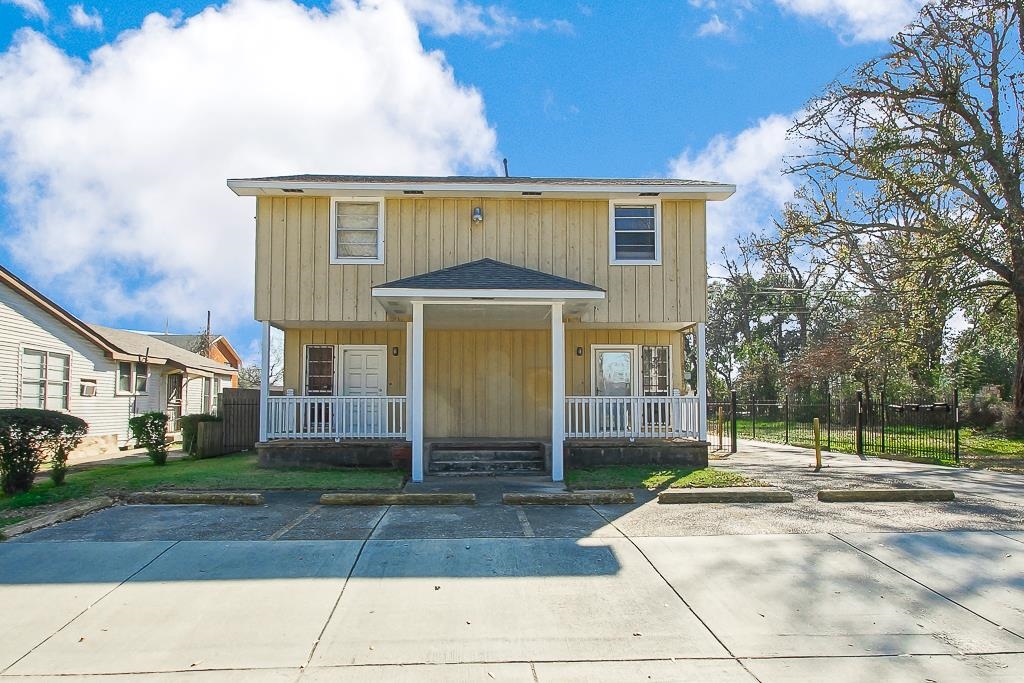
Active
$55,000
4
bds
|
2
ba
|
1,463
sqft
|
built
1965
1417 N 47th St, Baton Rouge, LA 70802
$759
Cash flow
16.1%
Cash-on-Cash Return
16.6%
Cap rate
2.0%
Rent to Value Ratio
Active
$299,500
3
bds
|
2
ba
|
1,894
sqft
|
built
1975
2413 Guilford Dr, Baton Rouge, LA 70808
$-188
Cash flow
-3.3%
Cash-on-Cash Return
5.5%
Cap rate
0.7%
Rent to Value Ratio

Active
$319,000
3
bds
|
2
ba
|
1,872
sqft
|
built
1998
18315 Lake Myrtle Dr, Baton Rouge, LA 70817
$-97
Cash flow
-1.6%
Cash-on-Cash Return
5.9%
Cap rate
0.7%
Rent to Value Ratio
Active
$269,900
3
bds
|
2
ba
|
2,000
sqft
|
built
1963
10431 Goodwood Blvd, Baton Rouge, LA 70815
$-33
Cash flow
-0.6%
Cash-on-Cash Return
6.1%
Cap rate
0.7%
Rent to Value Ratio
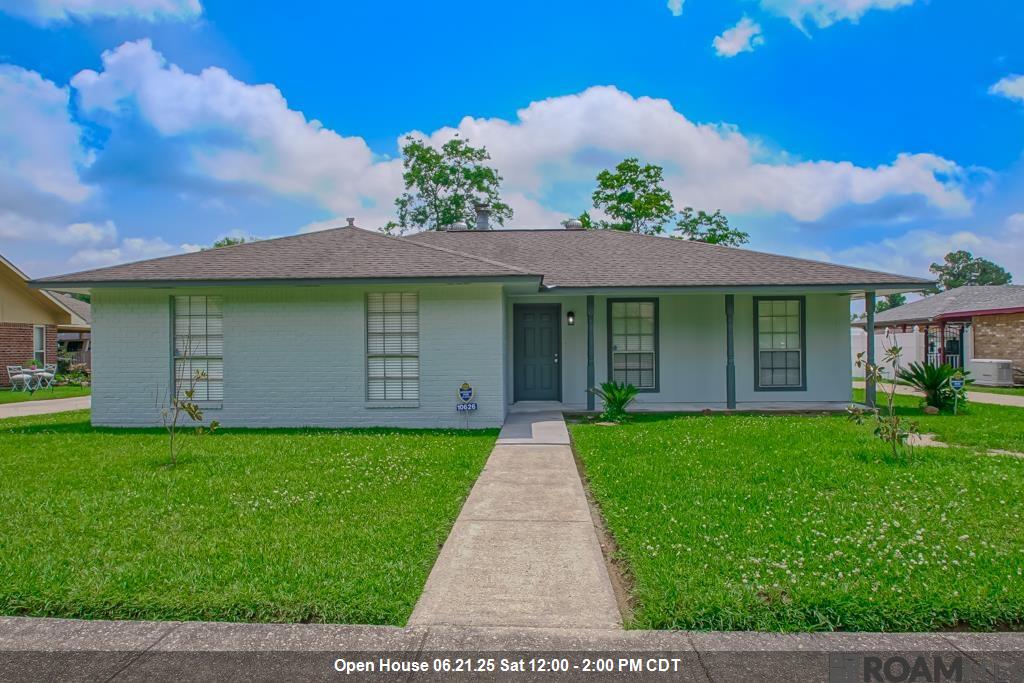
Active
$210,000
3
bds
|
2
ba
|
1,399
sqft
|
built
1984
10626 Clearview Ave, Baton Rouge, LA 70811
$4
Cash flow
0.1%
Cash-on-Cash Return
6.3%
Cap rate
0.8%
Rent to Value Ratio
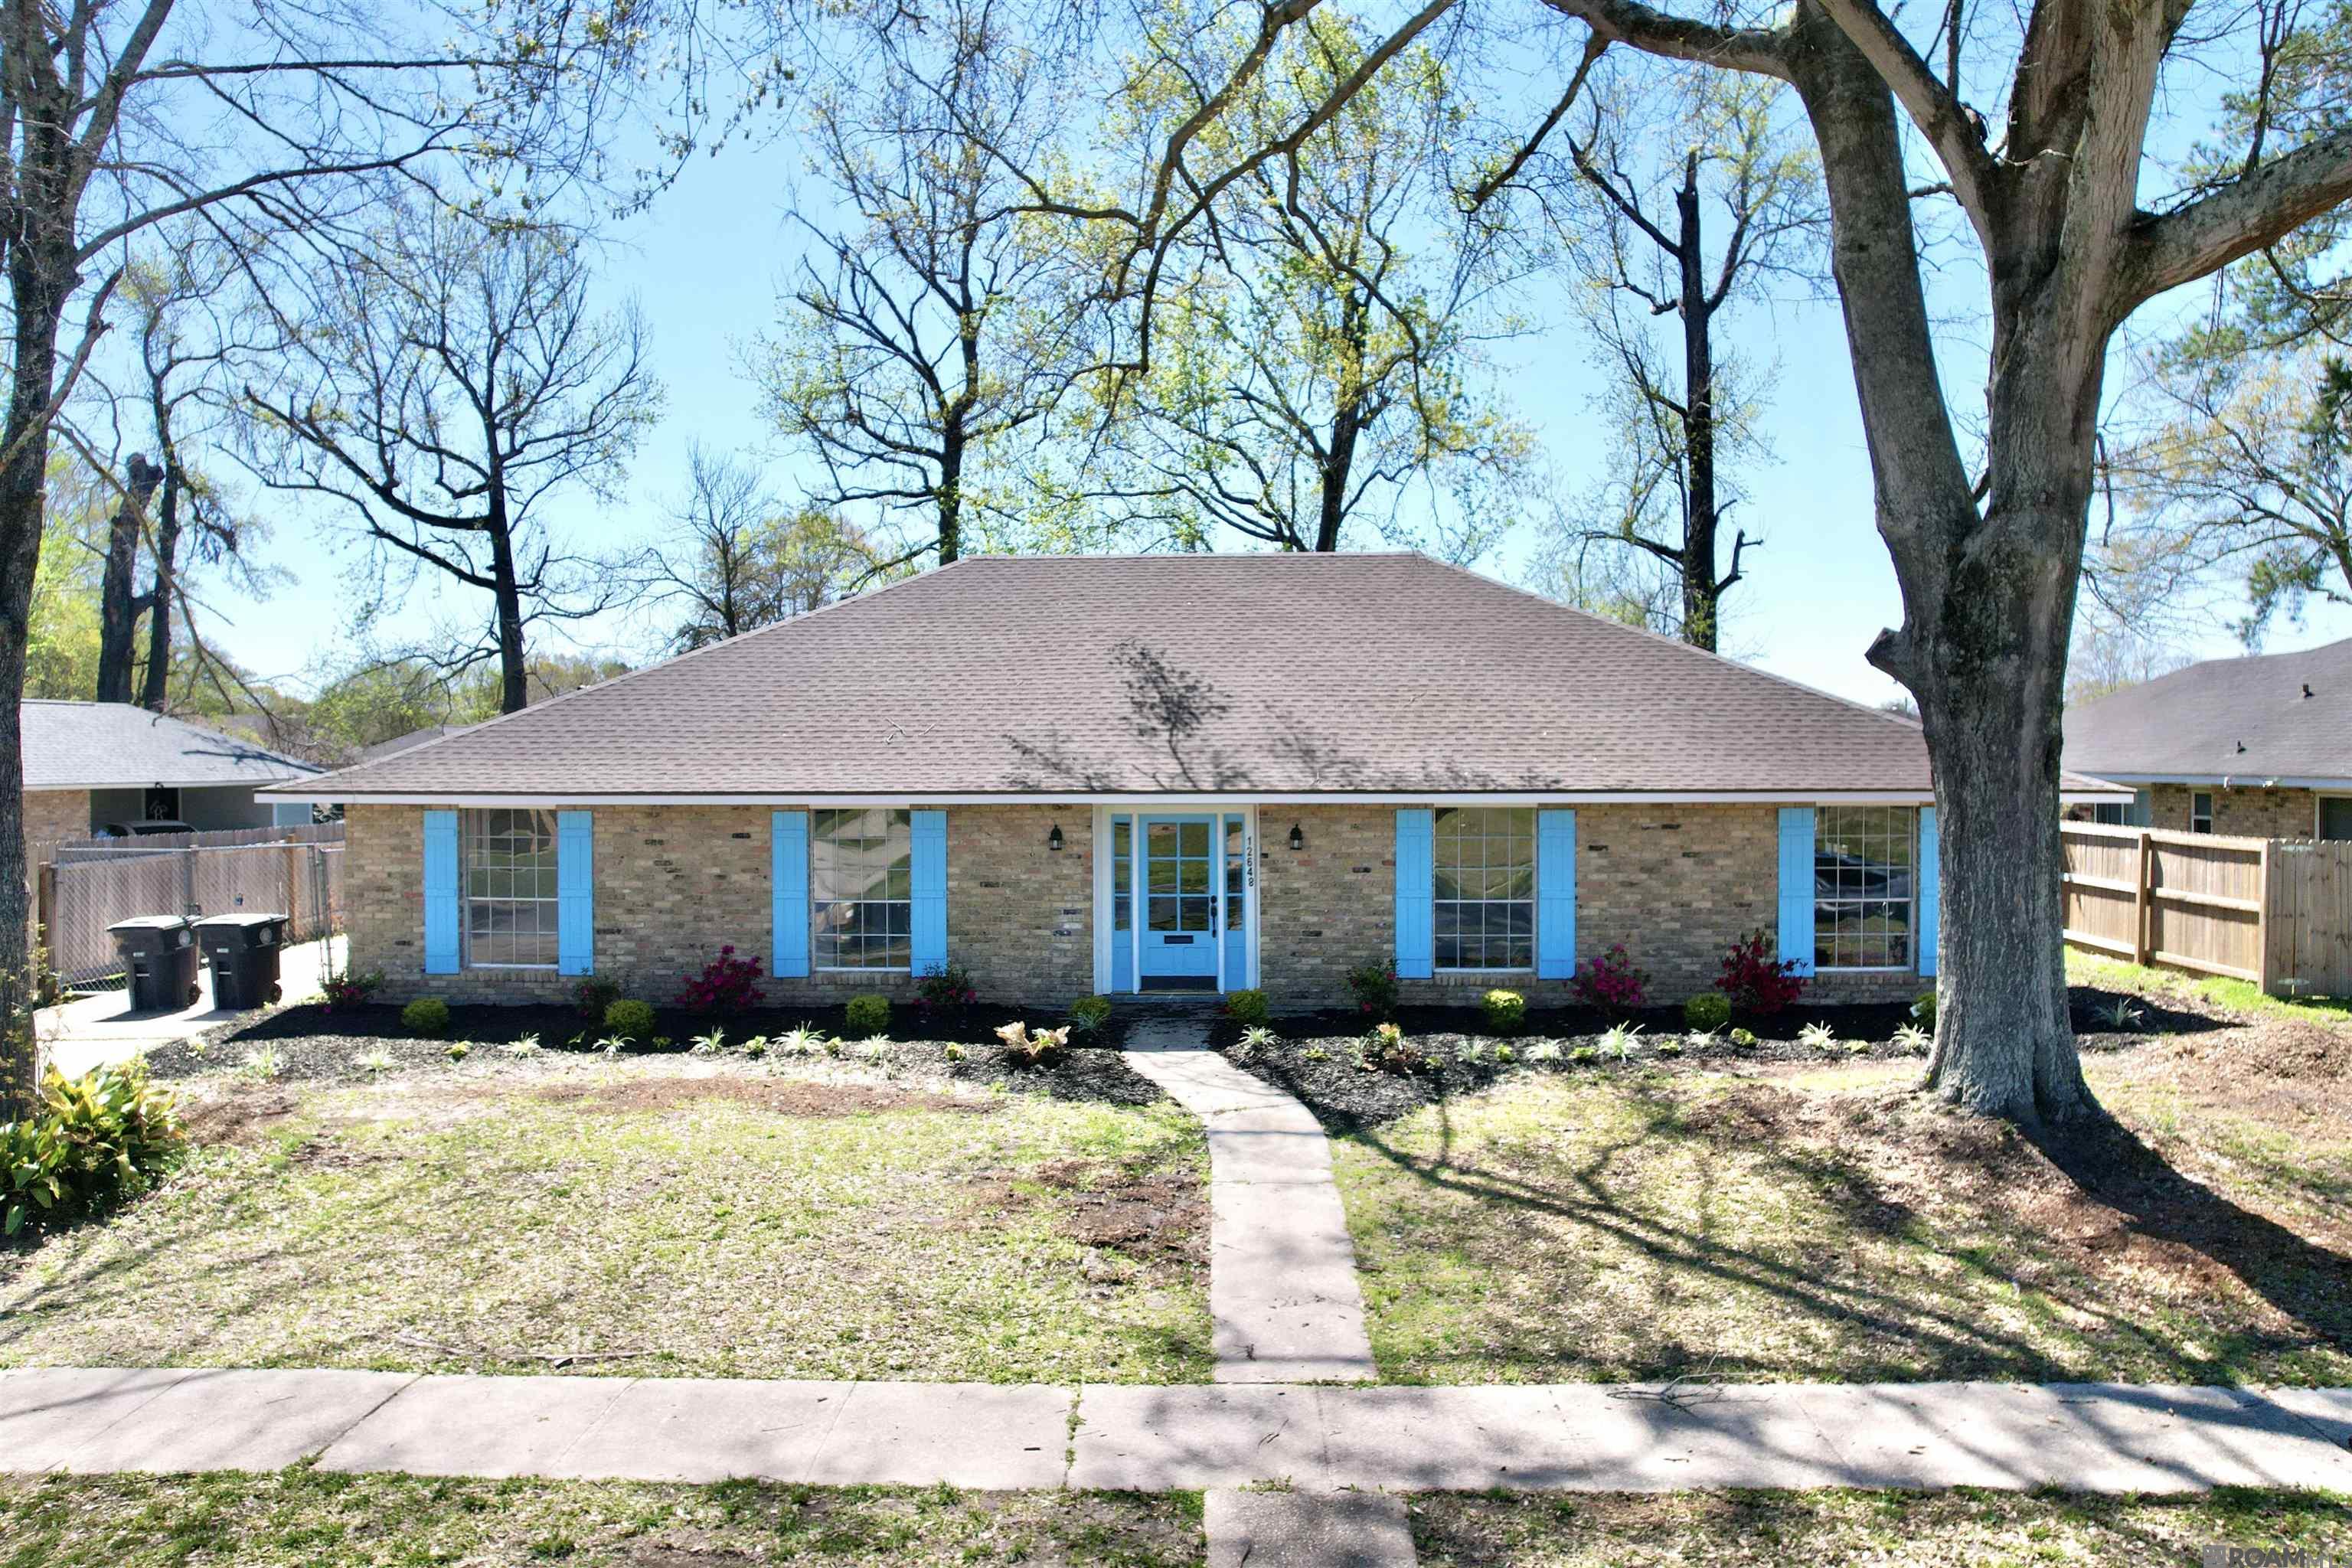
Active
$279,700
4
bds
|
3
ba
|
2,505
sqft
|
built
1966
12648 Mollylea Dr, Baton Rouge, LA 70815
$53
Cash flow
1.0%
Cash-on-Cash Return
6.5%
Cap rate
0.8%
Rent to Value Ratio
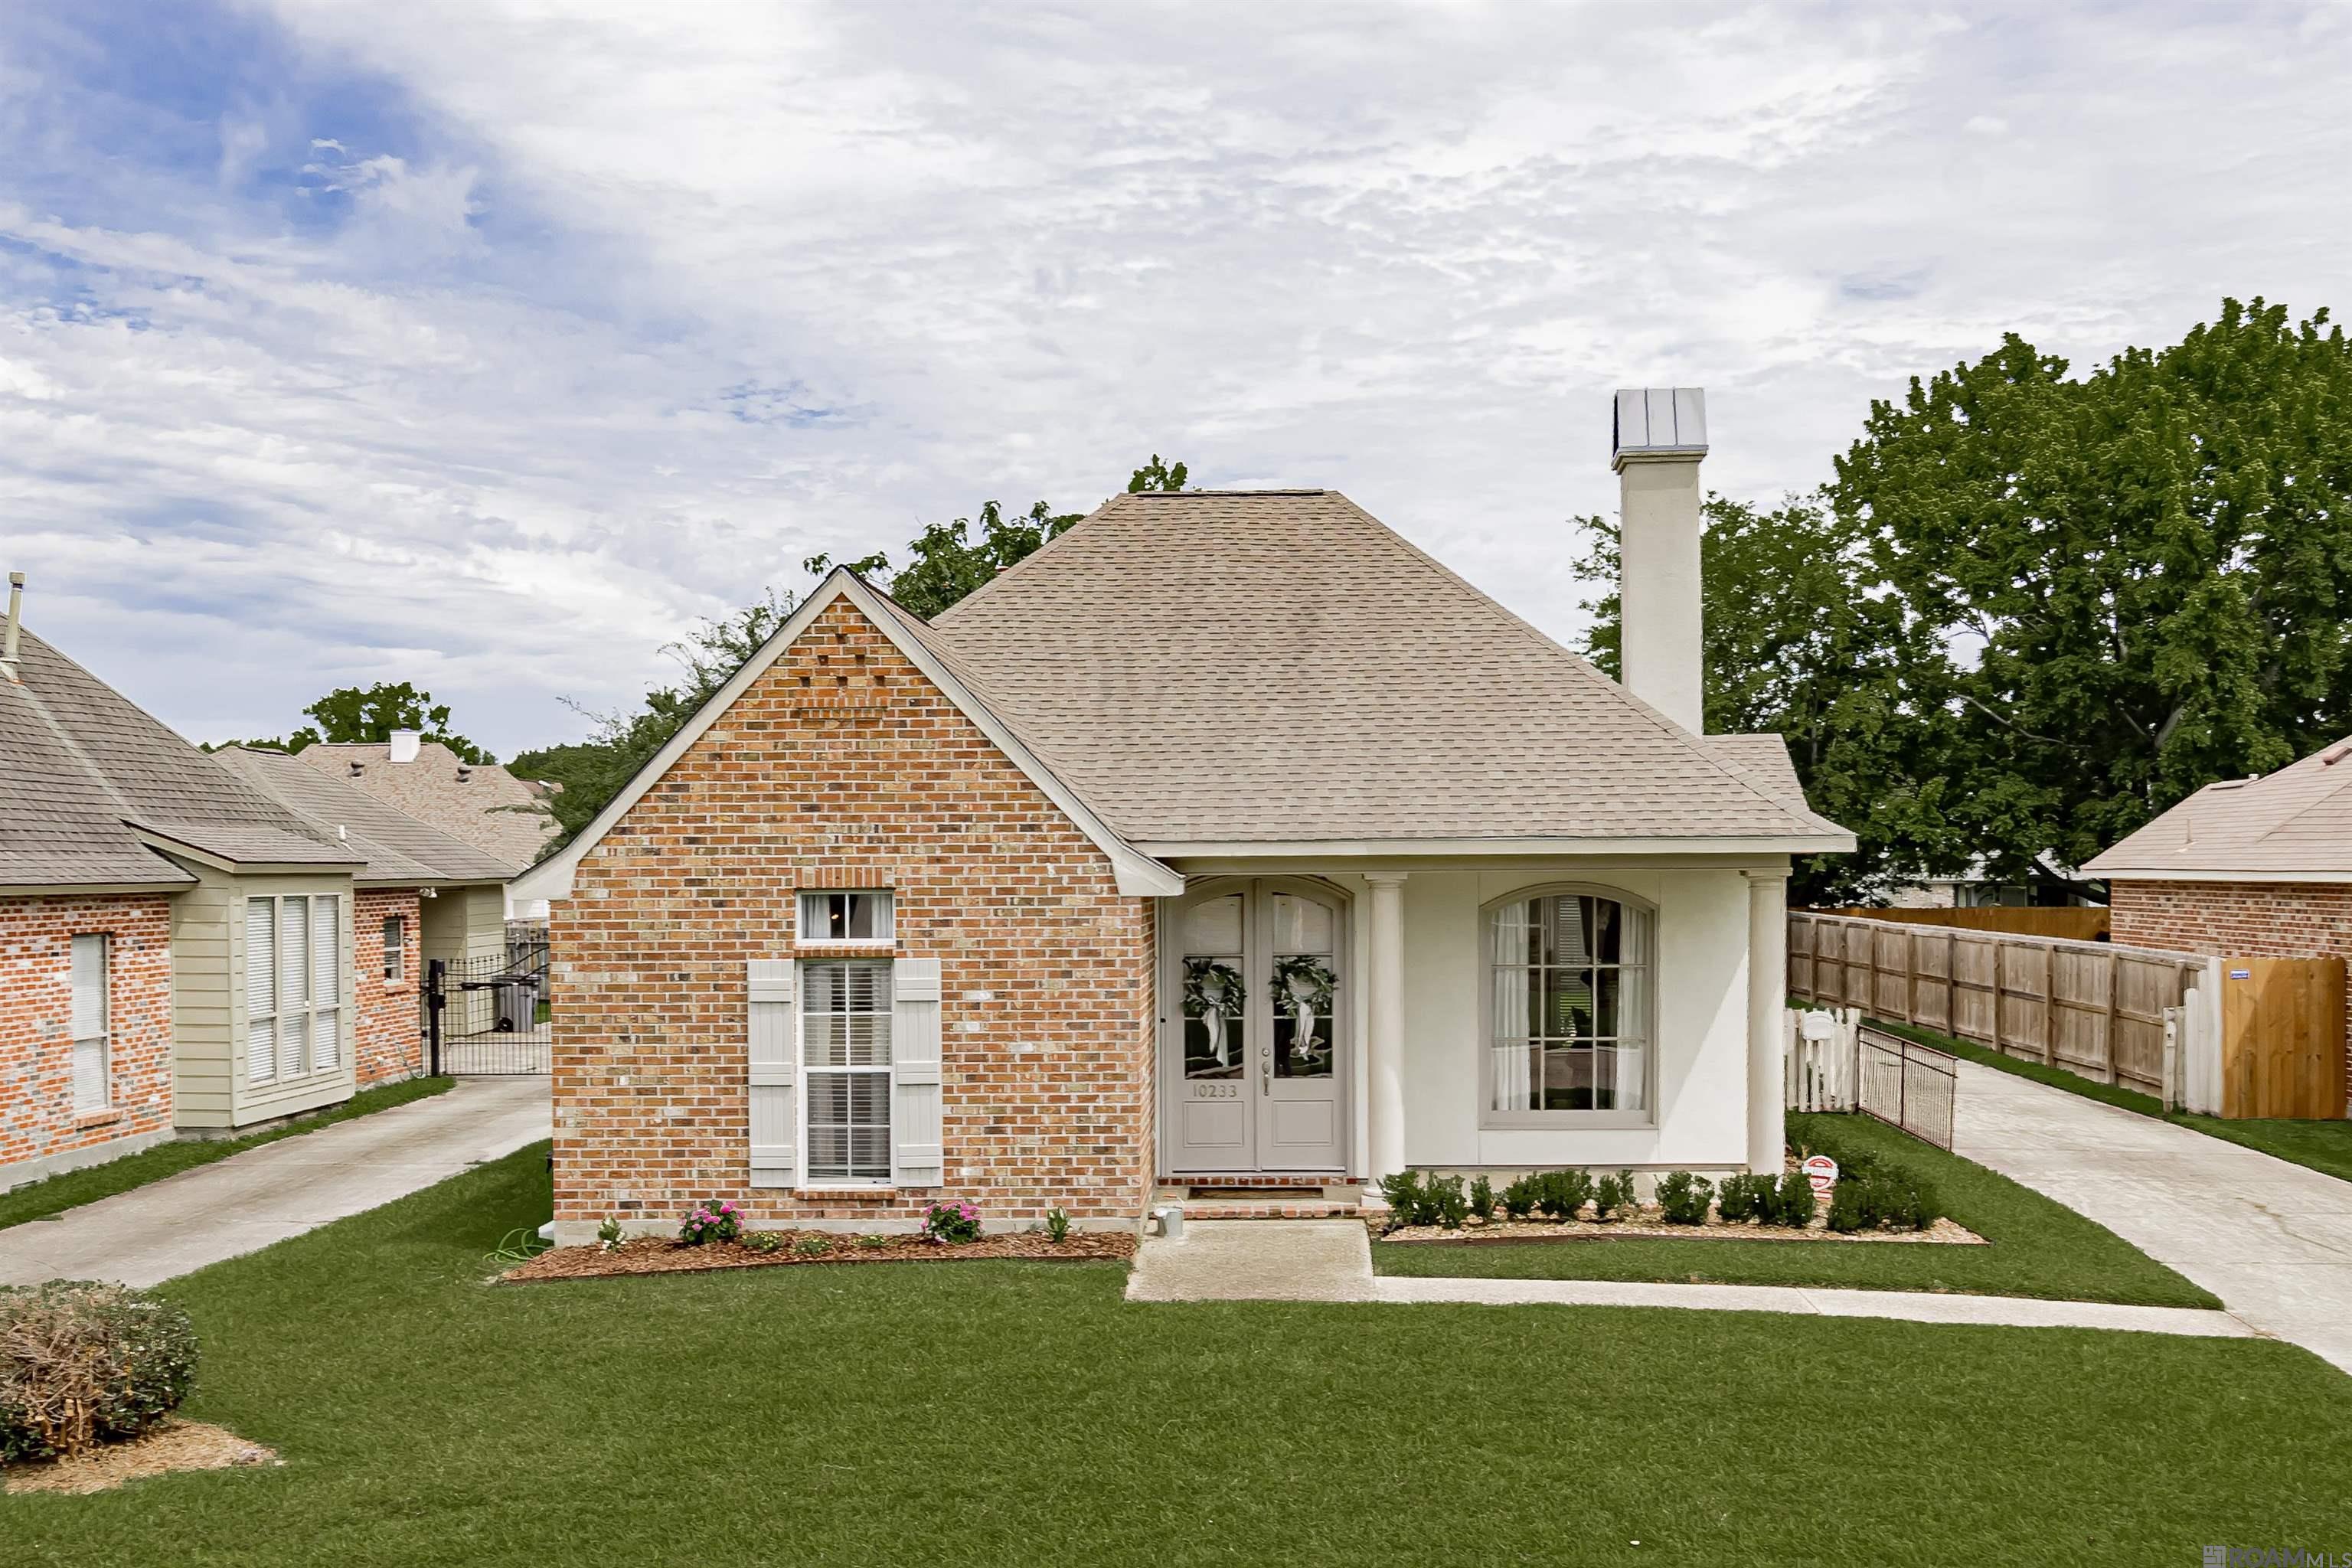
Pending
$312,000
3
bds
|
2
ba
|
1,587
sqft
|
built
2001
10233 Springpark Ave, Baton Rouge, LA 70810
$-149
Cash flow
-2.5%
Cash-on-Cash Return
5.7%
Cap rate
0.7%
Rent to Value Ratio
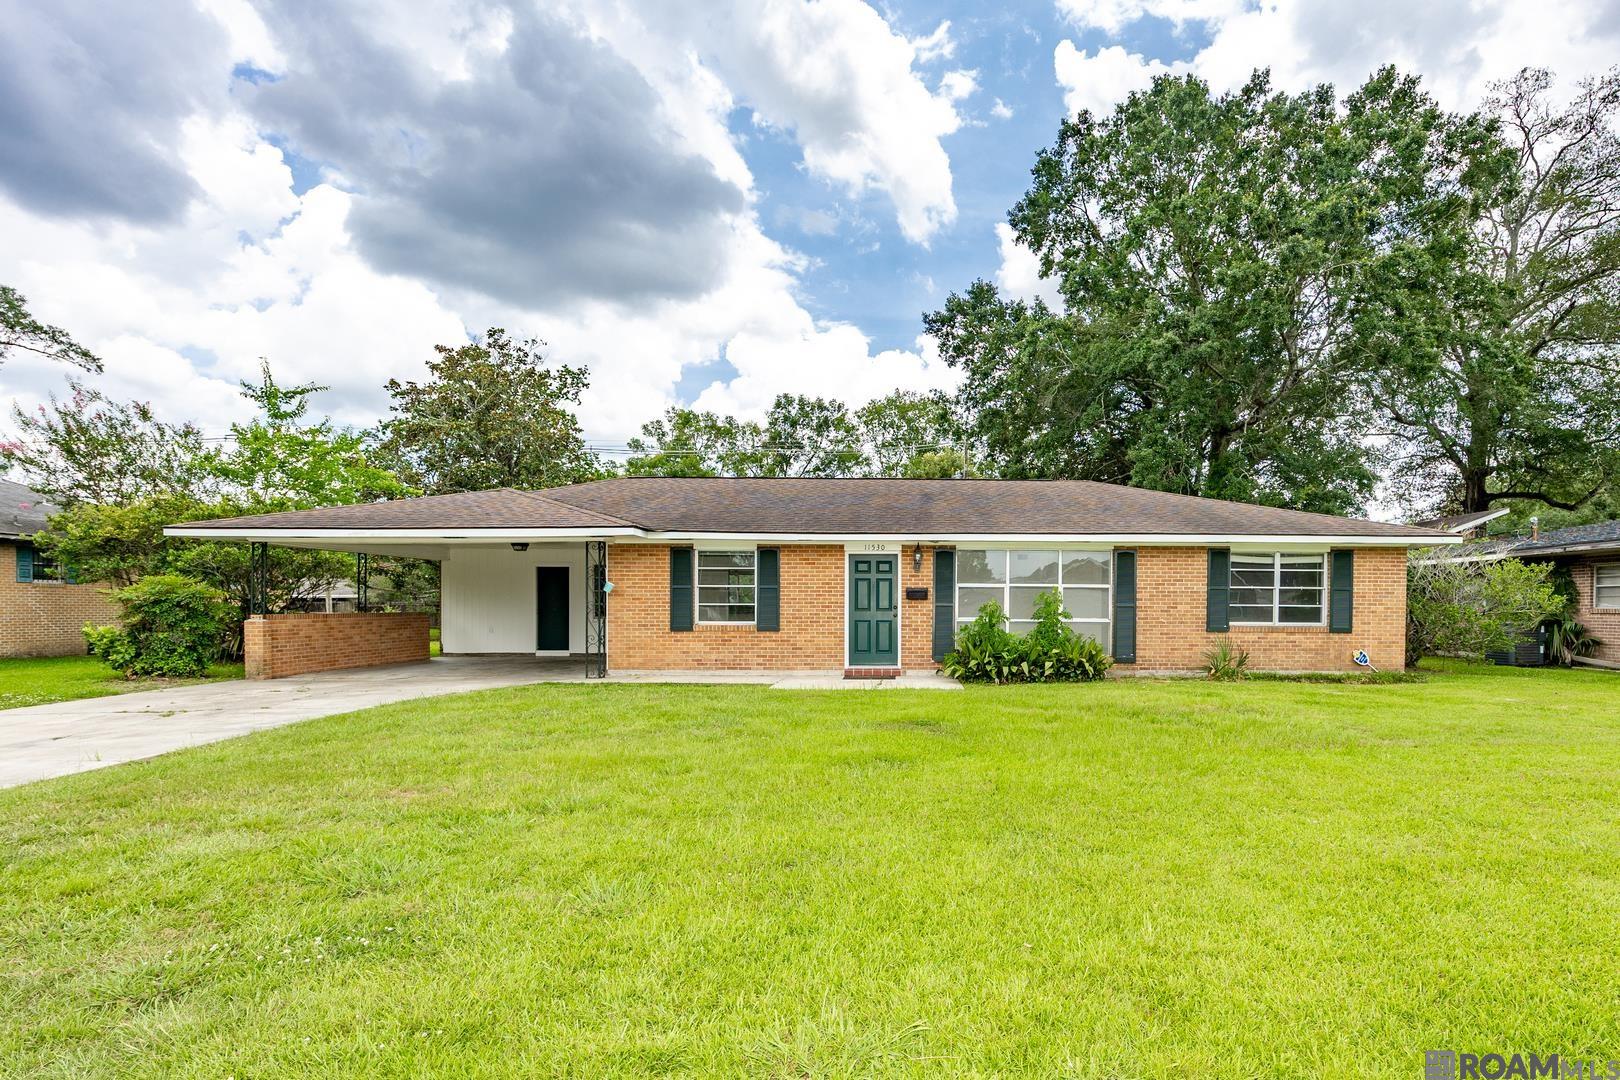
Pending
$199,000
3
bds
|
2
ba
|
1,702
sqft
|
built
1958
11530 Archery Dr, Baton Rouge, LA 70815
$62
Cash flow
1.6%
Cash-on-Cash Return
6.7%
Cap rate
0.8%
Rent to Value Ratio
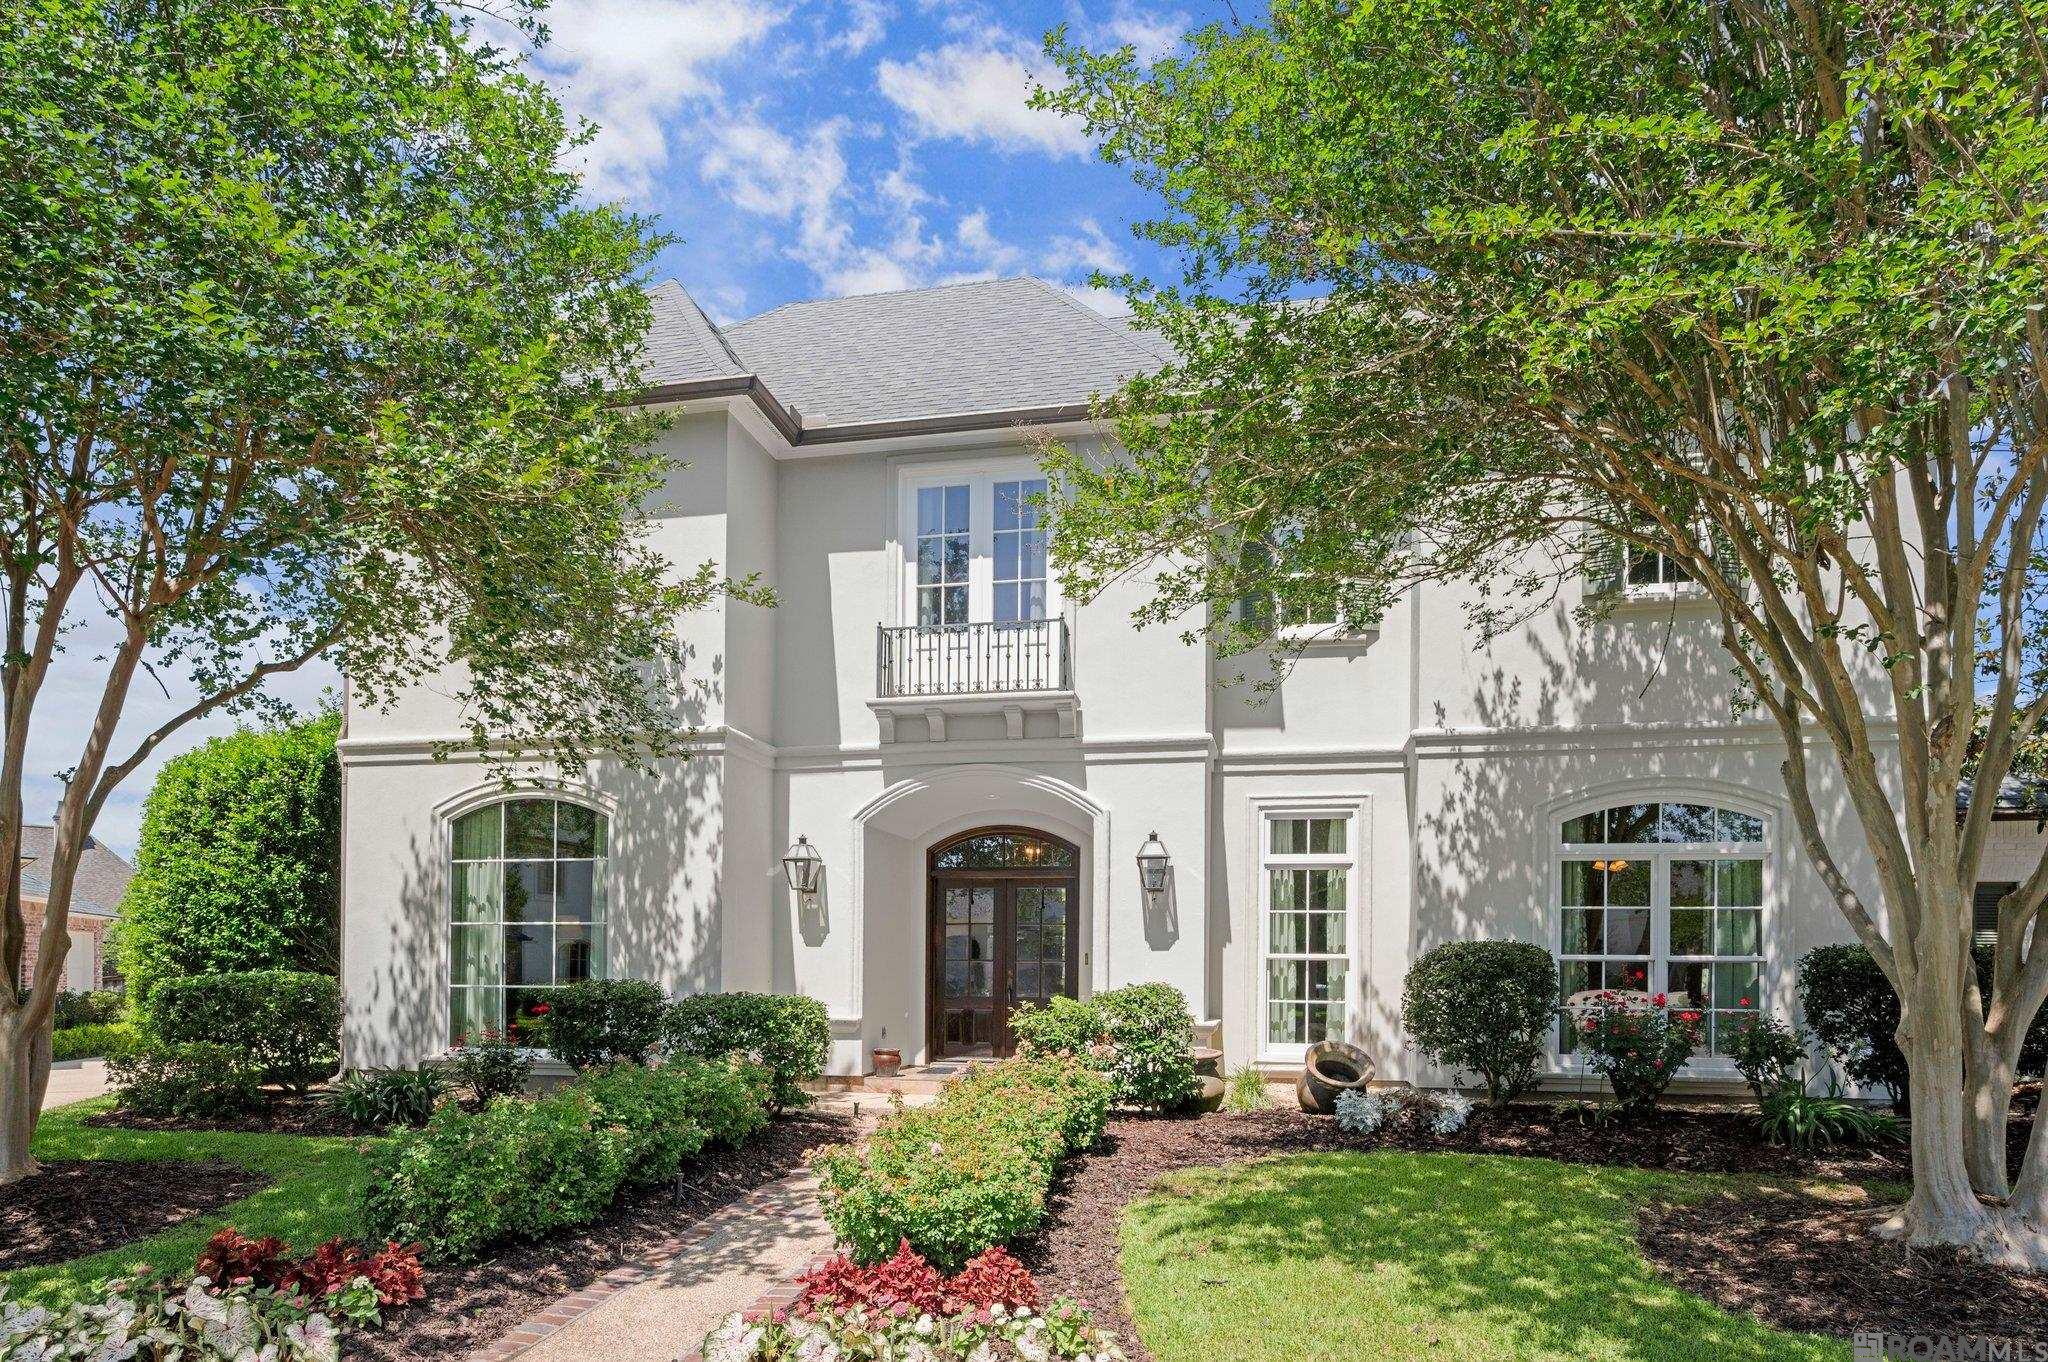
Active
$945,000
4
bds
|
4
ba
|
3,642
sqft
|
built
2006
19452 Oak Park Ct, Baton Rouge, LA 70809
$-2,515
Cash flow
-13.9%
Cash-on-Cash Return
3.1%
Cap rate
0.4%
Rent to Value Ratio
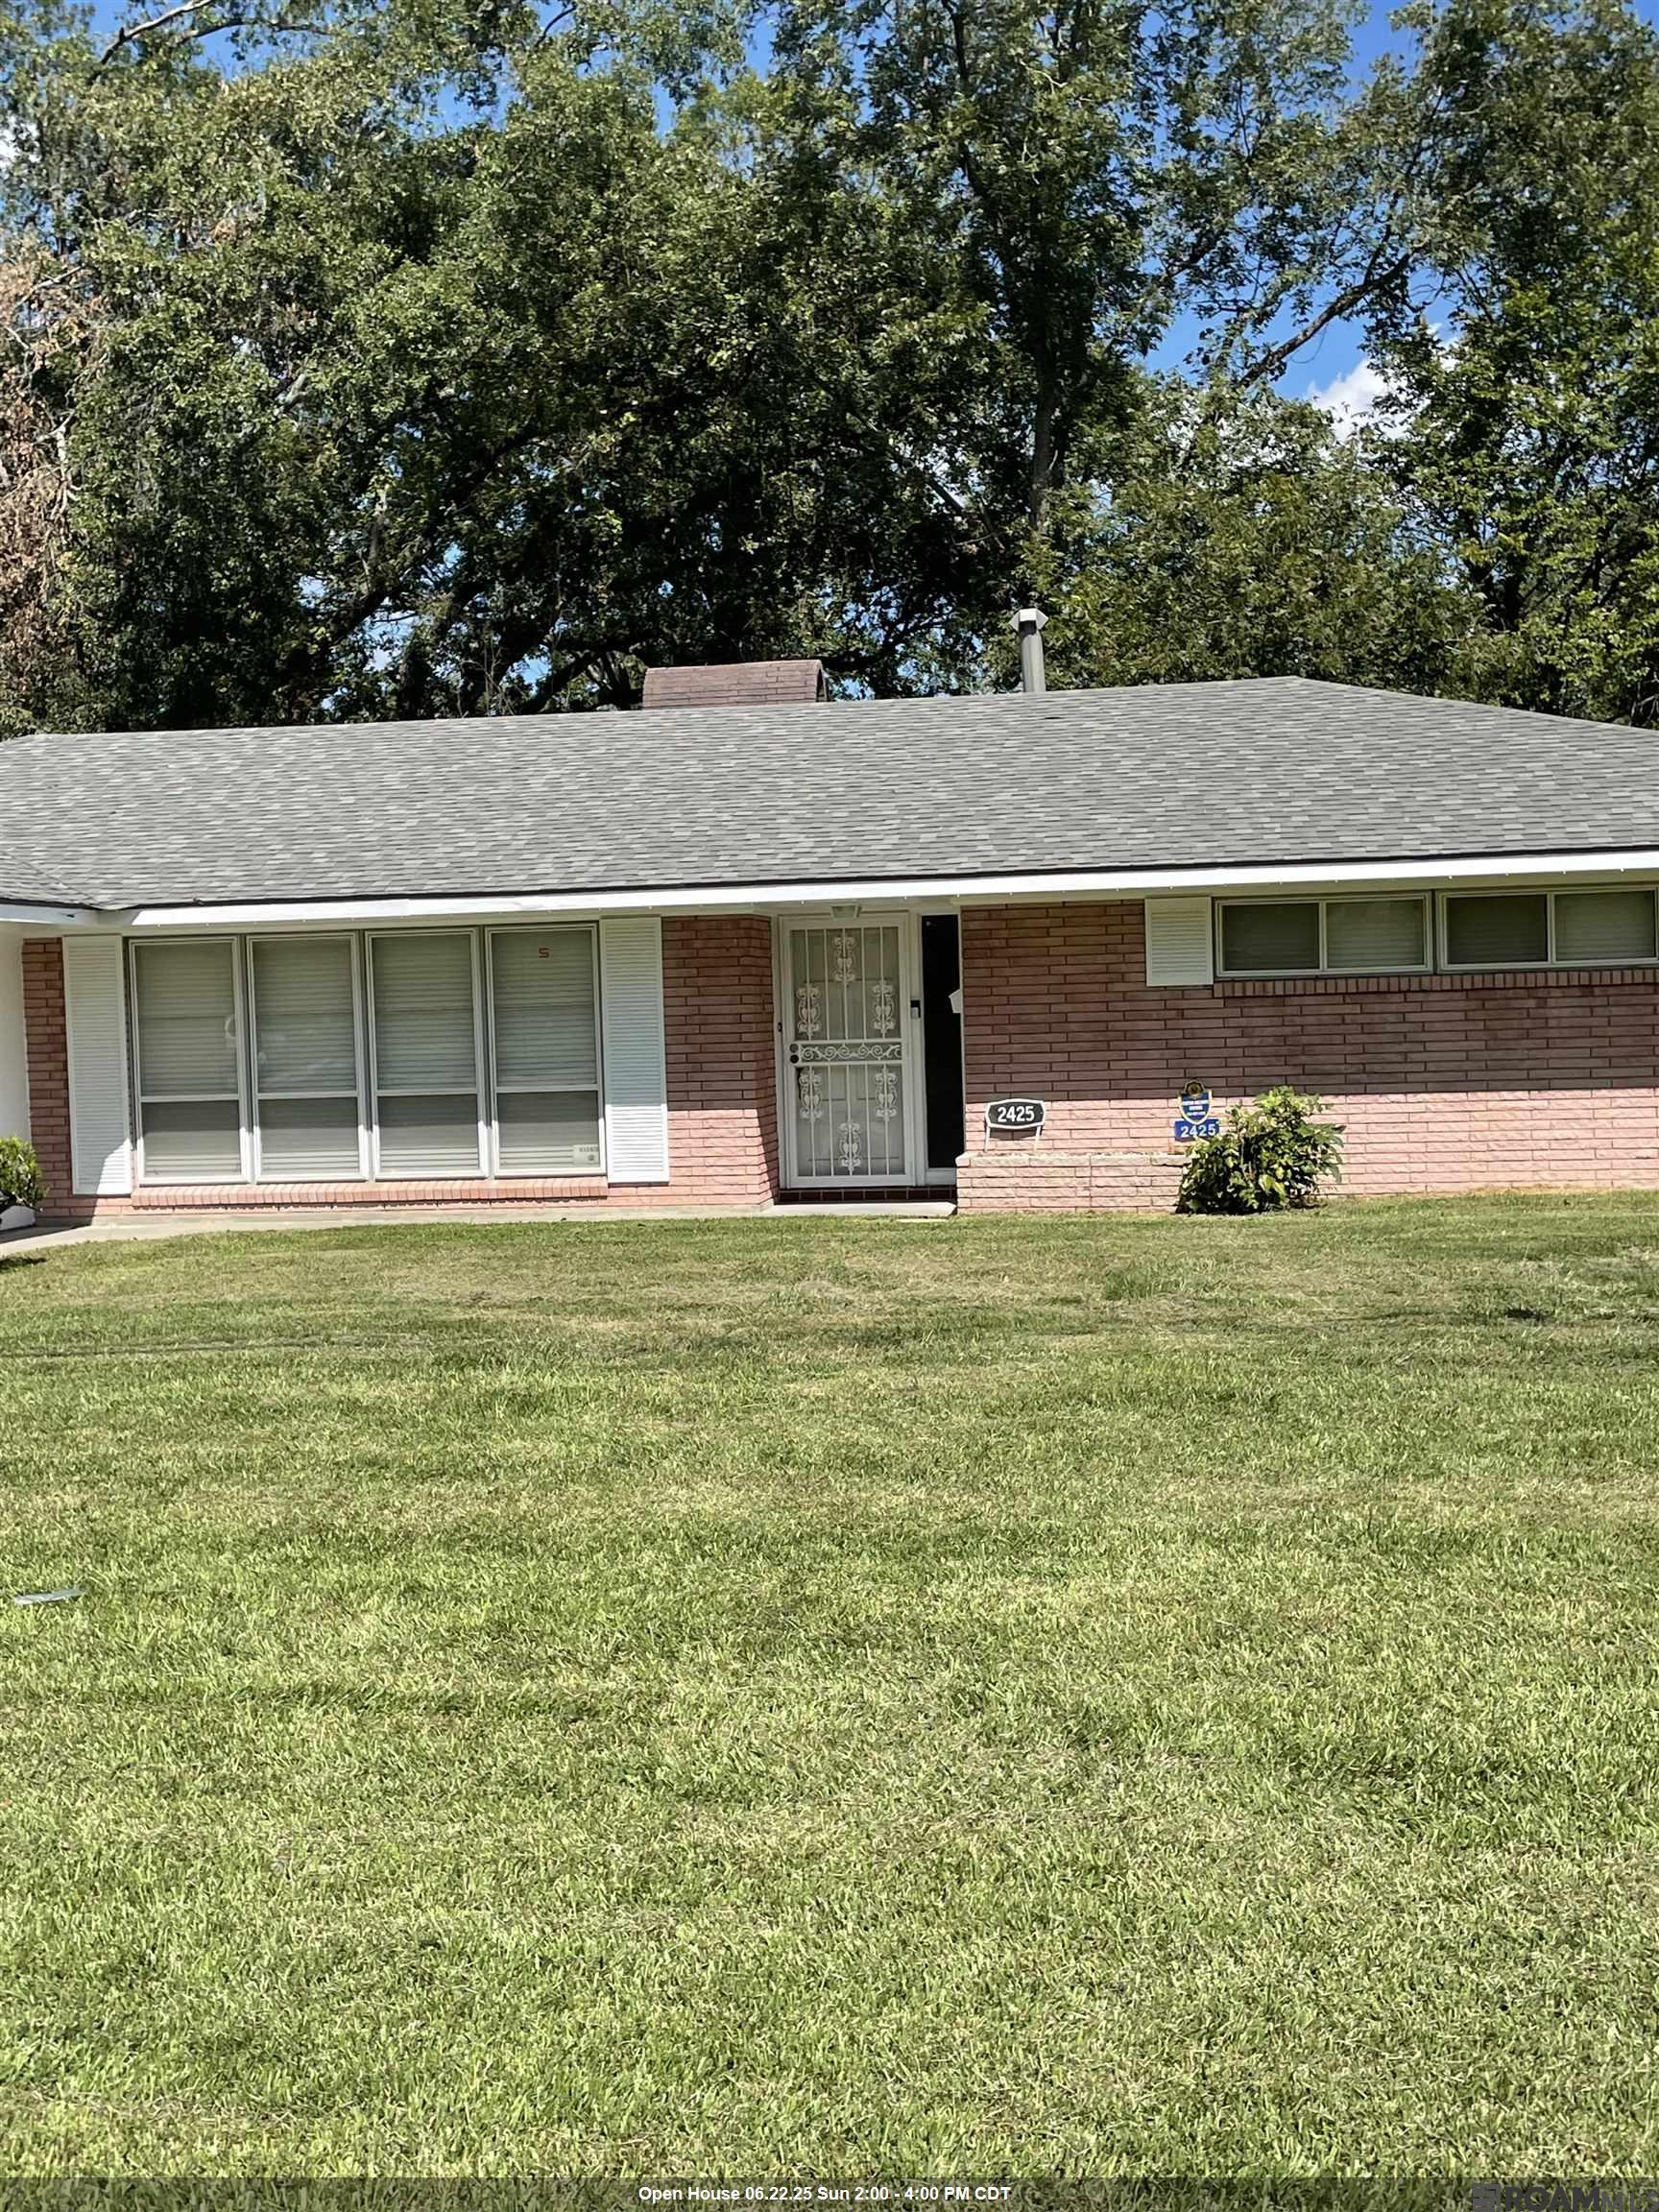
Active
$220,000
3
bds
|
3
ba
|
2,494
sqft
|
built
1960
2425 Harding Blvd, Baton Rouge, LA 70807
$228
Cash flow
5.4%
Cash-on-Cash Return
7.5%
Cap rate
0.9%
Rent to Value Ratio
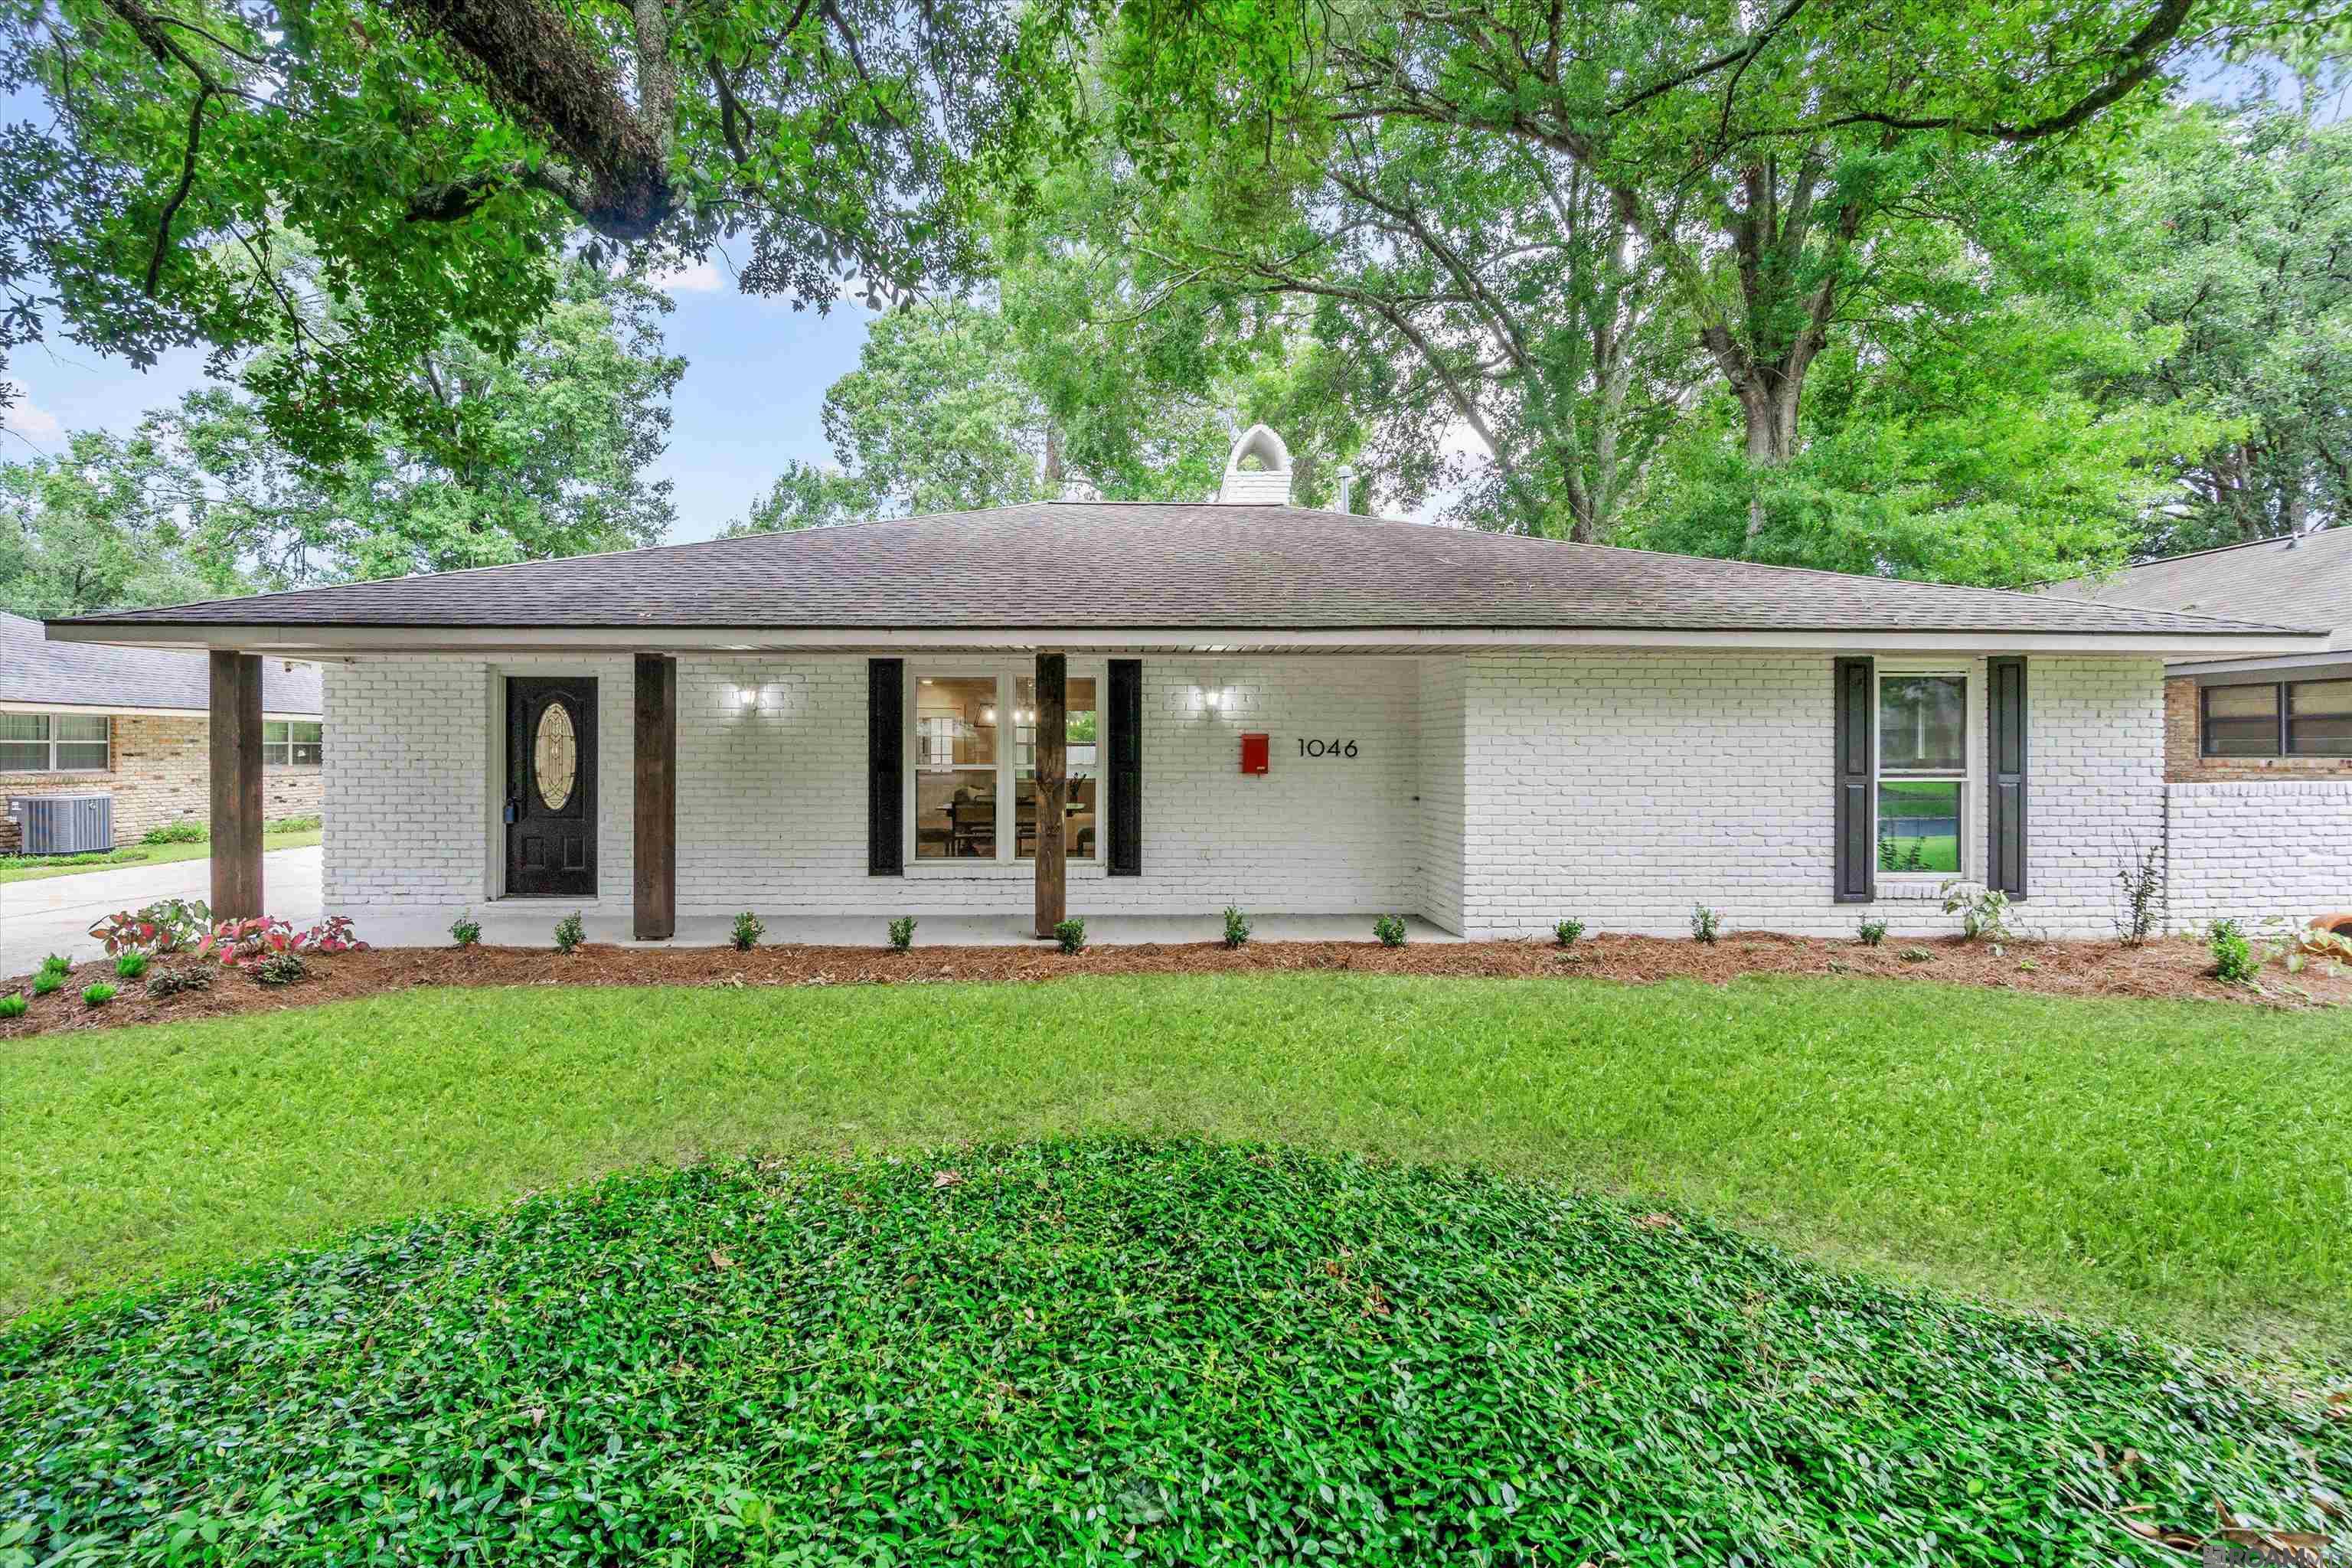
Active
$369,000
4
bds
|
2
ba
|
2,063
sqft
|
built
1970
1046 Colonial Dr, Baton Rouge, LA 70806
$0
Cash flow
0.0%
Cash-on-Cash Return
6.3%
Cap rate
0.8%
Rent to Value Ratio
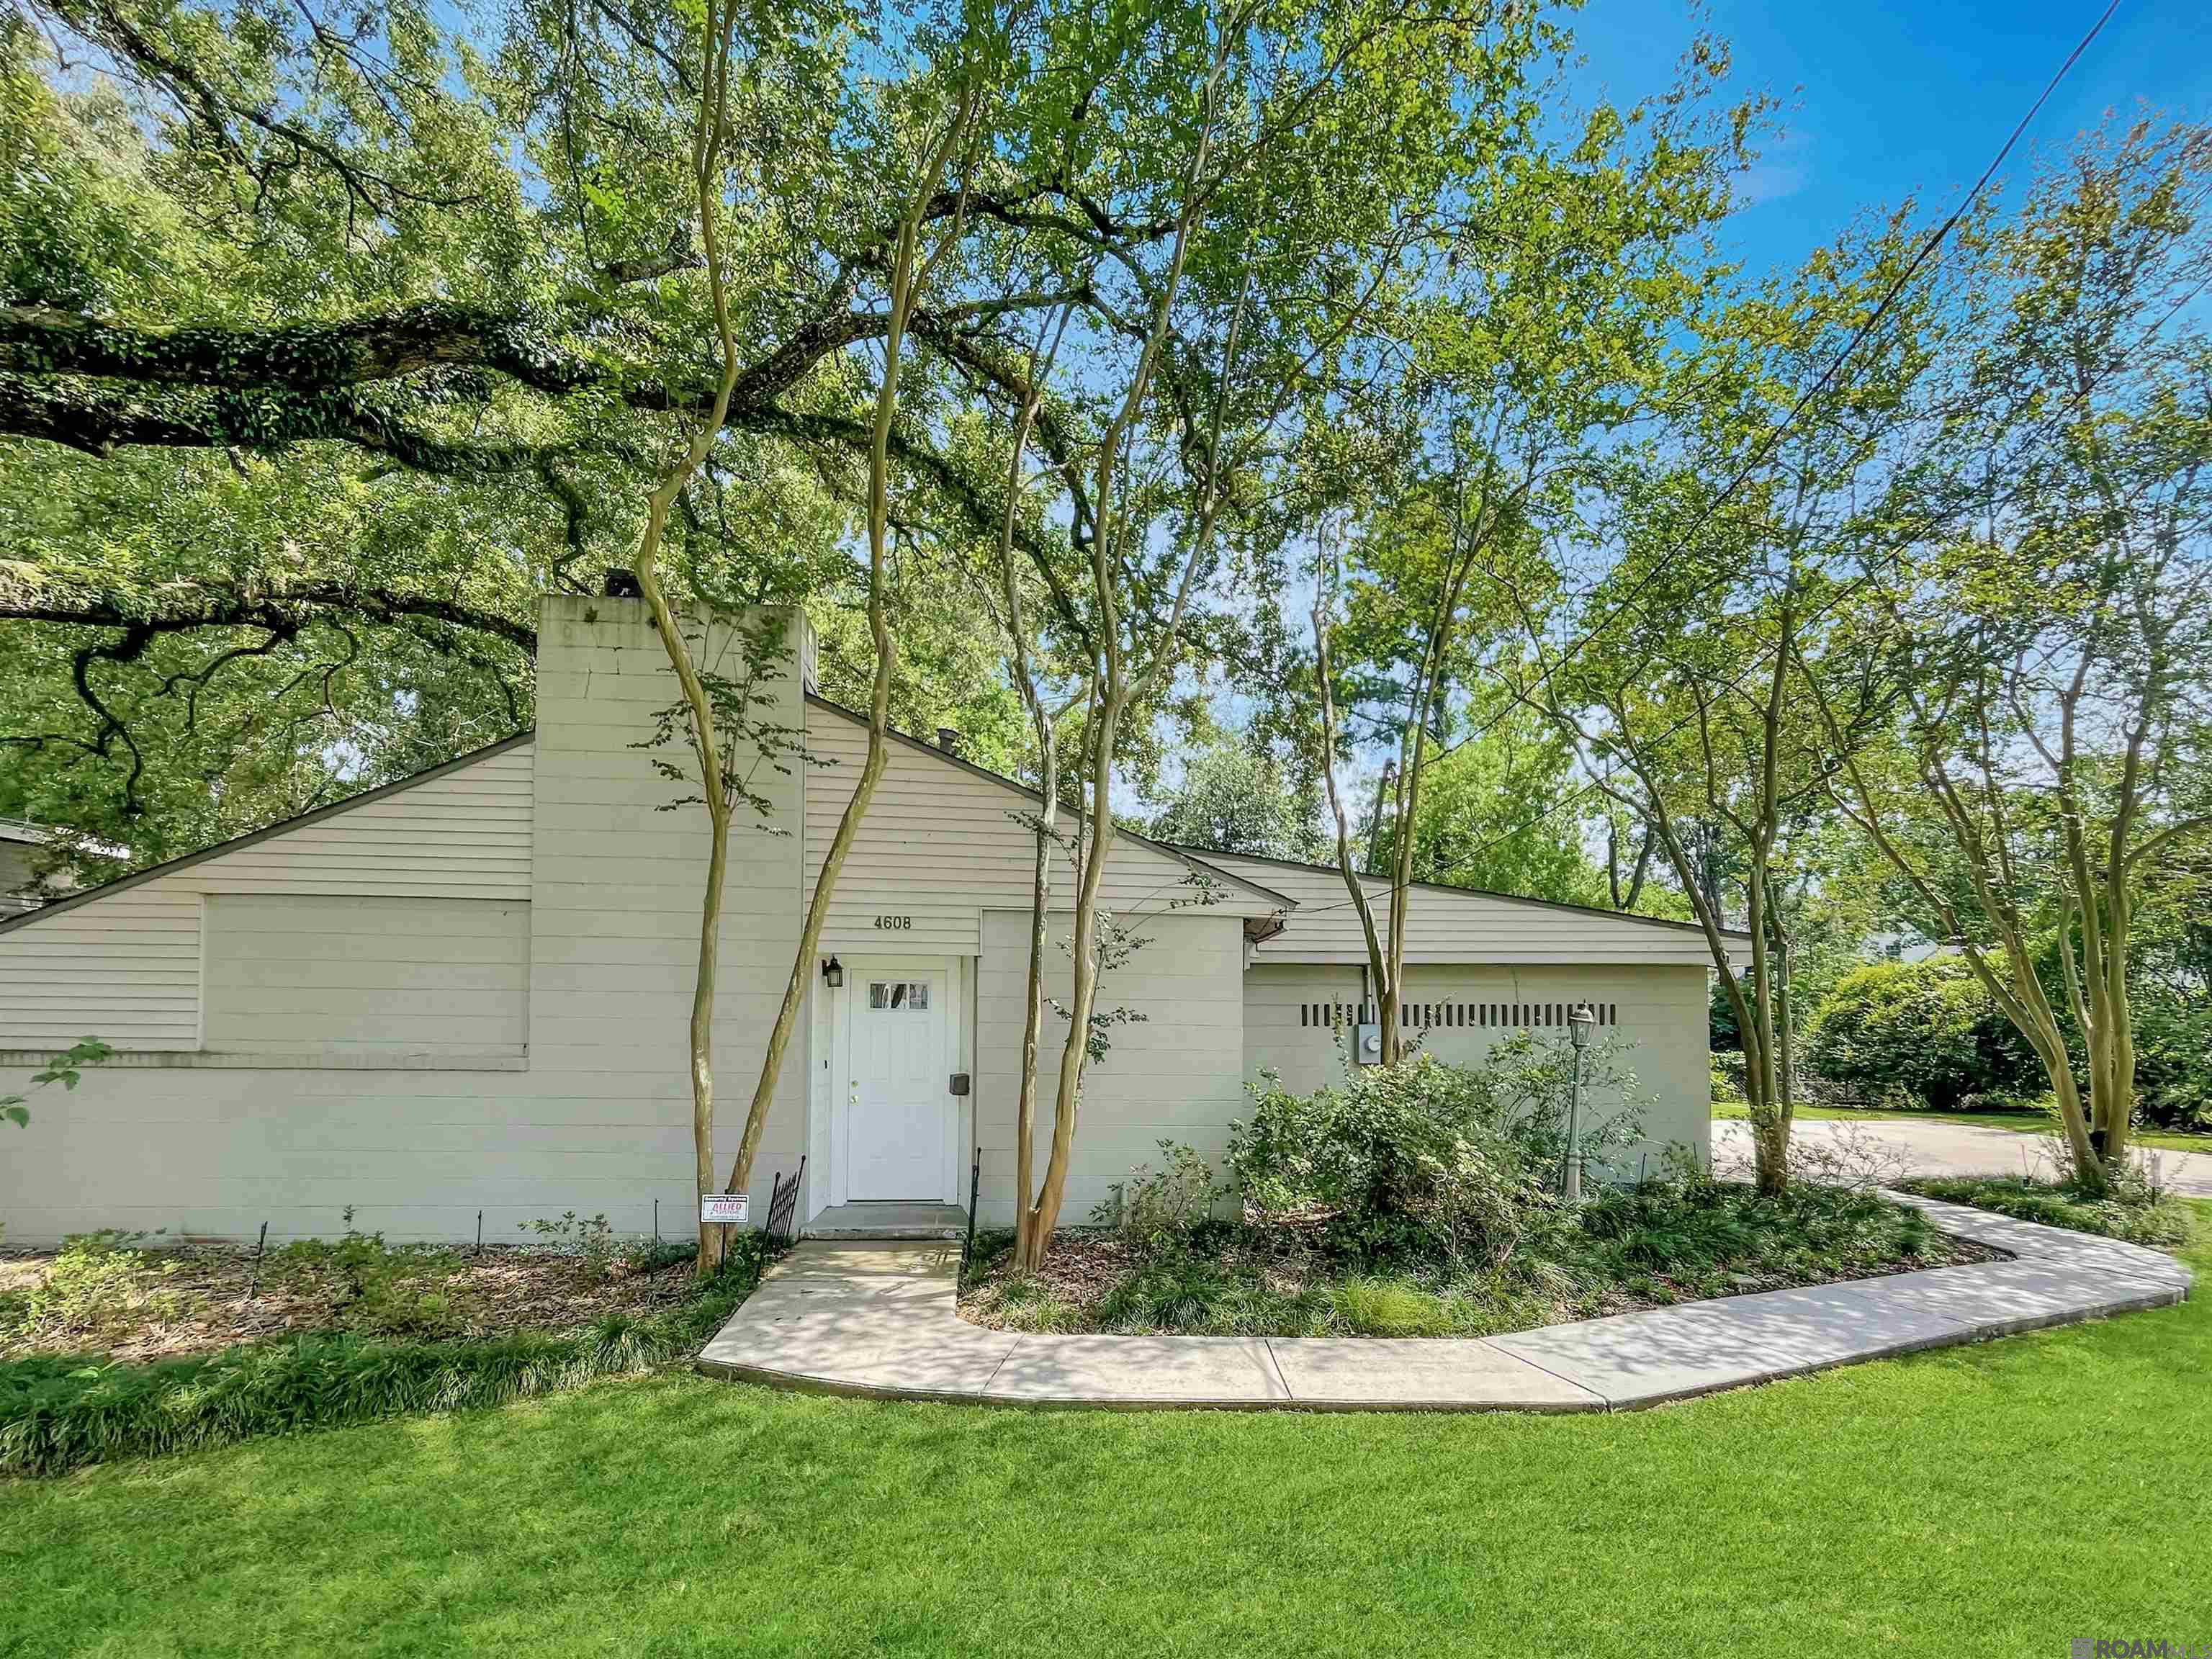
Active
$299,000
2
bds
|
2
ba
|
1,247
sqft
|
built
1956
4608 Capital Heights Ave, Baton Rouge, LA 70806
$-462
Cash flow
-8.1%
Cash-on-Cash Return
4.4%
Cap rate
0.5%
Rent to Value Ratio
Active
$155,000
3
bds
|
2
ba
|
1,638
sqft
|
built
1980
4831 Beech St, Baton Rouge, LA 70805
$85
Cash flow
2.9%
Cash-on-Cash Return
6.9%
Cap rate
0.8%
Rent to Value Ratio
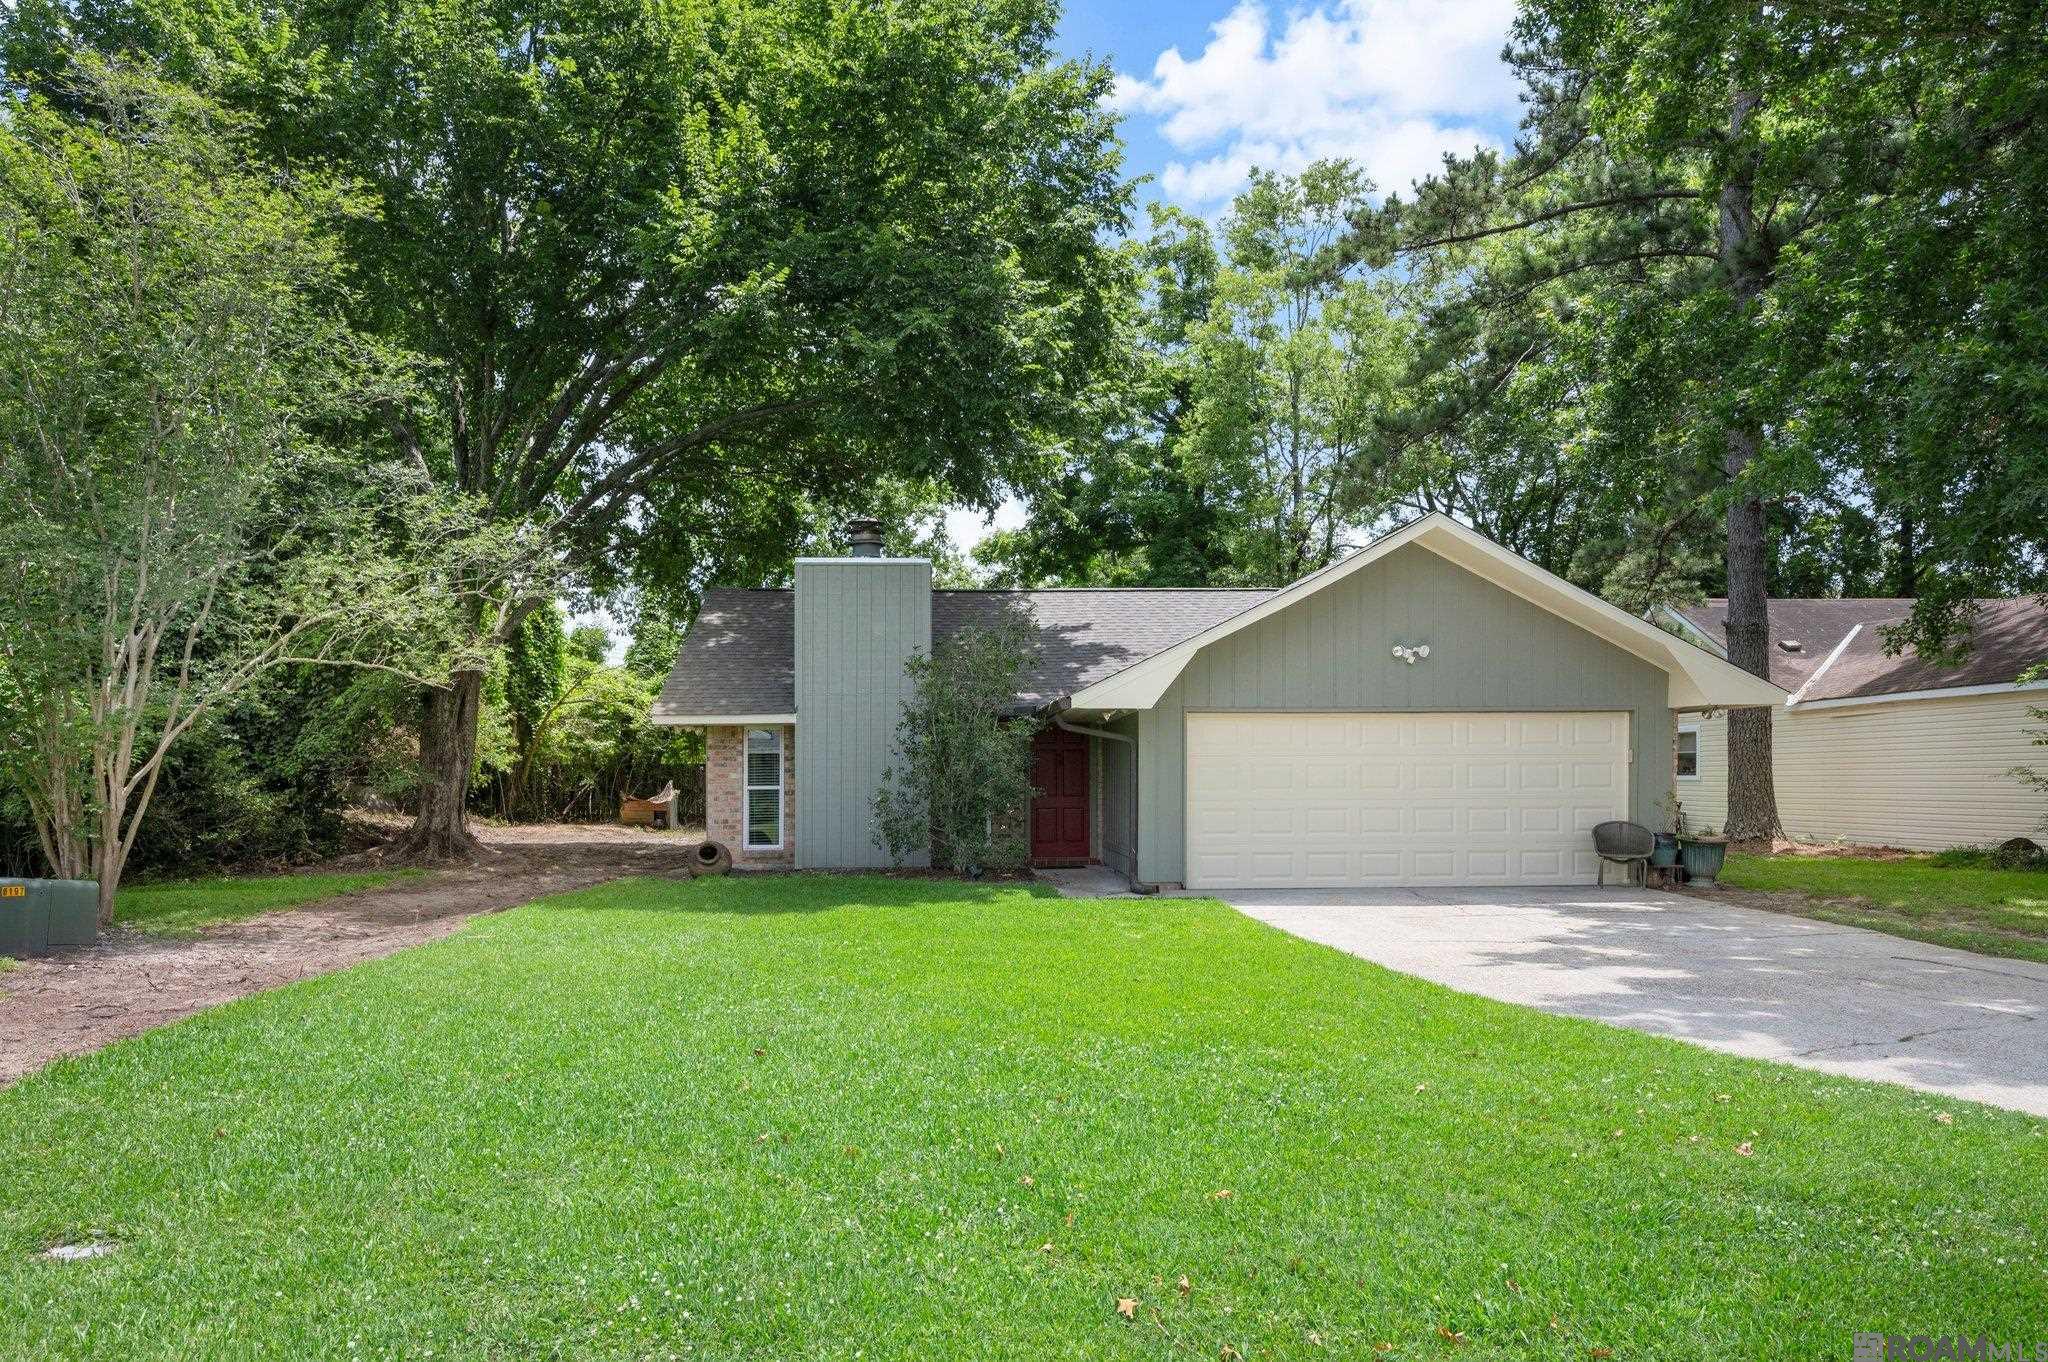
Pending
$215,000
3
bds
|
2
ba
|
1,731
sqft
|
built
1974
7419 Oakmount Dr, Baton Rouge, LA 70817
$233
Cash flow
5.7%
Cash-on-Cash Return
7.6%
Cap rate
0.9%
Rent to Value Ratio
Active
$85,500
4
bds
|
2
ba
|
1,795
sqft
|
built
1971
3725 Winbourne Ave, Baton Rouge, LA 70805
$518
Cash flow
31.6%
Cash-on-Cash Return
13.6%
Cap rate
1.6%
Rent to Value Ratio
Active
$49,990
2
bds
|
1
ba
|
830
sqft
|
built
1975
11675 Ellen Dr, Baton Rouge, LA 70811
$897
Cash flow
20.9%
Cash-on-Cash Return
21.5%
Cap rate
2.6%
Rent to Value Ratio

Active
$939,500
4
bds
|
3
ba
|
3,656
sqft
|
built
2022
2757 Chenal Ct, Baton Rouge, LA 70820
$500
Cash flow
2.8%
Cash-on-Cash Return
6.9%
Cap rate
0.9%
Rent to Value Ratio
Active
$60,000
2
bds
|
1
ba
|
1,234
sqft
|
built
1970
5089 Sycamore St, Baton Rouge, LA 70805
$828
Cash flow
16.1%
Cash-on-Cash Return
16.6%
Cap rate
2.0%
Rent to Value Ratio
Pending
$80,000
3
bds
|
2
ba
|
1,666
sqft
|
built
1969
1645 Chestnut St, Baton Rouge, LA 70802
$340
Cash flow
22.2%
Cash-on-Cash Return
11.4%
Cap rate
1.4%
Rent to Value Ratio
Active
$57,500
2
bds
|
1
ba
|
1,080
sqft
|
built
1950
314 S 18th St, Baton Rouge, LA 70802
$690
Cash flow
14.0%
Cash-on-Cash Return
14.4%
Cap rate
1.7%
Rent to Value Ratio
Active
$110,000
3
bds
|
1
ba
|
1,001
sqft
|
built
1950
5021 Hammond St, Baton Rouge, LA 70805
$321
Cash flow
15.2%
Cash-on-Cash Return
9.8%
Cap rate
1.2%
Rent to Value Ratio
Active
$129,000
3
bds
|
1
ba
|
1,052
sqft
|
built
1970
2834 Century Ave, Baton Rouge, LA 70807
$290
Cash flow
11.7%
Cash-on-Cash Return
9.0%
Cap rate
1.1%
Rent to Value Ratio

Active
$299,900
3
bds
|
2
ba
|
1,309
sqft
|
built
830 East Blvd, Baton Rouge, LA 70802
$-259
Cash flow
-4.5%
Cash-on-Cash Return
5.2%
Cap rate
0.6%
Rent to Value Ratio

Active
$279,000
3
bds
|
2
ba
|
1,600
sqft
|
built
2009
13859 Stone Gate Dr, Baton Rouge, LA 70816
$-248
Cash flow
-4.6%
Cash-on-Cash Return
5.2%
Cap rate
0.6%
Rent to Value Ratio

Active
$224,500
4
bds
|
2
ba
|
2,259
sqft
|
built
1966
9280 Samoa Ave, Baton Rouge, LA 70810
$200
Cash flow
4.6%
Cash-on-Cash Return
7.4%
Cap rate
0.9%
Rent to Value Ratio
Active
$325,000
3
bds
|
2
ba
|
1,963
sqft
|
built
2000
17723 Twin Ridge Ave, Baton Rouge, LA 70817
$-144
Cash flow
-2.3%
Cash-on-Cash Return
5.8%
Cap rate
0.7%
Rent to Value Ratio
Active
$360,000
3
bds
|
2
ba
|
1,721
sqft
|
built
1981
2020 Ovid St, Baton Rouge, LA 70808
$-229
Cash flow
-3.3%
Cash-on-Cash Return
5.5%
Cap rate
0.7%
Rent to Value Ratio
Active
$575,000
4
bds
|
3
ba
|
2,786
sqft
|
built
1967
1525 Parker St, Baton Rouge, LA 70808
$-320
Cash flow
-2.9%
Cash-on-Cash Return
5.6%
Cap rate
0.7%
Rent to Value Ratio
Active
$280,000
bds
|
0
ba
|
4,200
sqft
|
built
2116 Fairchild St, Baton Rouge, LA 70807
$-86
Cash flow
-1.6%
Cash-on-Cash Return
5.9%
Cap rate
0.7%
Rent to Value Ratio
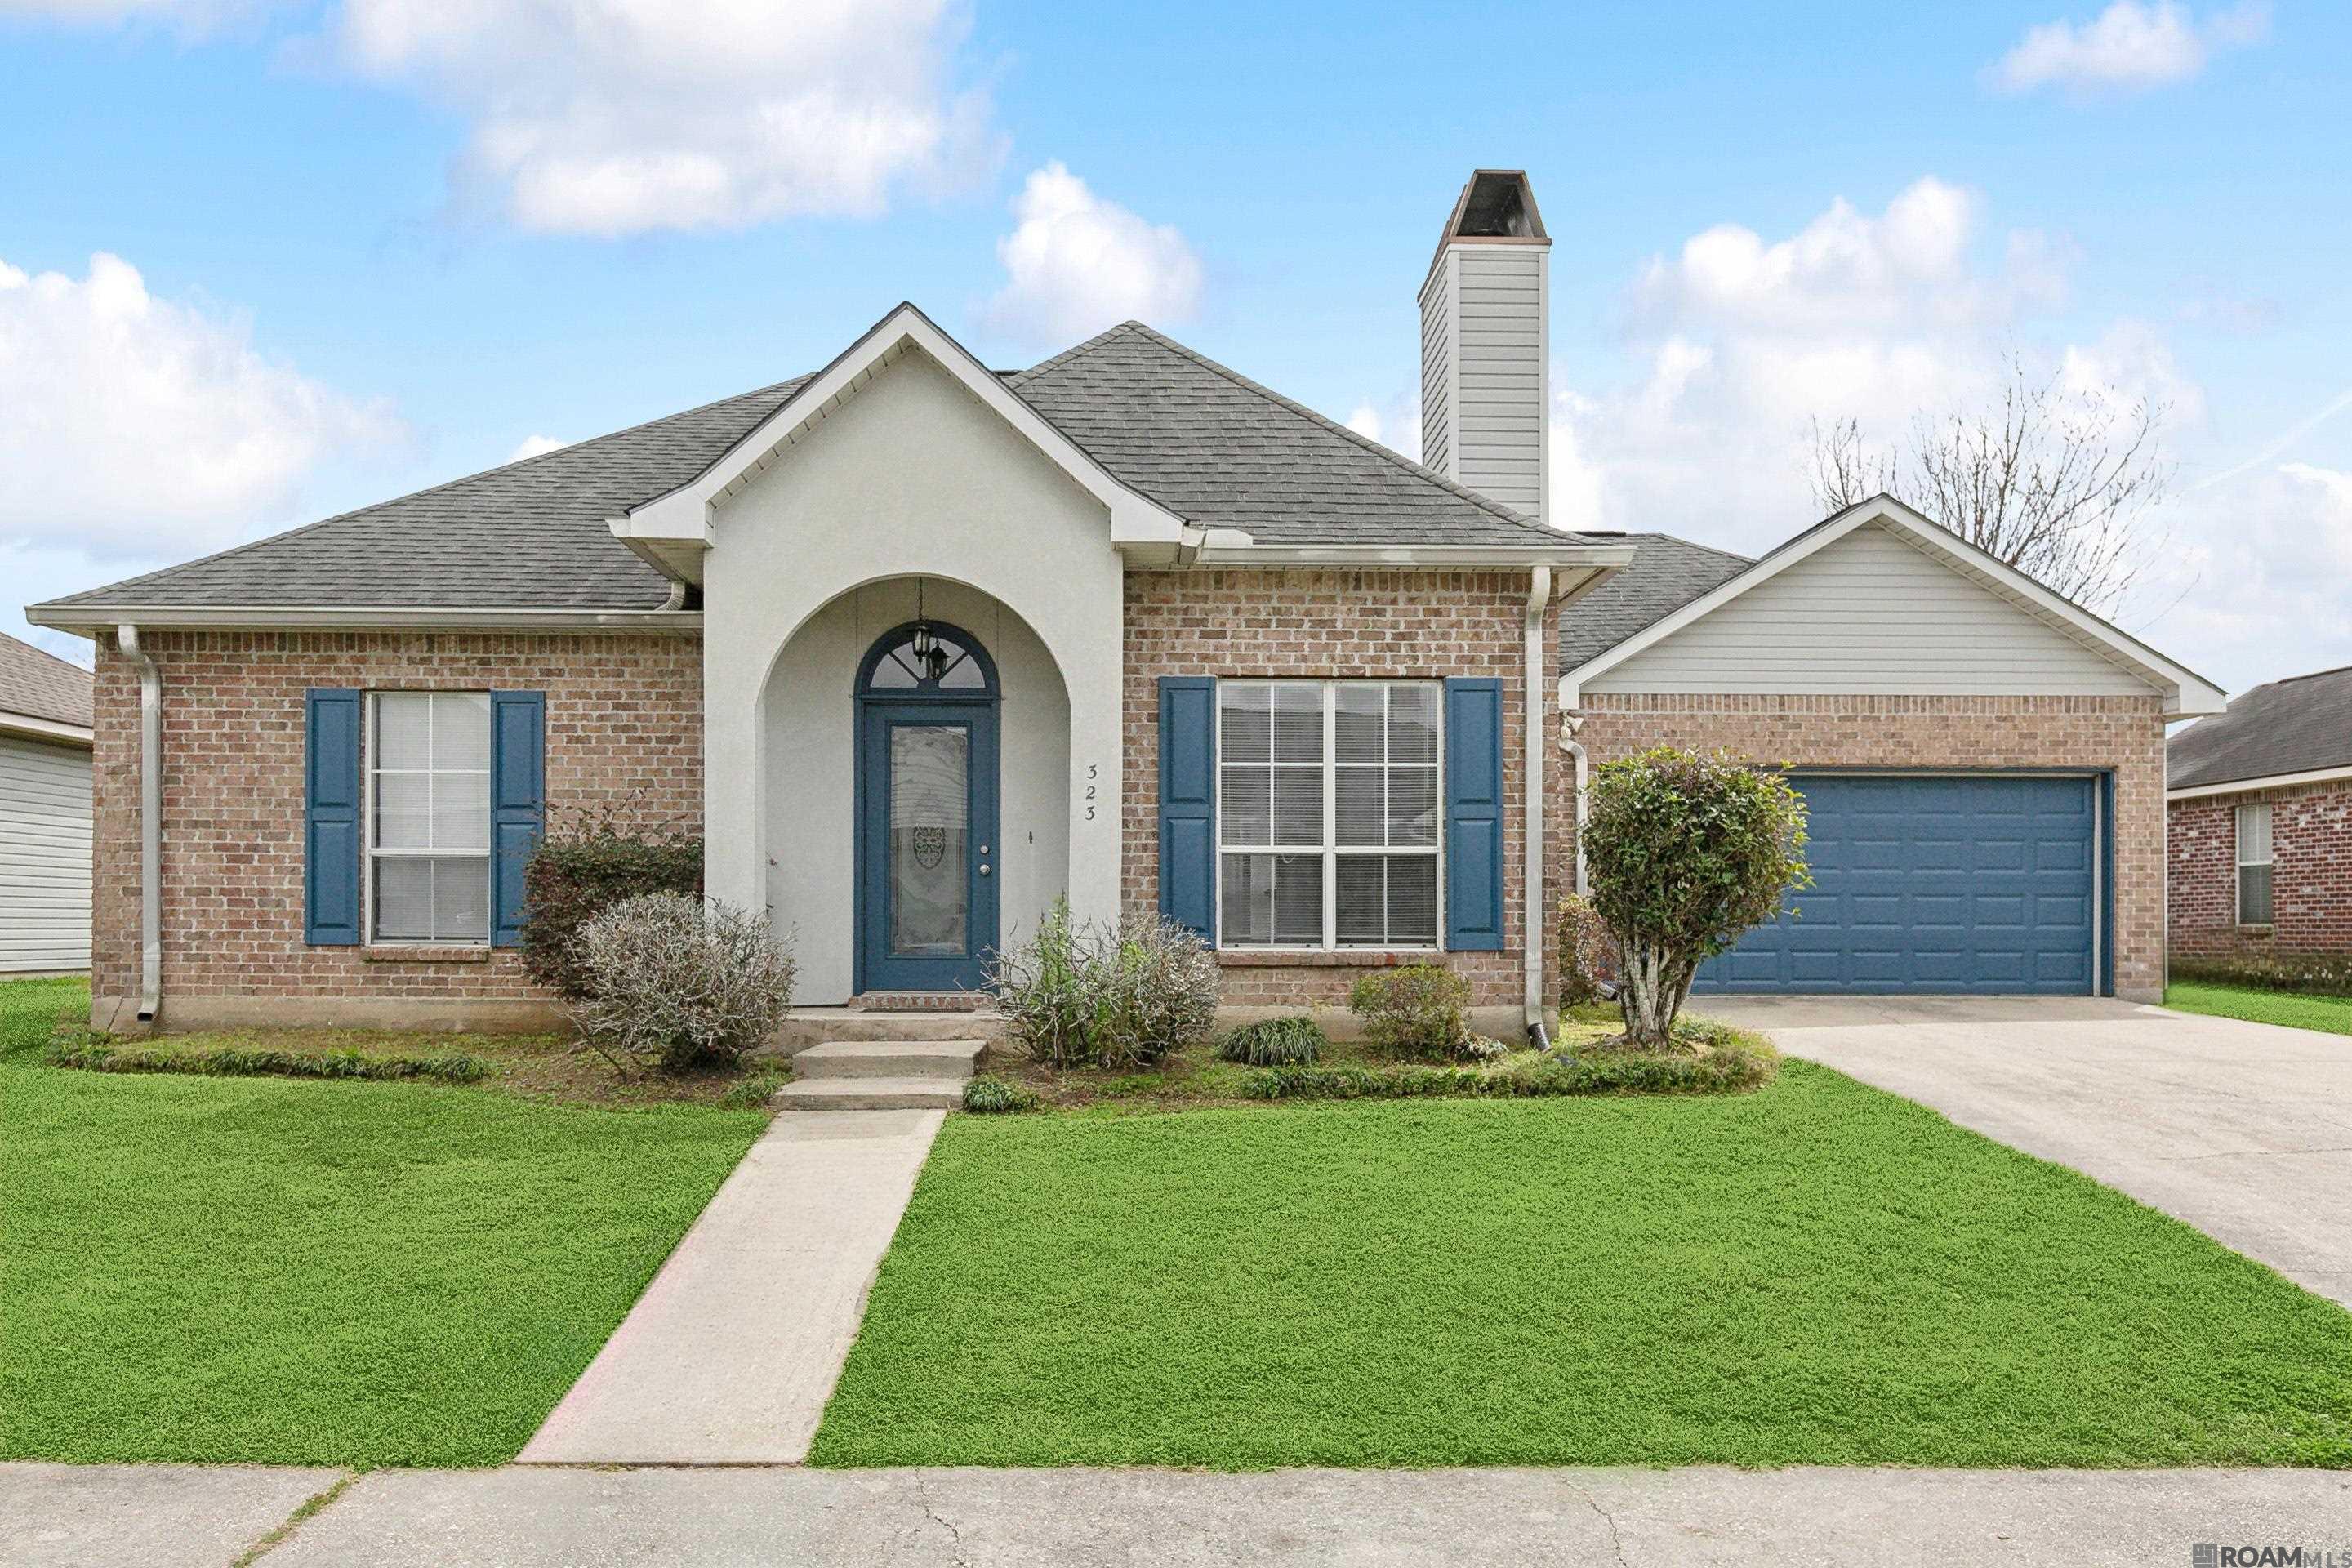
Active
$228,000
3
bds
|
2
ba
|
1,480
sqft
|
built
2000
323 Briarhaven Dr, Baton Rouge, LA 70810
$-90
Cash flow
-2.1%
Cash-on-Cash Return
5.8%
Cap rate
0.7%
Rent to Value Ratio

Active
$236,000
3
bds
|
2
ba
|
1,502
sqft
|
built
2006
683 Fall Creek Dr, Baton Rouge, LA 70810
$-29
Cash flow
-0.6%
Cash-on-Cash Return
6.1%
Cap rate
0.8%
Rent to Value Ratio
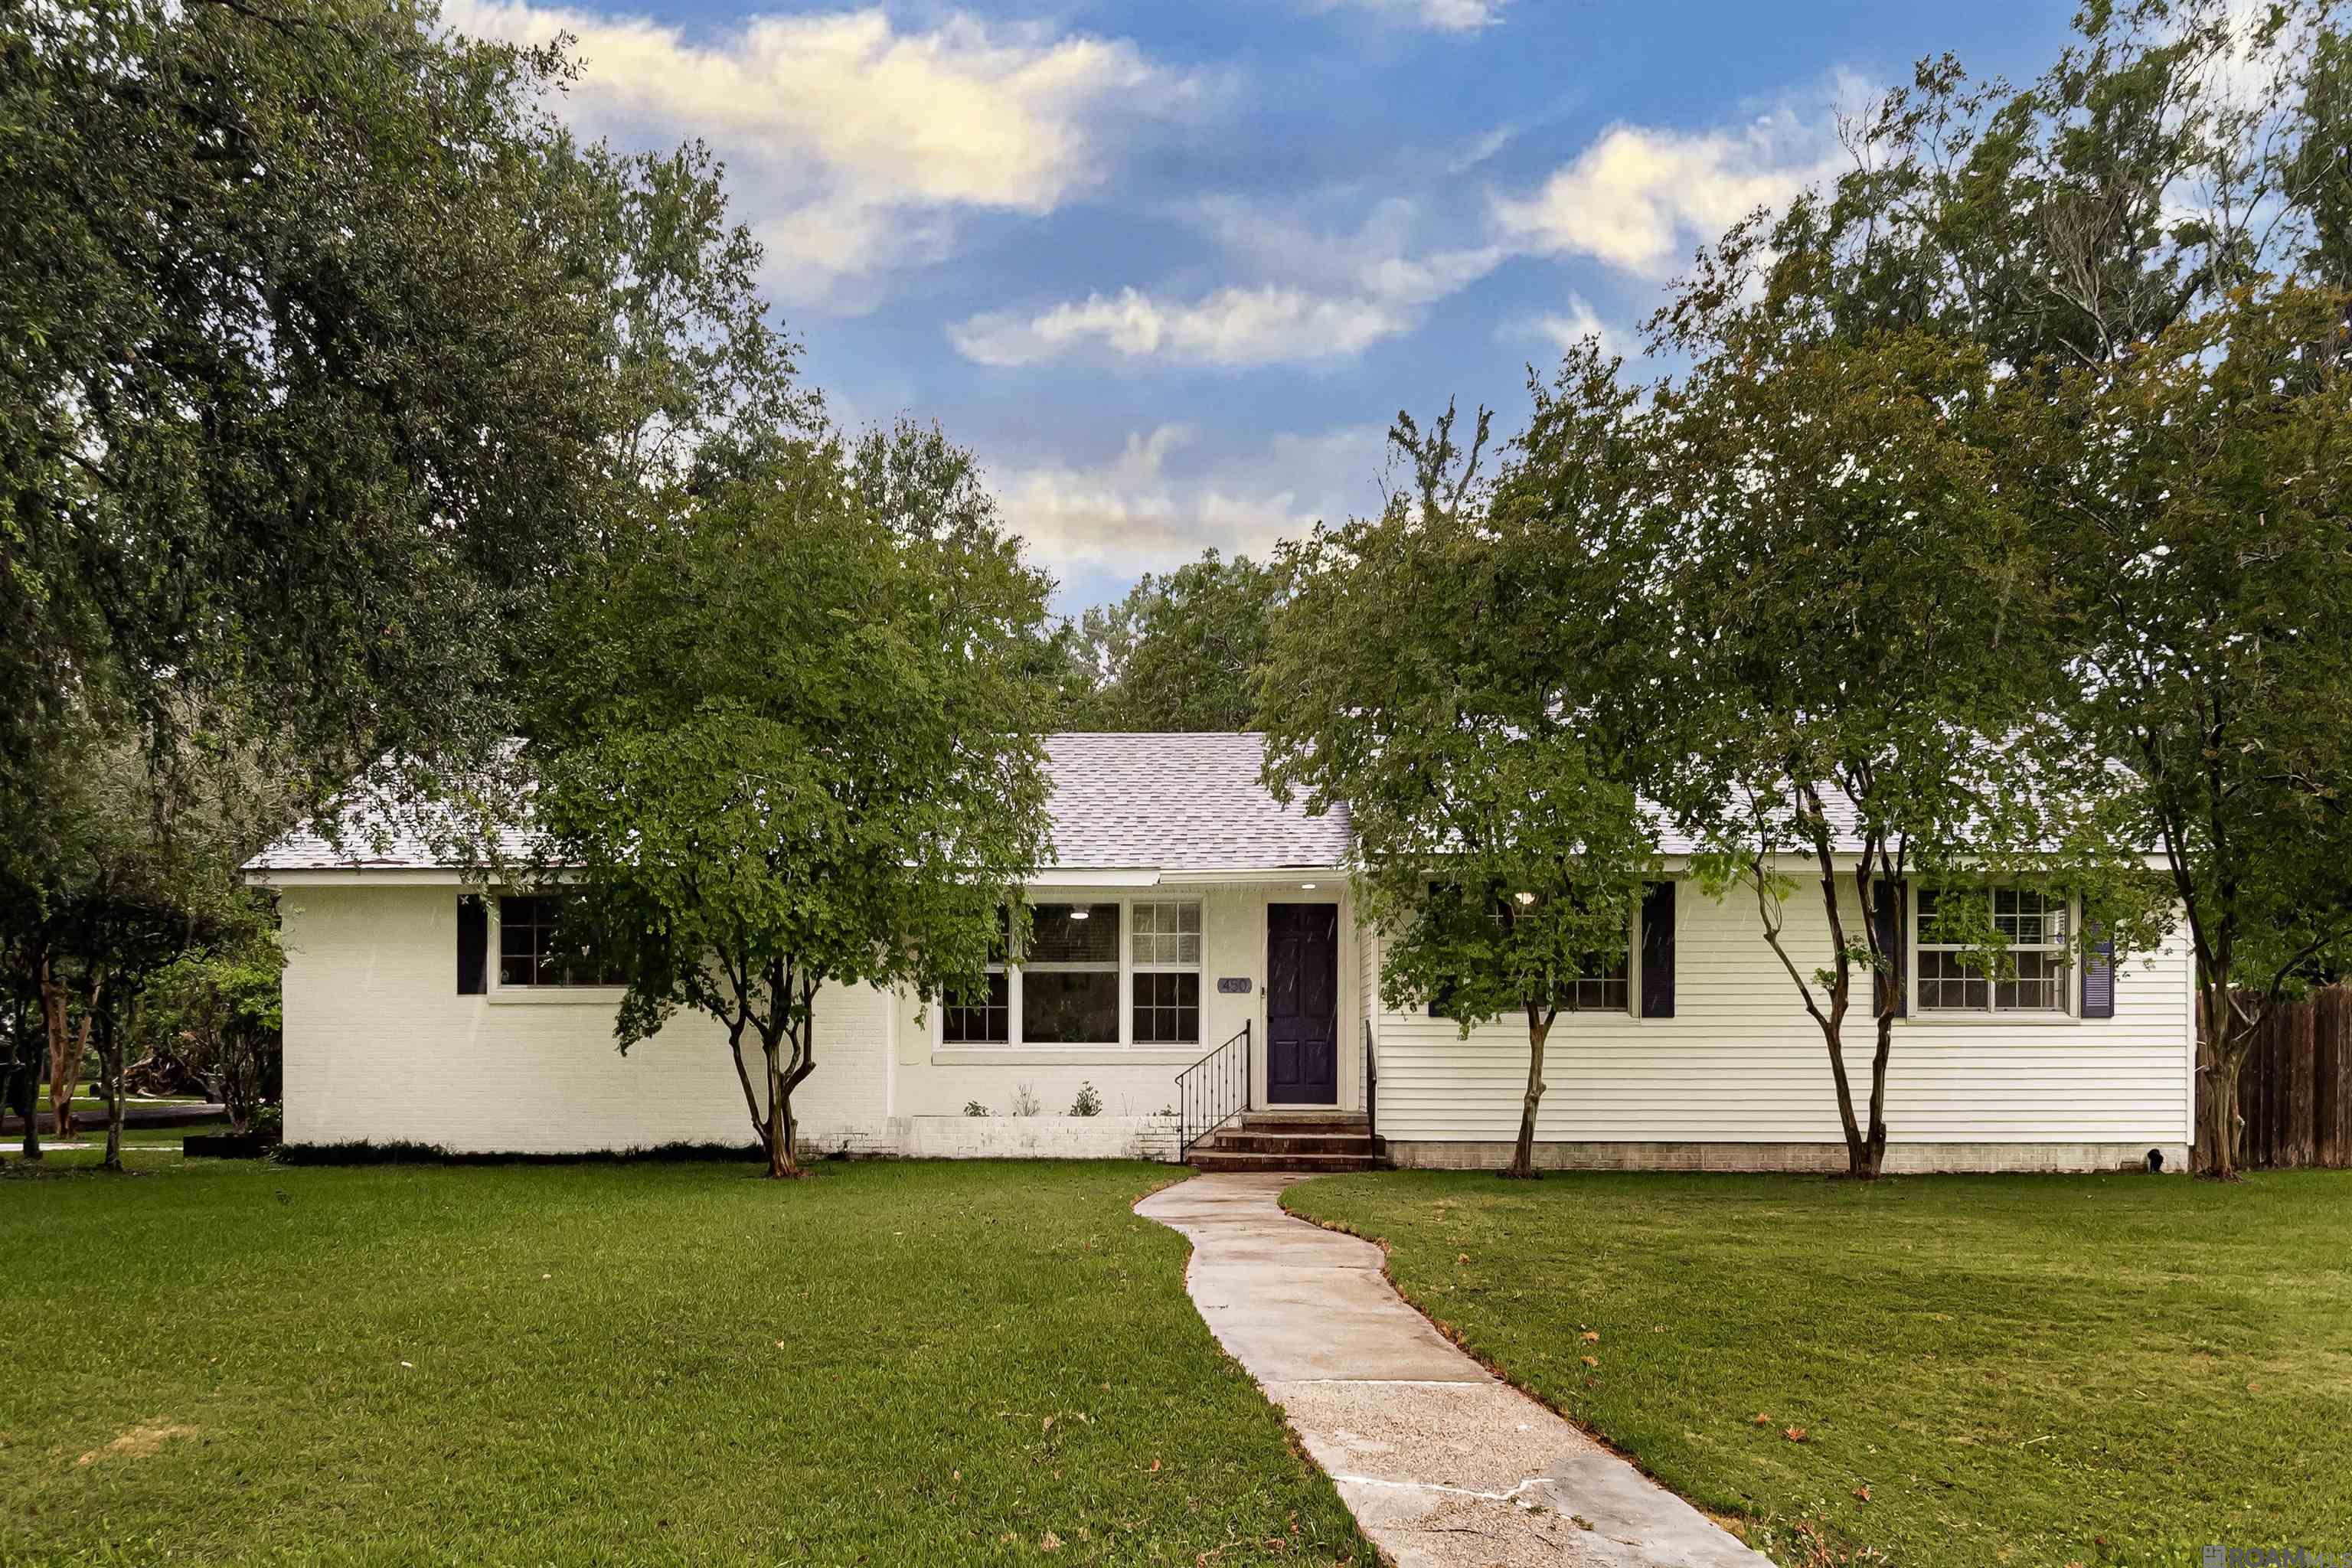
Active
$231,000
3
bds
|
2
ba
|
1,660
sqft
|
built
1950
450 E Riveroaks Dr, Baton Rouge, LA 70815
$-106
Cash flow
-2.4%
Cash-on-Cash Return
5.7%
Cap rate
0.7%
Rent to Value Ratio
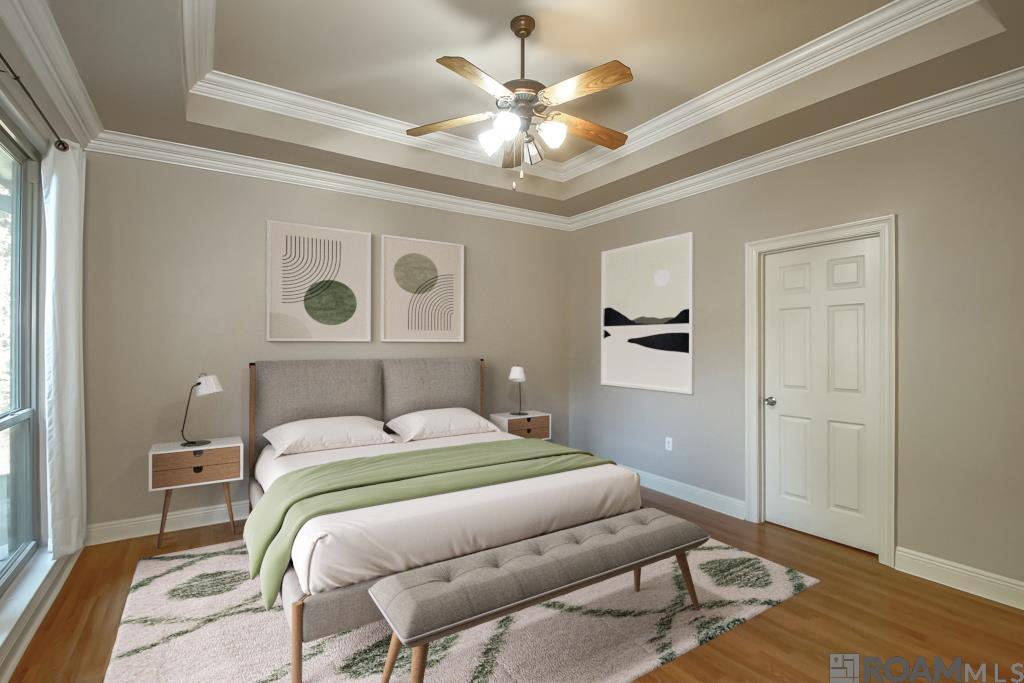
Active
$279,900
3
bds
|
2
ba
|
1,906
sqft
|
built
2002
3112 Grassy Lake Dr, Baton Rouge, LA 70816
$-50
Cash flow
-0.9%
Cash-on-Cash Return
6.1%
Cap rate
0.8%
Rent to Value Ratio

Active
$570,000
3
bds
|
2
ba
|
3,355
sqft
|
built
1980
247 Halfway Tree Rd, Baton Rouge, LA 70810
$120
Cash flow
1.1%
Cash-on-Cash Return
6.5%
Cap rate
0.8%
Rent to Value Ratio

Active
$135,000
2
bds
|
2
ba
|
1,040
sqft
|
built
1986
15722 Riverdale Ave E, Baton Rouge, LA 70816
$-117
Cash flow
-4.5%
Cash-on-Cash Return
5.2%
Cap rate
0.7%
Rent to Value Ratio
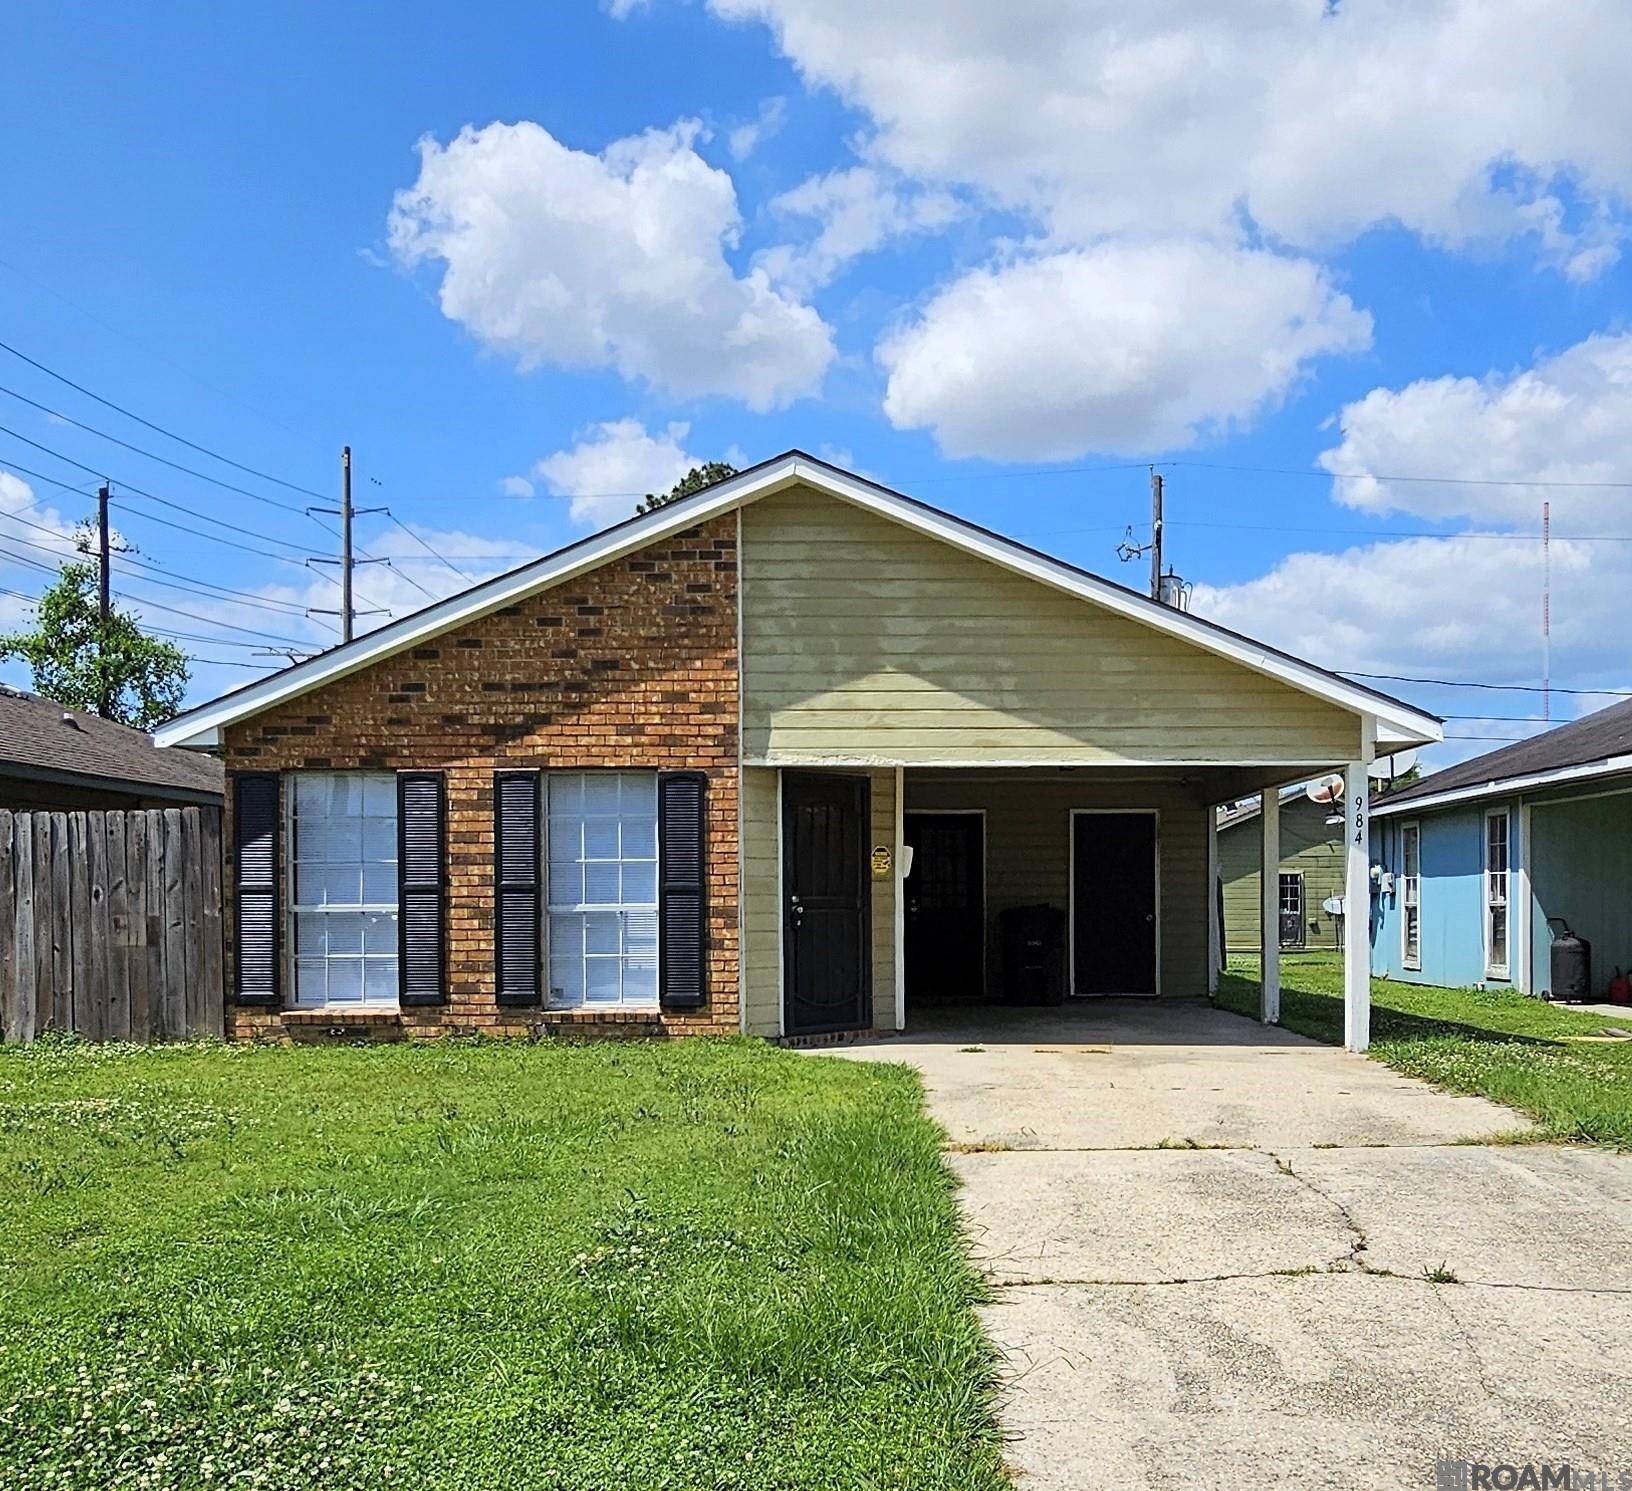
Active
$110,000
3
bds
|
2
ba
|
1,053
sqft
|
built
1984
984 W Mc Kinley St, Baton Rouge, LA 70802
$183
Cash flow
8.7%
Cash-on-Cash Return
8.3%
Cap rate
1.0%
Rent to Value Ratio
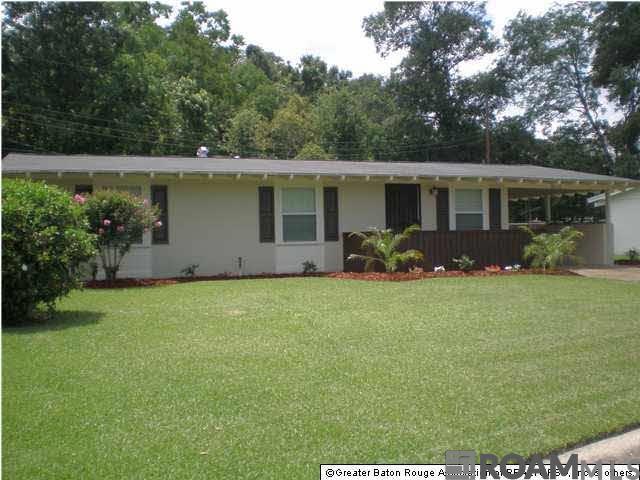
Pending
$185,000
3
bds
|
2
ba
|
1,248
sqft
|
built
1960
4675 Coral Dr, Baton Rouge, LA 70814
$135
Cash flow
3.8%
Cash-on-Cash Return
7.2%
Cap rate
0.9%
Rent to Value Ratio