Baton Rouge, LA Investment Properties for Sale
Browse homes for sale and investment properties in Baton Rouge, LA. Refine your search by price, property type, or more.
Best cash flowing properties in Baton Rouge, LA

Active
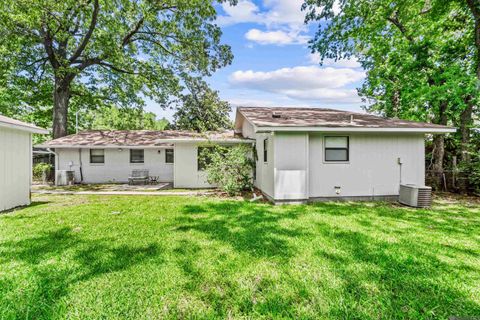
$30,000
2
bds
|
1
ba
|
902
sqft
|
built
1955
2334 Cherry St, Baton Rouge, LA 70802
$552
Cash flow
21.4%
Cash-on-Cash Return
22.1%
Cap rate
2.7%
Rent to Value Ratio
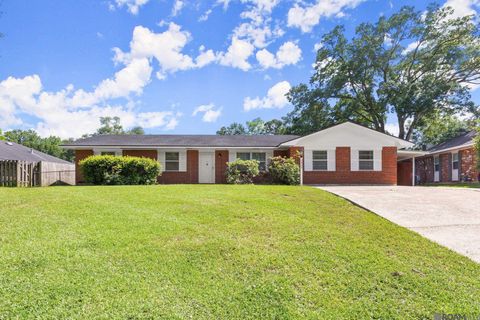
Active
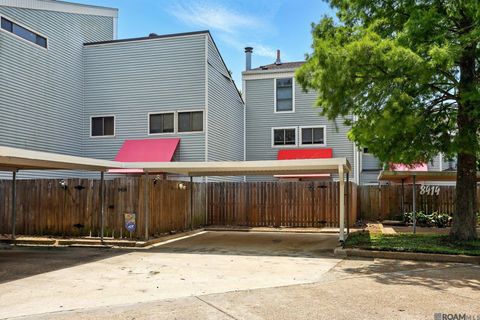
$255,000
3
bds
|
3
ba
|
2,246
sqft
|
built
1958
8444 S Essen Heights Ct, Baton Rouge, LA 70809
$173
Cash flow
3.5%
Cash-on-Cash Return
6.5%
Cap rate
0.8%
Rent to Value Ratio
975 out of 1,258 properties for sale in Baton Rouge, LA
Limited Results Shown
Create a free account, or log in to reveal all property listings and enjoy the complete experience.

Active
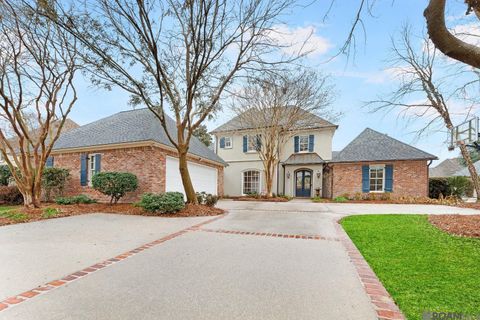
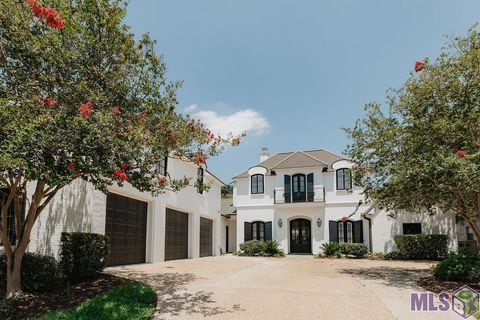
$579,000
3
bds
|
3
ba
|
4,085
sqft
|
built
1999
1518 Pickett Ave, Baton Rouge, LA 70808
$-534
Cash flow
-4.8%
Cash-on-Cash Return
4.6%
Cap rate
0.6%
Rent to Value Ratio

Active
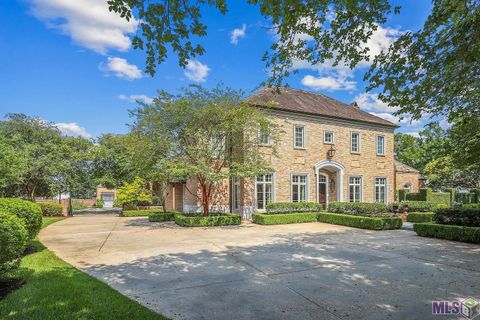
$649,000
4
bds
|
3
ba
|
3,002
sqft
|
built
2002
17928 Pecan Shadows Dr, Baton Rouge, LA 70810
$-349
Cash flow
-2.8%
Cash-on-Cash Return
5.0%
Cap rate
0.6%
Rent to Value Ratio

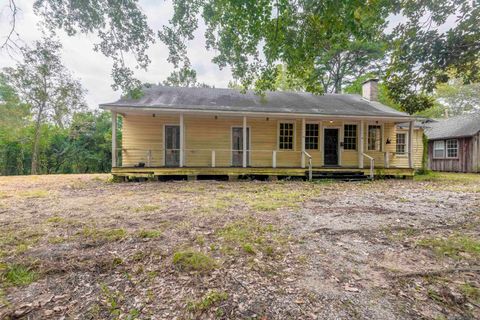
Active
$389,000
2
bds
|
2
ba
|
1,640
sqft
|
built
1947
1919 Stanford Ave, Baton Rouge, LA 70808
$-461
Cash flow
-6.2%
Cash-on-Cash Return
4.3%
Cap rate
0.5%
Rent to Value Ratio

Active
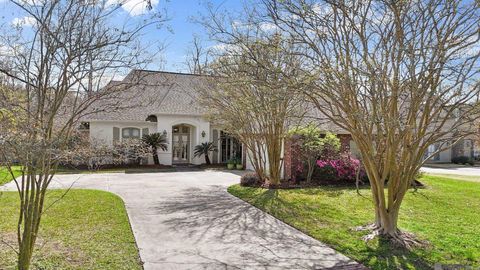
$820,000
3
bds
|
3
ba
|
2,590
sqft
|
built
2020
8749 Gail Dr, Baton Rouge, LA 70809
$-2,293
Cash flow
-14.6%
Cash-on-Cash Return
2.3%
Cap rate
0.3%
Rent to Value Ratio

Active
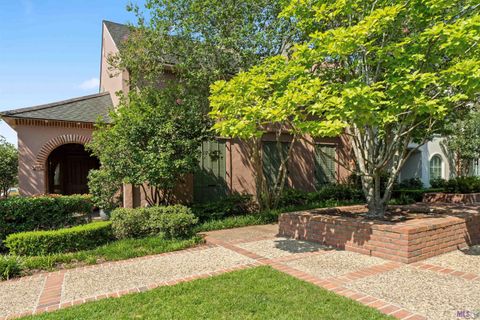
$825,000
4
bds
|
6
ba
|
3,101
sqft
|
built
2018
2631 Tiger Crossing Dr, Baton Rouge, LA 70810
$-671
Cash flow
-4.2%
Cash-on-Cash Return
4.7%
Cap rate
0.6%
Rent to Value Ratio

Pending
$559,000
4
bds
|
3
ba
|
2,430
sqft
|
built
2013
13555 Kings Court Ave, Baton Rouge, LA 70810
$-29
Cash flow
-0.3%
Cash-on-Cash Return
5.6%
Cap rate
0.7%
Rent to Value Ratio

Pending
$405,000
3
bds
|
0
ba
|
2,300
sqft
|
built
658 Napoleon St, Baton Rouge, LA 70802
$-675
Cash flow
-8.7%
Cash-on-Cash Return
3.7%
Cap rate
0.4%
Rent to Value Ratio

Active
$509,000
4
bds
|
4
ba
|
3,633
sqft
|
built
1986
4230 Lake Sherwood Ave E, Baton Rouge, LA 70816
$-468
Cash flow
-4.8%
Cash-on-Cash Return
4.6%
Cap rate
0.6%
Rent to Value Ratio

Active
$599,900
4
bds
|
4
ba
|
3,119
sqft
|
built
2004
14134 Kimbleton Ave, Baton Rouge, LA 70817
$-851
Cash flow
-7.4%
Cash-on-Cash Return
4.0%
Cap rate
0.5%
Rent to Value Ratio

Active
$1,999,500
5
bds
|
6
ba
|
6,714
sqft
|
built
2006
22221 Rabbit Run Dr, Baton Rouge, LA 70817
$-5,248
Cash flow
-13.7%
Cash-on-Cash Return
2.5%
Cap rate
0.3%
Rent to Value Ratio

Active
$675,000
4
bds
|
4
ba
|
3,494
sqft
|
built
2005
3216 Broad Magnolia Ct, Baton Rouge, LA 70810
$-306
Cash flow
-2.4%
Cash-on-Cash Return
5.1%
Cap rate
0.7%
Rent to Value Ratio

Active
$970,000
2
bds
|
3
ba
|
2,723
sqft
|
built
2017
907 Carter Ave, Baton Rouge, LA 70806
$-3,486
Cash flow
-18.8%
Cash-on-Cash Return
1.4%
Cap rate
0.2%
Rent to Value Ratio
Active
$220,000
3
bds
|
3
ba
|
1,521
sqft
|
built
1985
8416 E Cypress Point Ct, Baton Rouge, LA 70809
$151
Cash flow
3.6%
Cash-on-Cash Return
6.5%
Cap rate
0.8%
Rent to Value Ratio

Active
$575,000
5
bds
|
4
ba
|
3,966
sqft
|
built
1946
4685 Hyacinth Ave, Baton Rouge, LA 70808
$-927
Cash flow
-8.4%
Cash-on-Cash Return
3.7%
Cap rate
0.5%
Rent to Value Ratio
Pending
$789,900
5
bds
|
5
ba
|
3,679
sqft
|
built
2004
15035 Memorial Tower Dr, Baton Rouge, LA 70810
$-781
Cash flow
-5.2%
Cash-on-Cash Return
4.5%
Cap rate
0.6%
Rent to Value Ratio
Active
$525,000
3
bds
|
3
ba
|
1,919
sqft
|
built
1982
4852 Highland Rd, Baton Rouge, LA 70808
$-759
Cash flow
-7.5%
Cash-on-Cash Return
3.9%
Cap rate
0.5%
Rent to Value Ratio
Active
$315,000
3
bds
|
2
ba
|
1,998
sqft
|
built
1977
2309 Aspenwood Dr, Baton Rouge, LA 70816
$-525
Cash flow
-8.7%
Cash-on-Cash Return
3.7%
Cap rate
0.4%
Rent to Value Ratio

Active
$402,000
bds
|
0
ba
|
3,248
sqft
|
built
5435 Nicholson Dr, Baton Rouge, LA 70820
$-1,281
Cash flow
-16.6%
Cash-on-Cash Return
1.9%
Cap rate
0.2%
Rent to Value Ratio
Active
$795,000
4
bds
|
5
ba
|
3,045
sqft
|
built
2023
2860 Pointe Marie Dr, Baton Rouge, LA 70820
$-28
Cash flow
-0.2%
Cash-on-Cash Return
5.6%
Cap rate
0.7%
Rent to Value Ratio
Active
$807,500
5
bds
|
4
ba
|
3,160
sqft
|
built
2018
10744 Cane River Dr, Baton Rouge, LA 70810
$-1,462
Cash flow
-9.4%
Cash-on-Cash Return
3.5%
Cap rate
0.4%
Rent to Value Ratio

Active
$425,000
4
bds
|
3
ba
|
2,486
sqft
|
built
2022
13842 Bellacosa Ave, Baton Rouge, LA 70817
$-972
Cash flow
-11.9%
Cash-on-Cash Return
2.9%
Cap rate
0.4%
Rent to Value Ratio

Active
$575,000
3
bds
|
3
ba
|
2,888
sqft
|
built
1977
9655 Sullivan Rd, Baton Rouge, LA 70818
$-996
Cash flow
-9.0%
Cash-on-Cash Return
3.6%
Cap rate
0.4%
Rent to Value Ratio

Active
$574,900
4
bds
|
4
ba
|
2,998
sqft
|
built
2010
7529 Minette Ln, Baton Rouge, LA 70818
$-19
Cash flow
-0.2%
Cash-on-Cash Return
5.6%
Cap rate
0.7%
Rent to Value Ratio

Active
$389,900
3
bds
|
3
ba
|
2,194
sqft
|
built
1975
816 Daventry Dr, Baton Rouge, LA 70808
$-120
Cash flow
-1.6%
Cash-on-Cash Return
5.3%
Cap rate
0.6%
Rent to Value Ratio

Active
$650,000
3
bds
|
4
ba
|
2,601
sqft
|
built
2022
3158 Pointe Marie Dr, Baton Rouge, LA 70820
$-1,274
Cash flow
-10.2%
Cash-on-Cash Return
3.3%
Cap rate
0.4%
Rent to Value Ratio
Active
$30,000
2
bds
|
1
ba
|
902
sqft
|
built
1955
2334 Cherry St, Baton Rouge, LA 70802
$552
Cash flow
21.4%
Cash-on-Cash Return
22.1%
Cap rate
2.7%
Rent to Value Ratio
Active
$1,235,000
4
bds
|
5
ba
|
3,942
sqft
|
built
1997
7027 Woodstock Dr, Baton Rouge, LA 70809
$-1,982
Cash flow
-8.4%
Cash-on-Cash Return
3.8%
Cap rate
0.5%
Rent to Value Ratio

Active
$664,900
4
bds
|
5
ba
|
3,545
sqft
|
built
1969
4445 Pine Ridge Dr, Baton Rouge, LA 70809
$-456
Cash flow
-3.6%
Cash-on-Cash Return
4.9%
Cap rate
0.6%
Rent to Value Ratio

Active
$349,900
3
bds
|
3
ba
|
2,380
sqft
|
built
1979
5853 Hickory Ridge Blvd, Baton Rouge, LA 70817
$-280
Cash flow
-4.2%
Cash-on-Cash Return
4.7%
Cap rate
0.6%
Rent to Value Ratio
Active
$1,300,000
5
bds
|
5
ba
|
5,044
sqft
|
built
2005
9815 Myrtle Ln, Baton Rouge, LA 70810
$-1,978
Cash flow
-7.9%
Cash-on-Cash Return
3.9%
Cap rate
0.5%
Rent to Value Ratio
Active
$3,495,500
5
bds
|
6
ba
|
6,329
sqft
|
built
1994
17835 E Augusta Dr, Baton Rouge, LA 70810
$-11,297
Cash flow
-16.9%
Cash-on-Cash Return
1.8%
Cap rate
0.2%
Rent to Value Ratio

Active
$1,399,900
5
bds
|
6
ba
|
5,995
sqft
|
built
1965
6363 Sevenoaks Ave, Baton Rouge, LA 70806
$-1,864
Cash flow
-6.9%
Cash-on-Cash Return
4.1%
Cap rate
0.5%
Rent to Value Ratio

Active
$3,100,000
5
bds
|
5
ba
|
8,901
sqft
|
built
2008
22110 Rabbit Run Dr, Baton Rouge, LA 70817
$-10,594
Cash flow
-17.8%
Cash-on-Cash Return
1.6%
Cap rate
0.2%
Rent to Value Ratio
Active
$505,000
4
bds
|
3
ba
|
2,794
sqft
|
built
2002
3603 Twelve Oaks Ave, Baton Rouge, LA 70820
$-468
Cash flow
-4.8%
Cash-on-Cash Return
4.6%
Cap rate
0.6%
Rent to Value Ratio

Active
$950,000
3
bds
|
3
ba
|
2,755
sqft
|
built
1965
7160 Richards Dr, Baton Rouge, LA 70809
$-2,081
Cash flow
-11.4%
Cash-on-Cash Return
3.1%
Cap rate
0.4%
Rent to Value Ratio
Active
$795,000
2
bds
|
3
ba
|
3,252
sqft
|
built
2003
67 Jamestowne Ct, Baton Rouge, LA 70809
$-2,084
Cash flow
-13.7%
Cash-on-Cash Return
2.5%
Cap rate
0.4%
Rent to Value Ratio
Active
$294,900
3
bds
|
2
ba
|
2,080
sqft
|
built
1974
6964 Boone Ave, Baton Rouge, LA 70808
$-16
Cash flow
-0.3%
Cash-on-Cash Return
5.6%
Cap rate
0.7%
Rent to Value Ratio
Active
$365,000
4
bds
|
3
ba
|
1,805
sqft
|
built
2020
2624 Cork St, Baton Rouge, LA 70806
$67
Cash flow
1.0%
Cash-on-Cash Return
5.9%
Cap rate
0.7%
Rent to Value Ratio
Active
$255,000
3
bds
|
3
ba
|
2,246
sqft
|
built
1958
8444 S Essen Heights Ct, Baton Rouge, LA 70809
$173
Cash flow
3.5%
Cash-on-Cash Return
6.5%
Cap rate
0.8%
Rent to Value Ratio
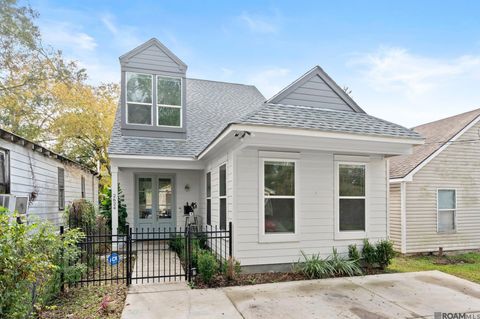
Active
$409,000
4
bds
|
3
ba
|
2,065
sqft
|
built
2020
503 Gadwell Dr, Baton Rouge, LA 70810
$32
Cash flow
0.4%
Cash-on-Cash Return
5.8%
Cap rate
0.7%
Rent to Value Ratio