Baton Rouge, LA Investment Properties for Sale
Browse homes for sale and investment properties in Baton Rouge, LA. Refine your search by price, property type, or more.
Best cash flowing properties in Baton Rouge, LA

Active
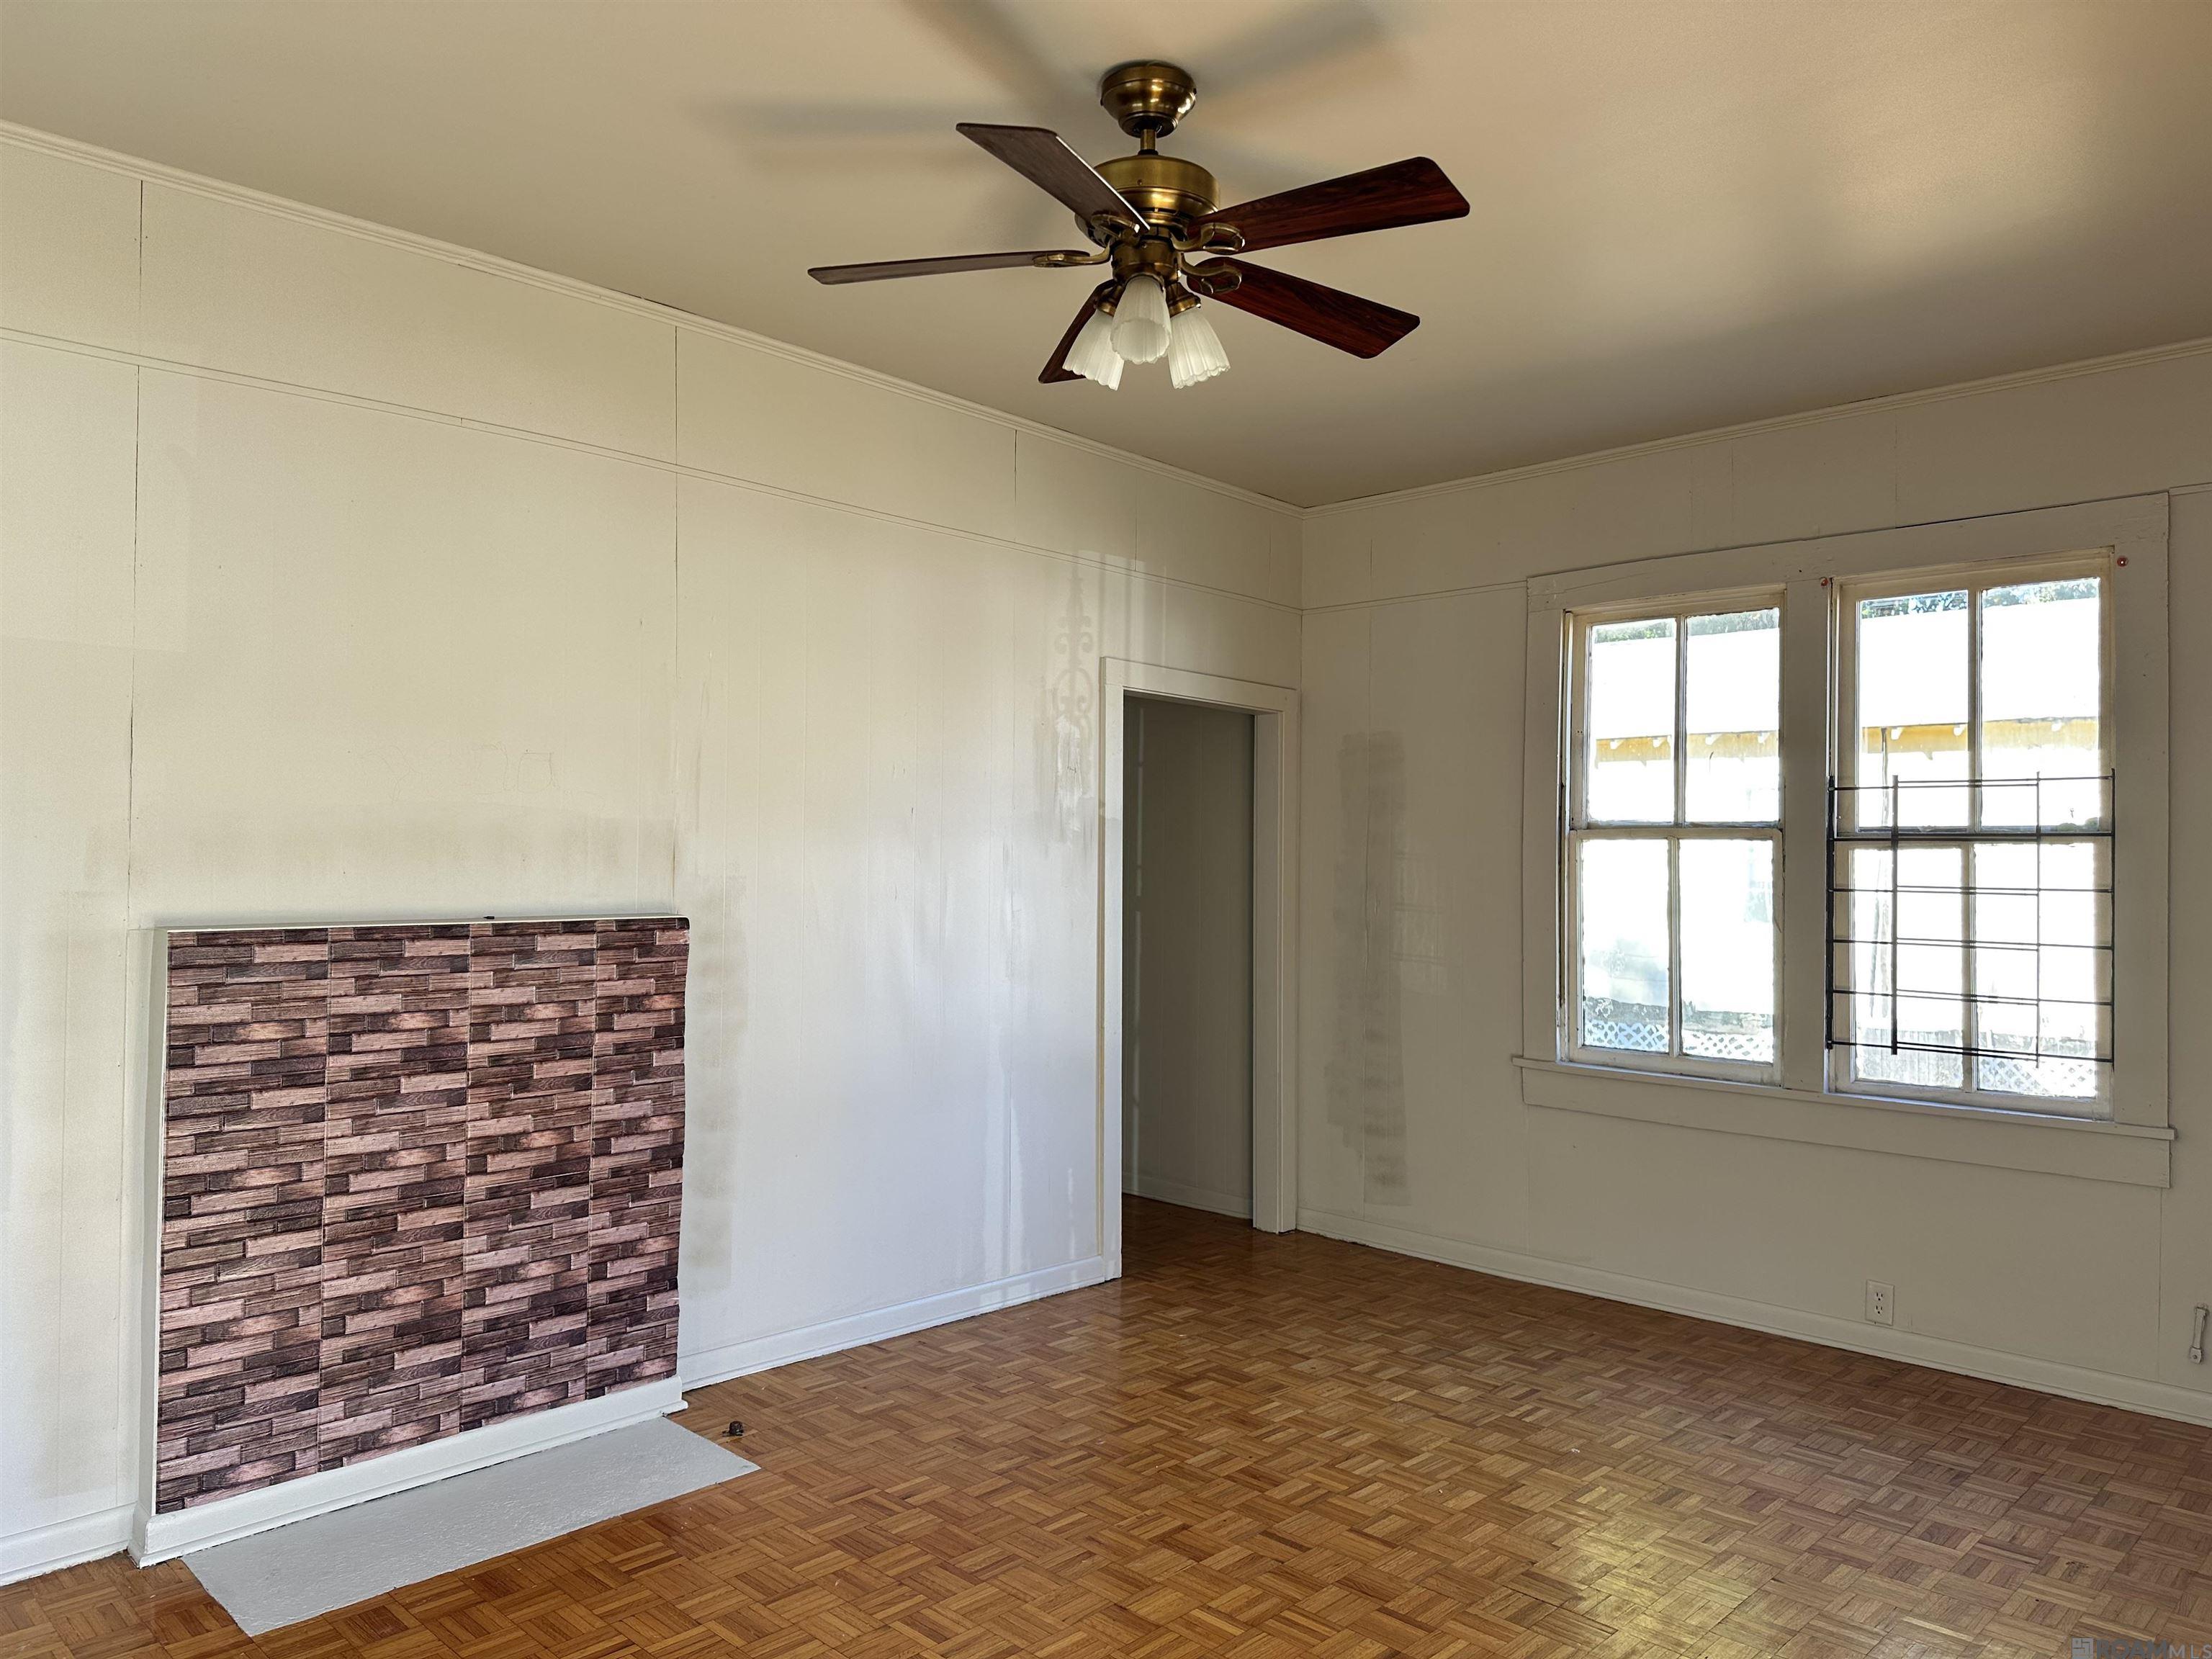
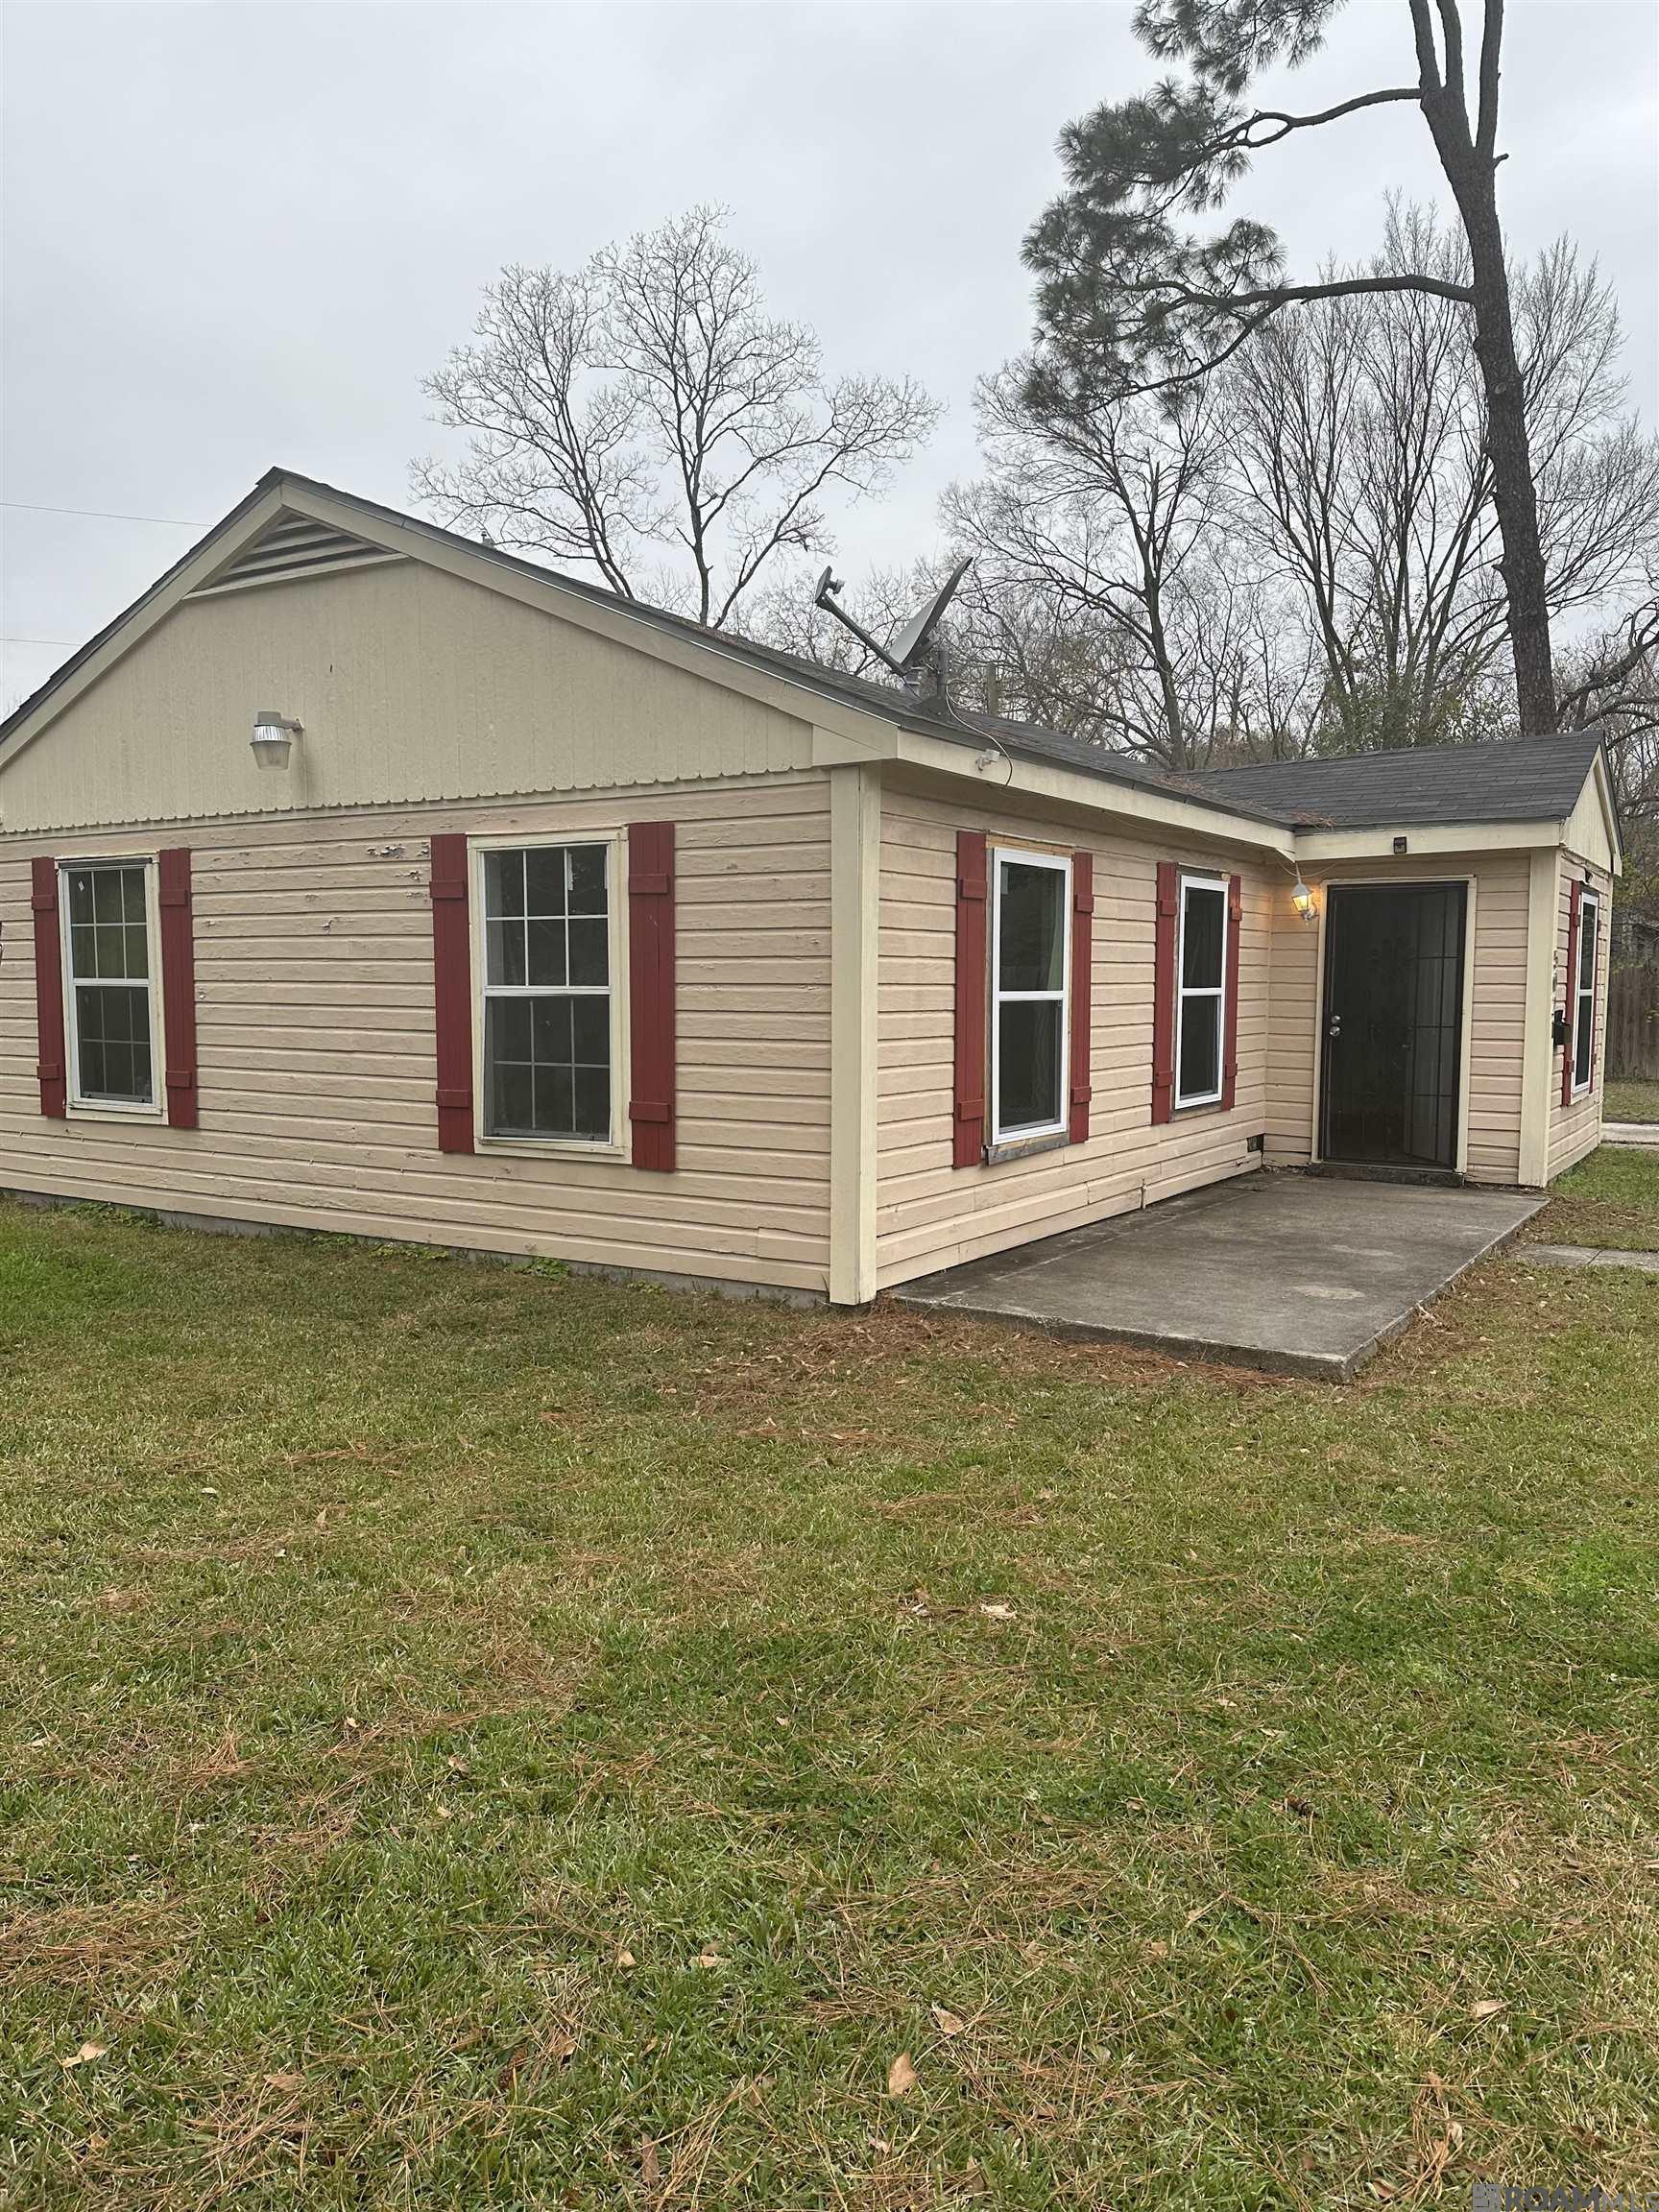
$60,000
2
bds
|
1
ba
|
1,234
sqft
|
built
1970
5089 Sycamore St, Baton Rouge, LA 70805
$828
Cash flow
16.1%
Cash-on-Cash Return
16.6%
Cap rate
2.0%
Rent to Value Ratio
Active
$57,500
2
bds
|
1
ba
|
1,080
sqft
|
built
1950
314 S 18th St, Baton Rouge, LA 70802
$690
Cash flow
14.0%
Cash-on-Cash Return
14.4%
Cap rate
1.7%
Rent to Value Ratio
986 out of 1,271 properties for sale in Baton Rouge, LA
Limited Results Shown
Create a free account, or log in to reveal all property listings and enjoy the complete experience.

Active
$470,000
4
bds
|
3
ba
|
2,236
sqft
|
built
2021
13085 Elissa Ln, Baton Rouge, LA 70818
$-725
Cash flow
-8.0%
Cash-on-Cash Return
4.4%
Cap rate
0.6%
Rent to Value Ratio

Active
$425,000
4
bds
|
3
ba
|
2,486
sqft
|
built
2022
13842 Bellacosa Ave, Baton Rouge, LA 70817
$-1,187
Cash flow
-14.6%
Cash-on-Cash Return
2.9%
Cap rate
0.4%
Rent to Value Ratio
Active
$574,900
4
bds
|
4
ba
|
2,998
sqft
|
built
2010
7529 Minette Ln, Baton Rouge, LA 70818
$-309
Cash flow
-2.8%
Cash-on-Cash Return
5.6%
Cap rate
0.7%
Rent to Value Ratio
Active
$1,399,900
5
bds
|
6
ba
|
5,995
sqft
|
built
1965
6363 Sevenoaks Ave, Baton Rouge, LA 70806
$-2,570
Cash flow
-9.6%
Cash-on-Cash Return
4.1%
Cap rate
0.5%
Rent to Value Ratio
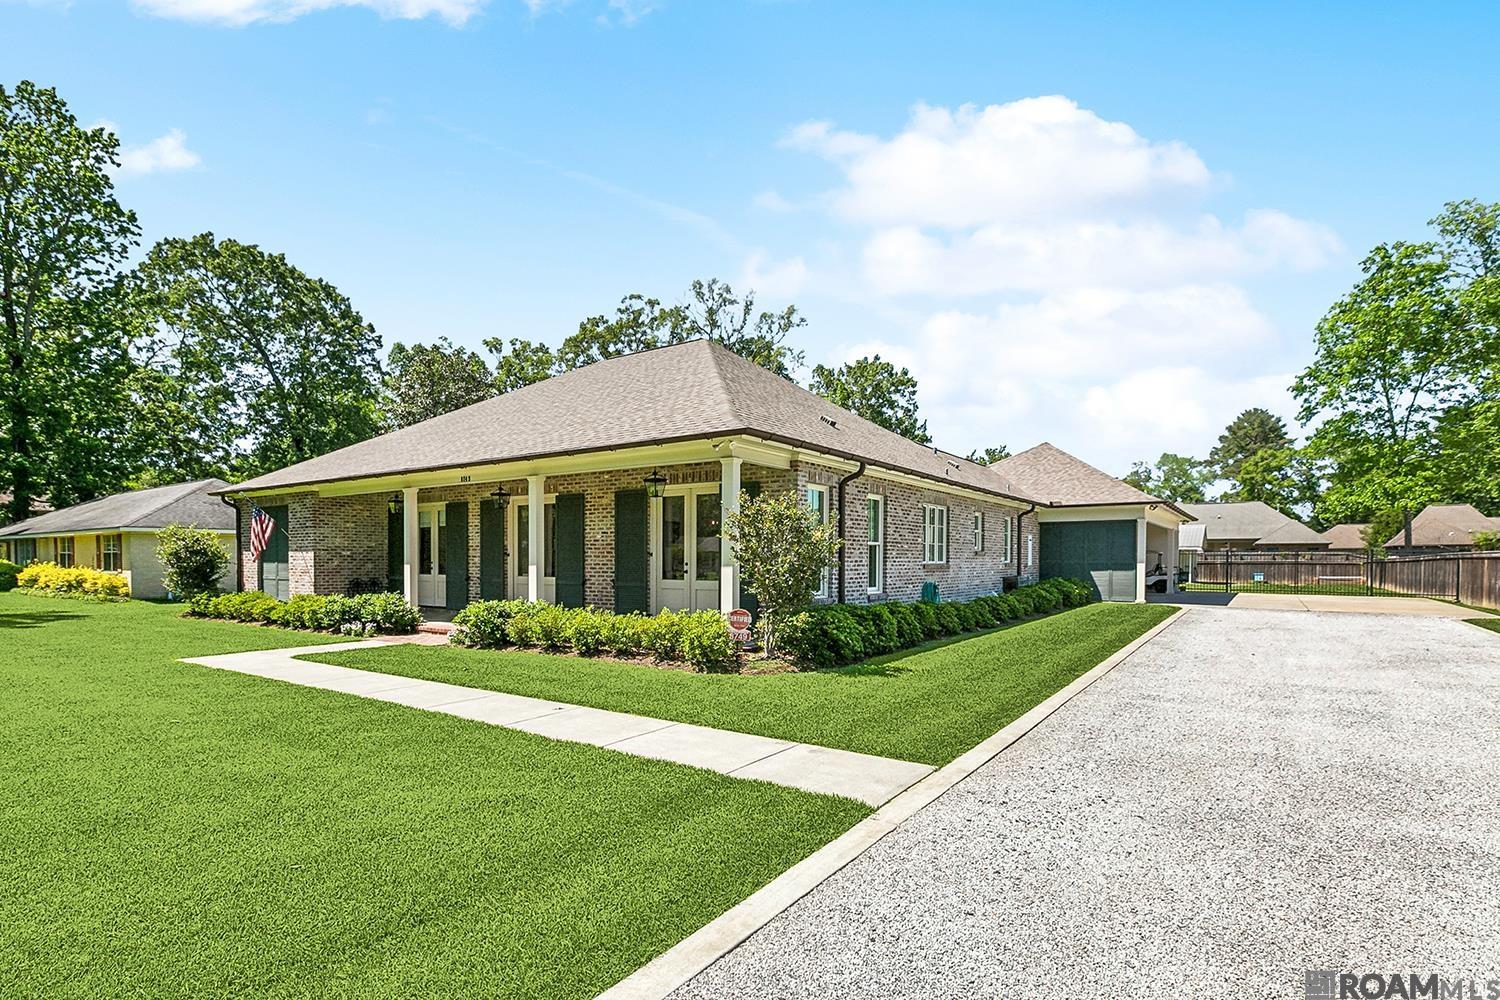
Active
$820,000
3
bds
|
3
ba
|
2,590
sqft
|
built
2020
8749 Gail Dr, Baton Rouge, LA 70809
$-2,707
Cash flow
-17.2%
Cash-on-Cash Return
2.3%
Cap rate
0.3%
Rent to Value Ratio
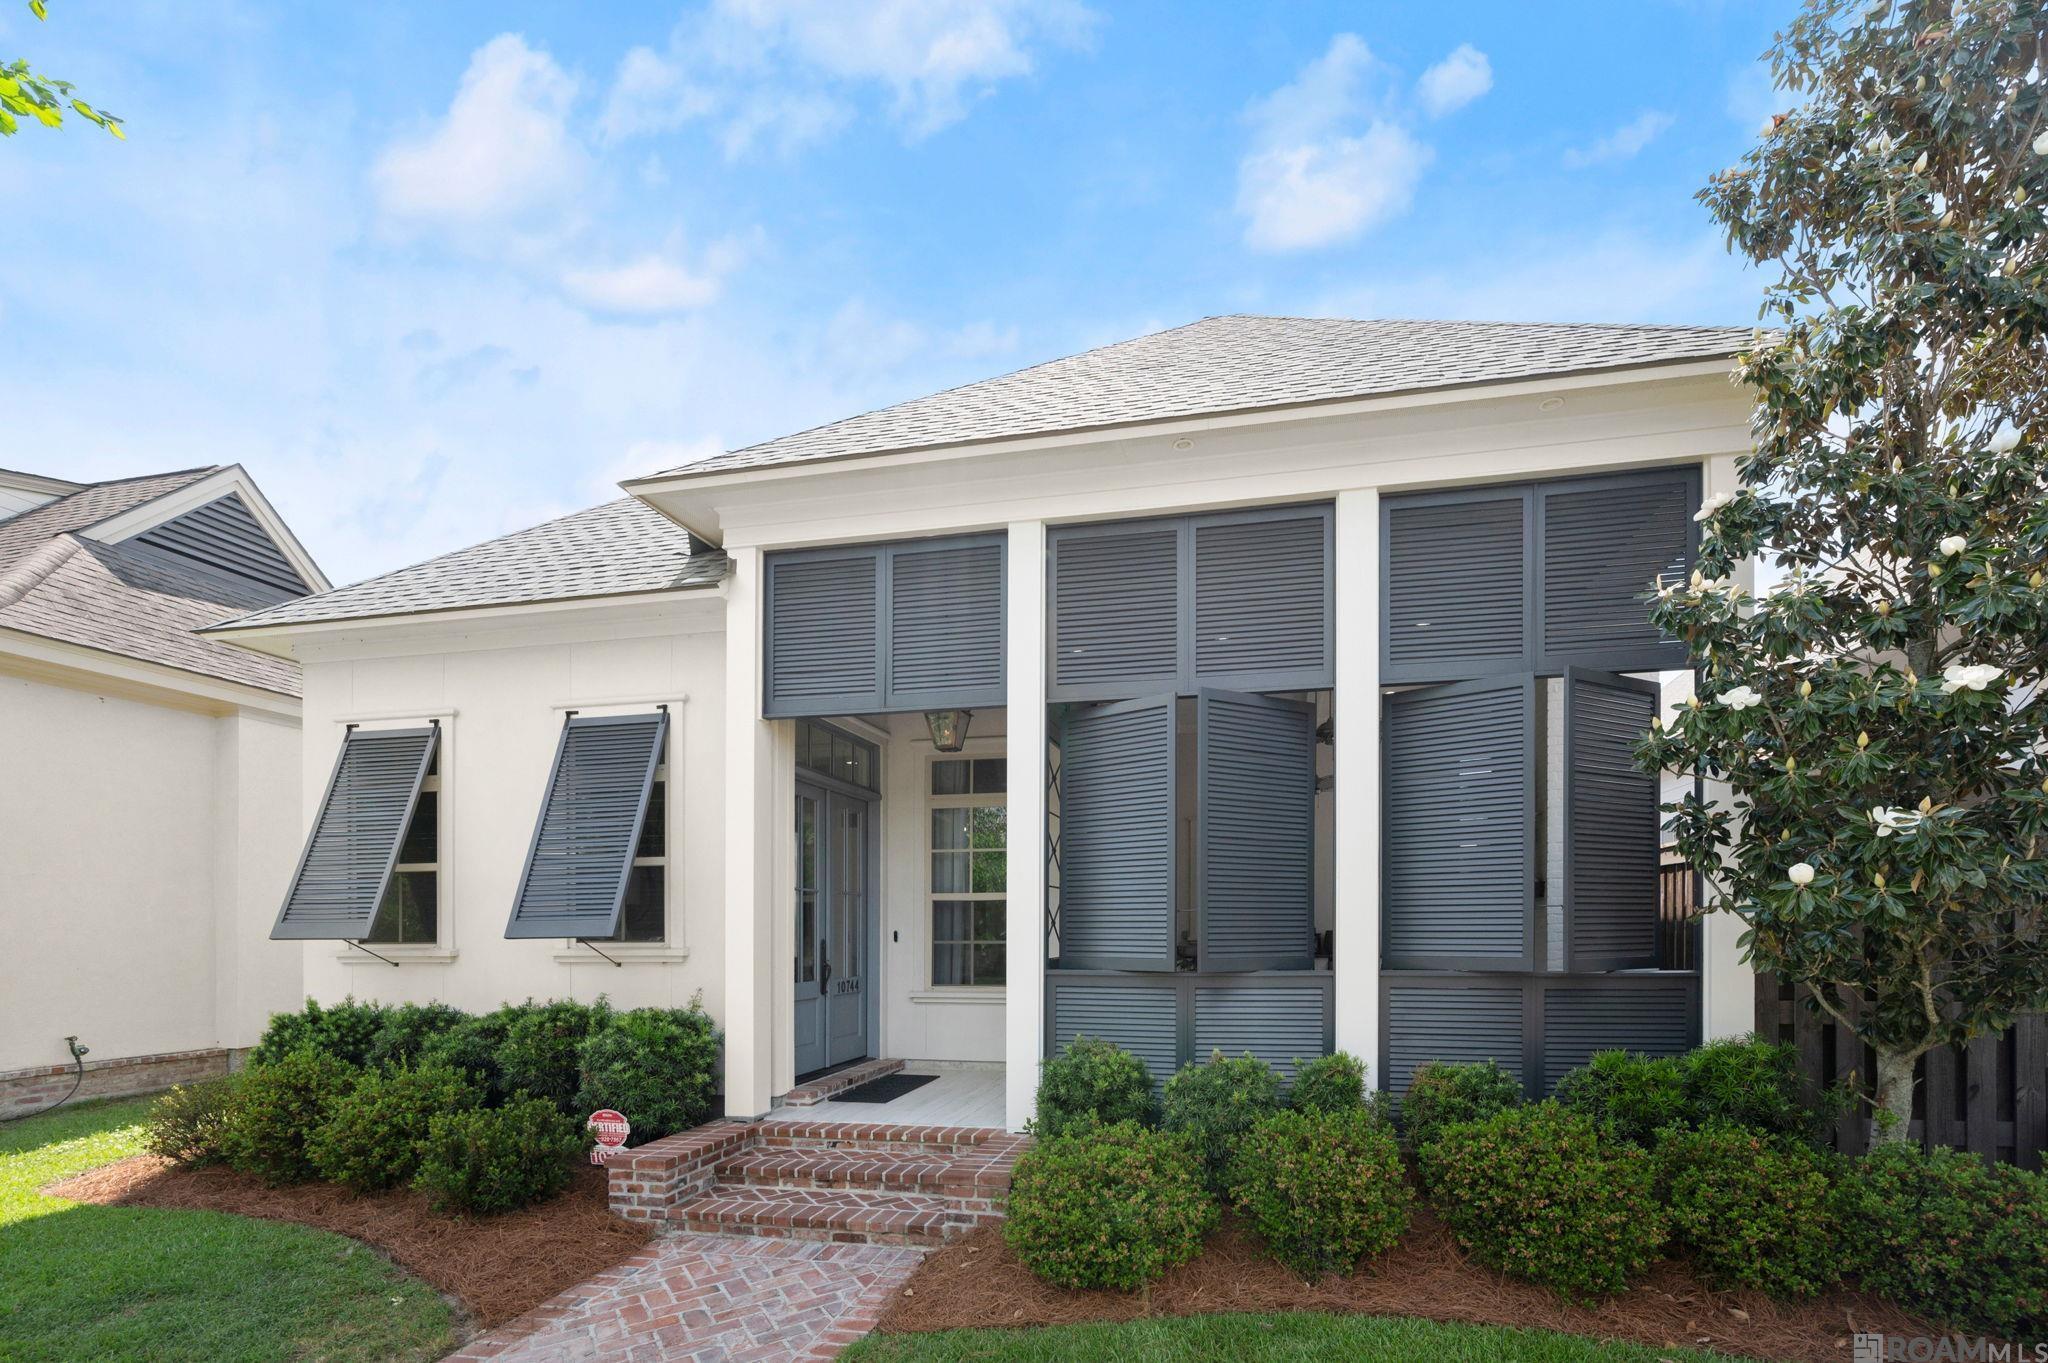
Active
$807,500
5
bds
|
4
ba
|
3,160
sqft
|
built
2018
10744 Cane River Dr, Baton Rouge, LA 70810
$-1,870
Cash flow
-12.1%
Cash-on-Cash Return
3.5%
Cap rate
0.4%
Rent to Value Ratio
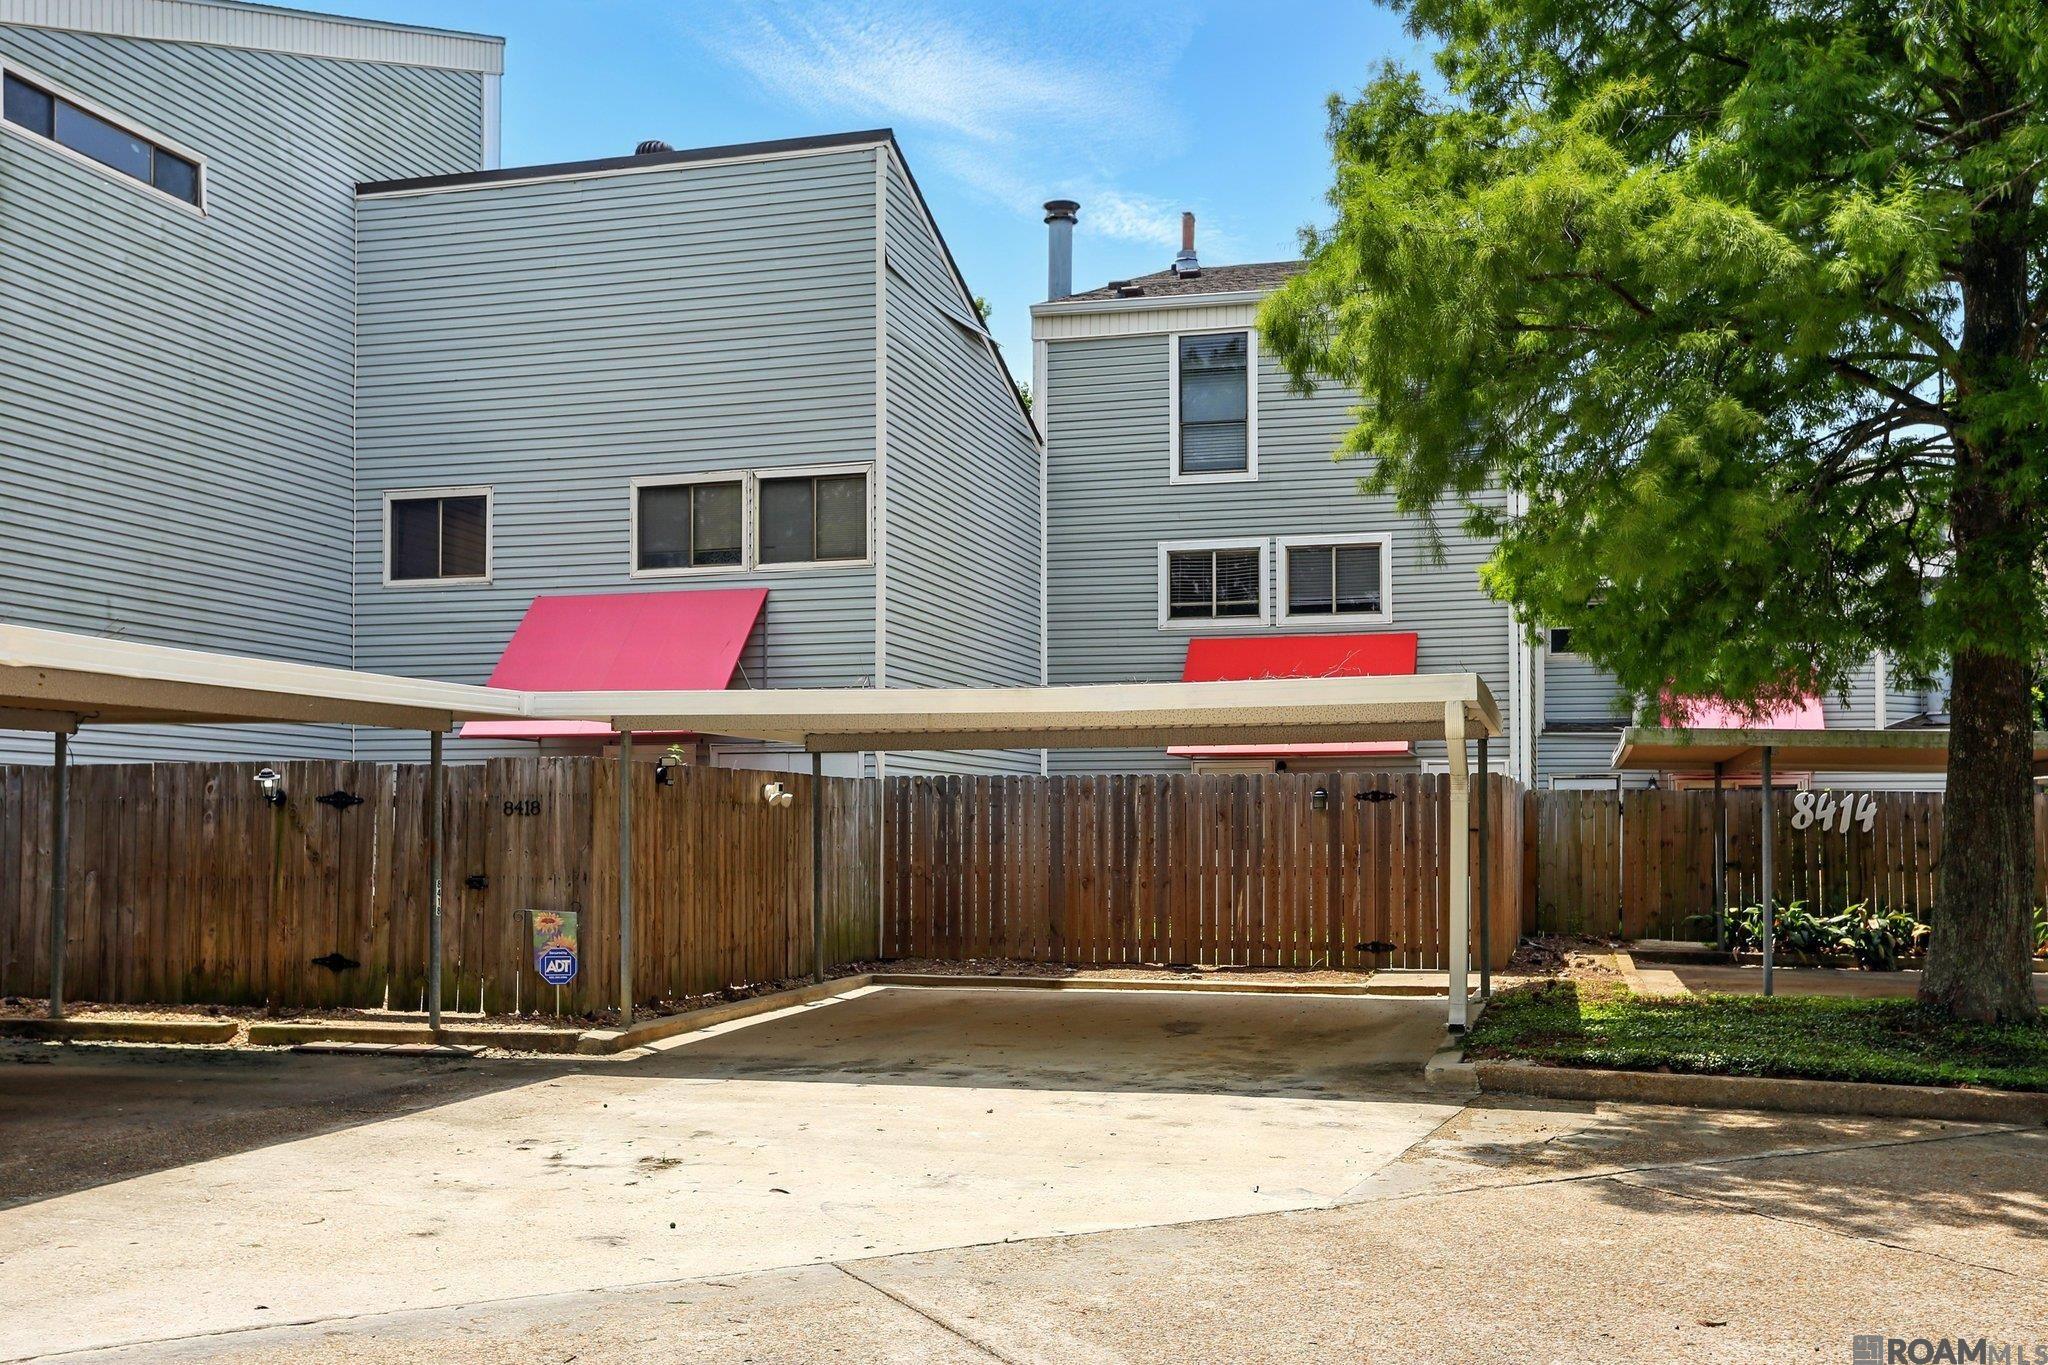
Active
$220,000
3
bds
|
3
ba
|
1,521
sqft
|
built
1985
8416 E Cypress Point Ct, Baton Rouge, LA 70809
$40
Cash flow
0.9%
Cash-on-Cash Return
6.5%
Cap rate
0.8%
Rent to Value Ratio
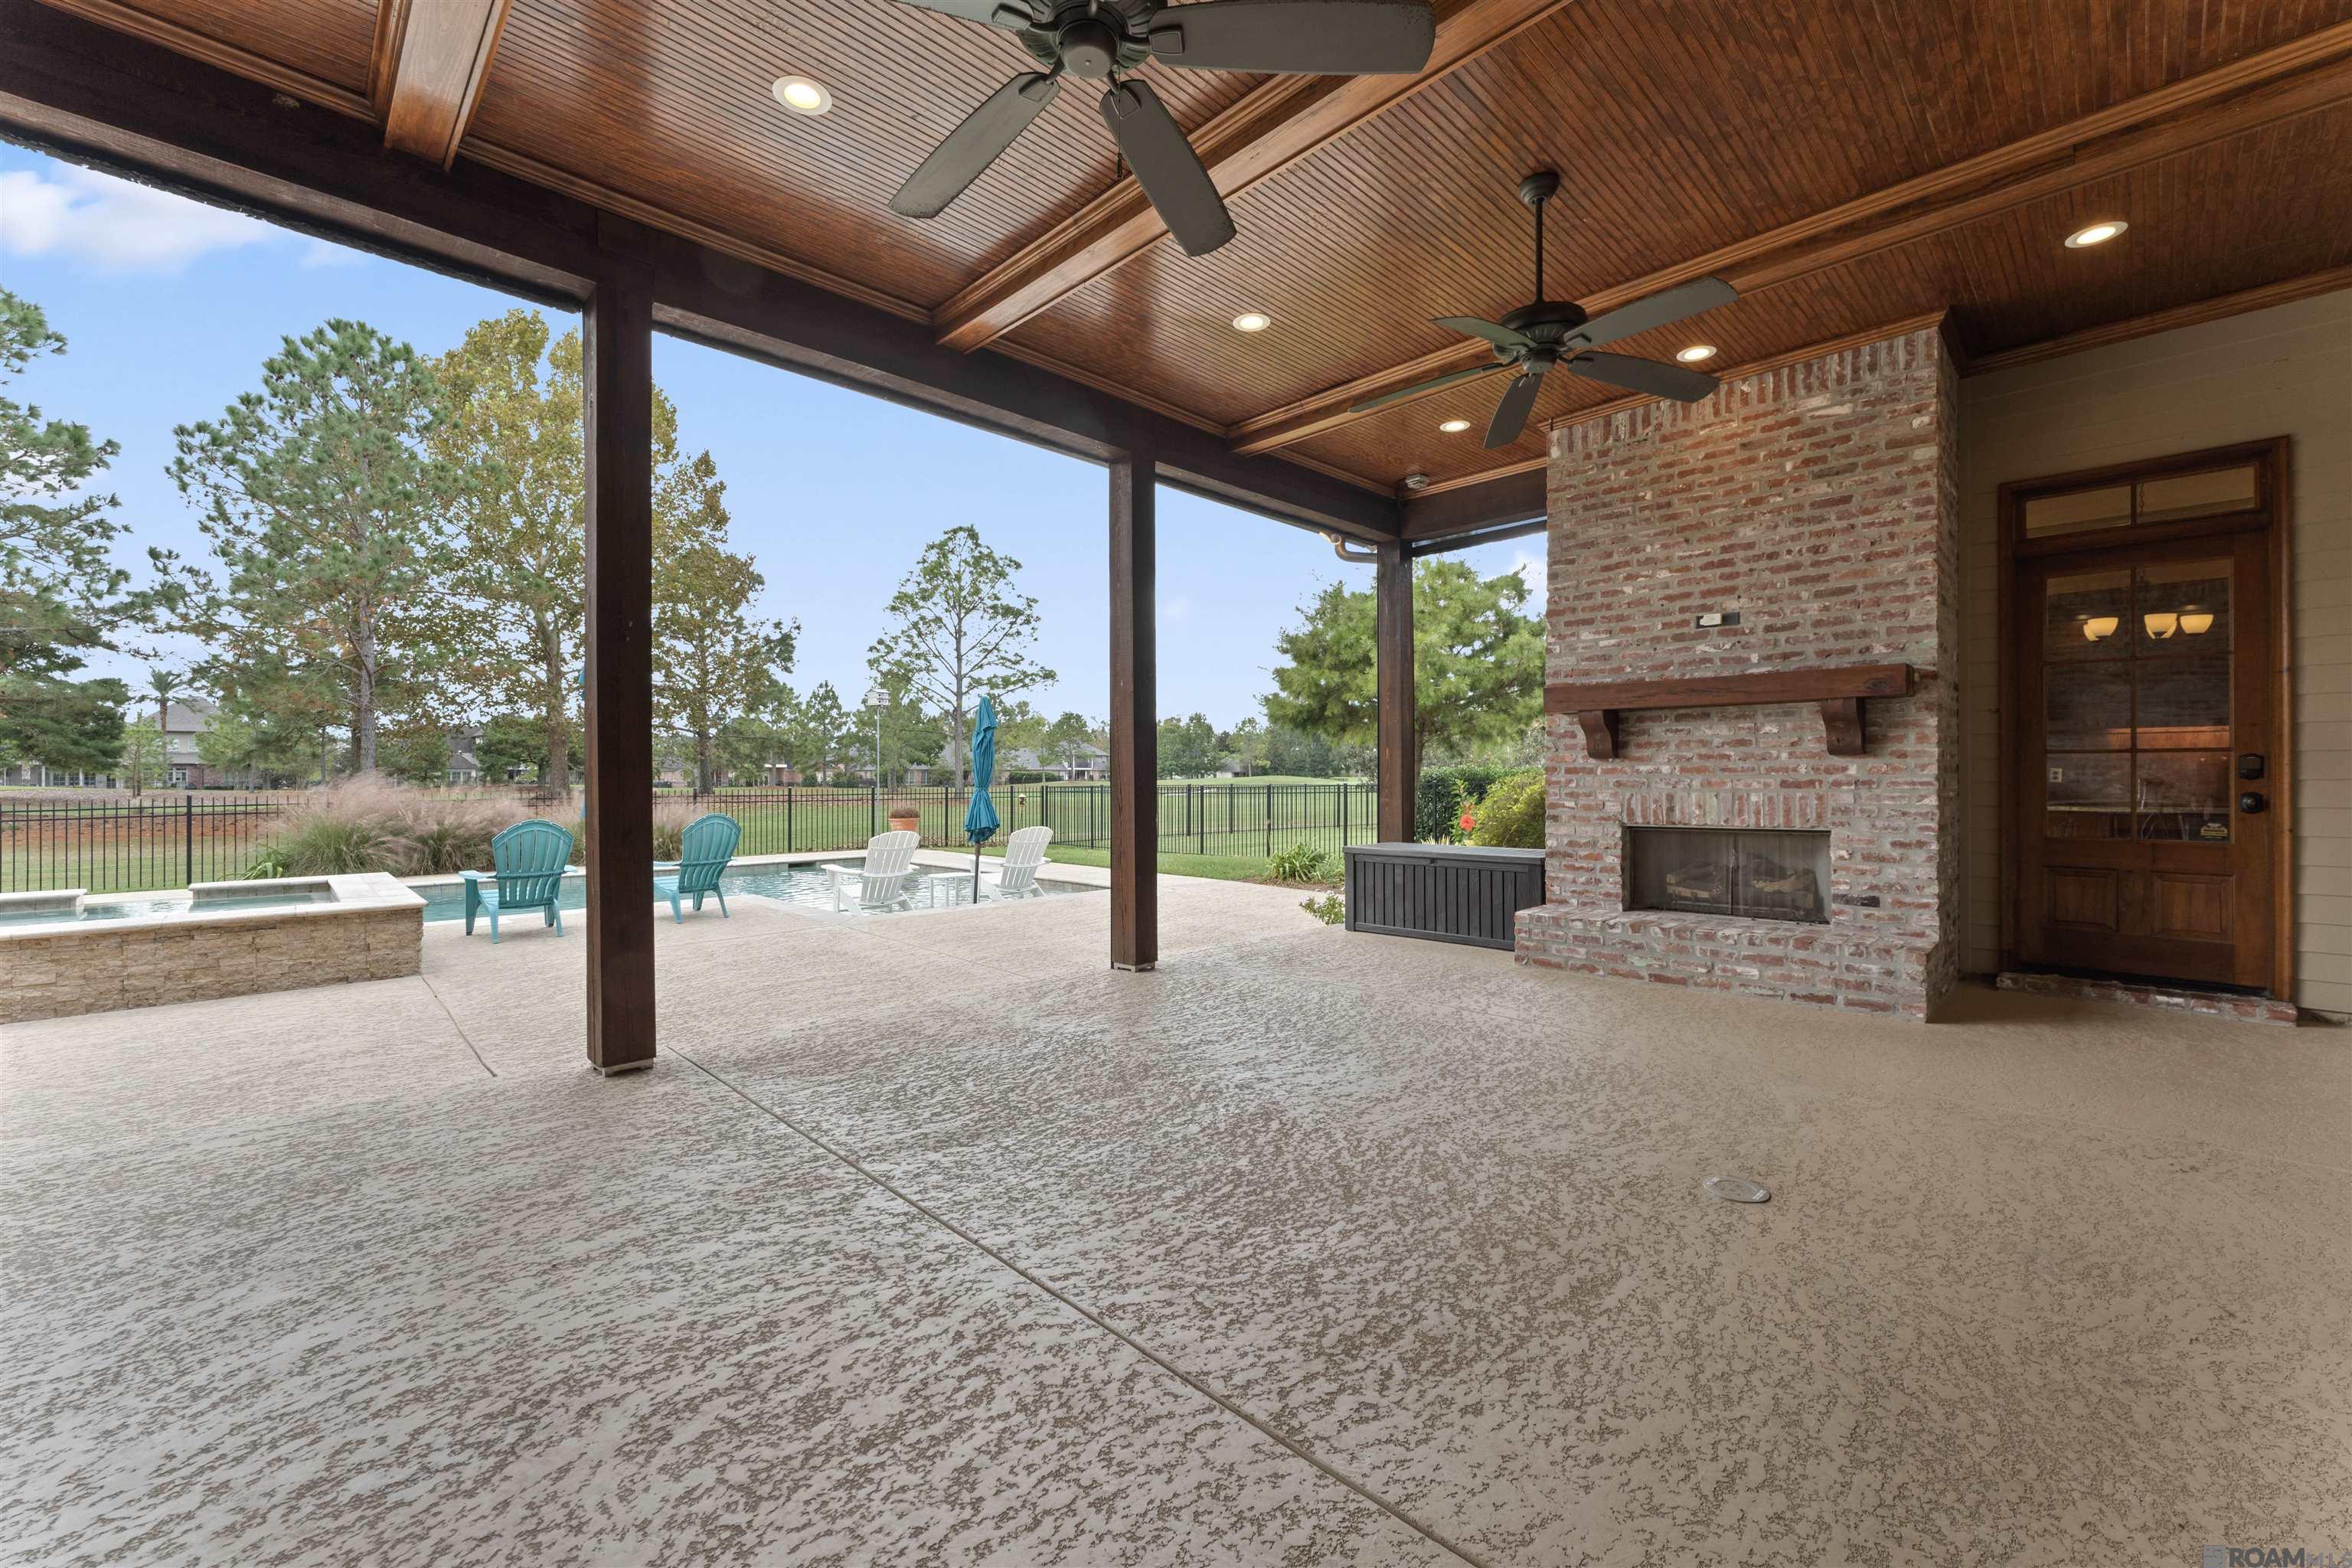
Active
$835,000
4
bds
|
6
ba
|
3,101
sqft
|
built
2018
2631 Tiger Crossing Dr, Baton Rouge, LA 70810
$-1,140
Cash flow
-7.1%
Cash-on-Cash Return
4.6%
Cap rate
0.6%
Rent to Value Ratio
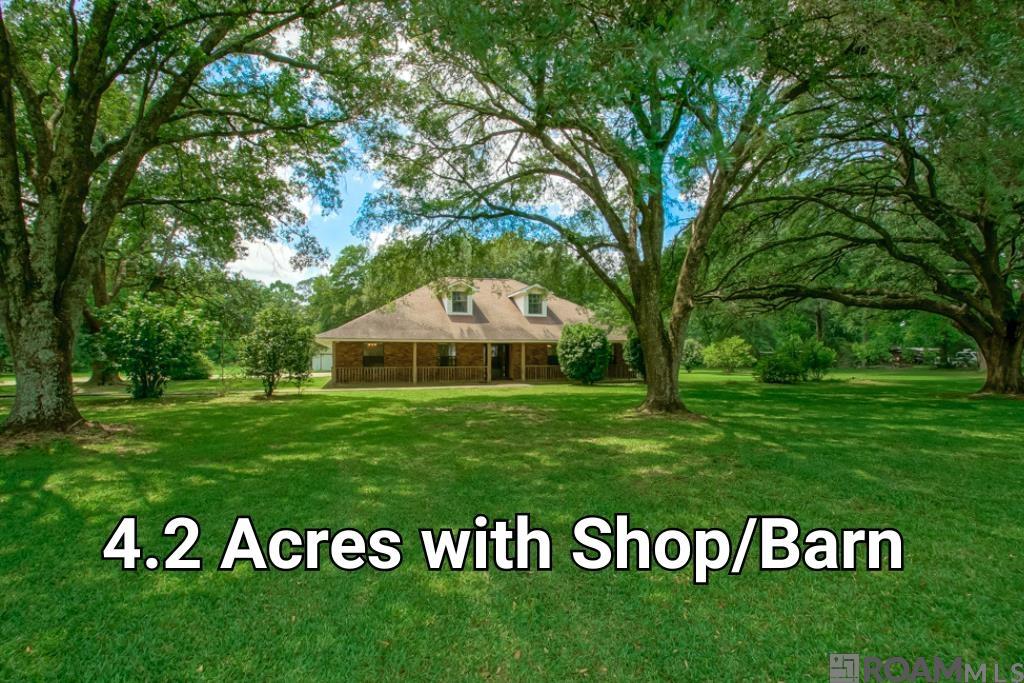
Active
$575,000
3
bds
|
3
ba
|
2,888
sqft
|
built
1977
9655 Sullivan Rd, Baton Rouge, LA 70818
$-1,286
Cash flow
-11.7%
Cash-on-Cash Return
3.6%
Cap rate
0.4%
Rent to Value Ratio
Active
$664,900
4
bds
|
5
ba
|
3,545
sqft
|
built
1969
4445 Pine Ridge Dr, Baton Rouge, LA 70809
$-791
Cash flow
-6.2%
Cash-on-Cash Return
4.9%
Cap rate
0.6%
Rent to Value Ratio
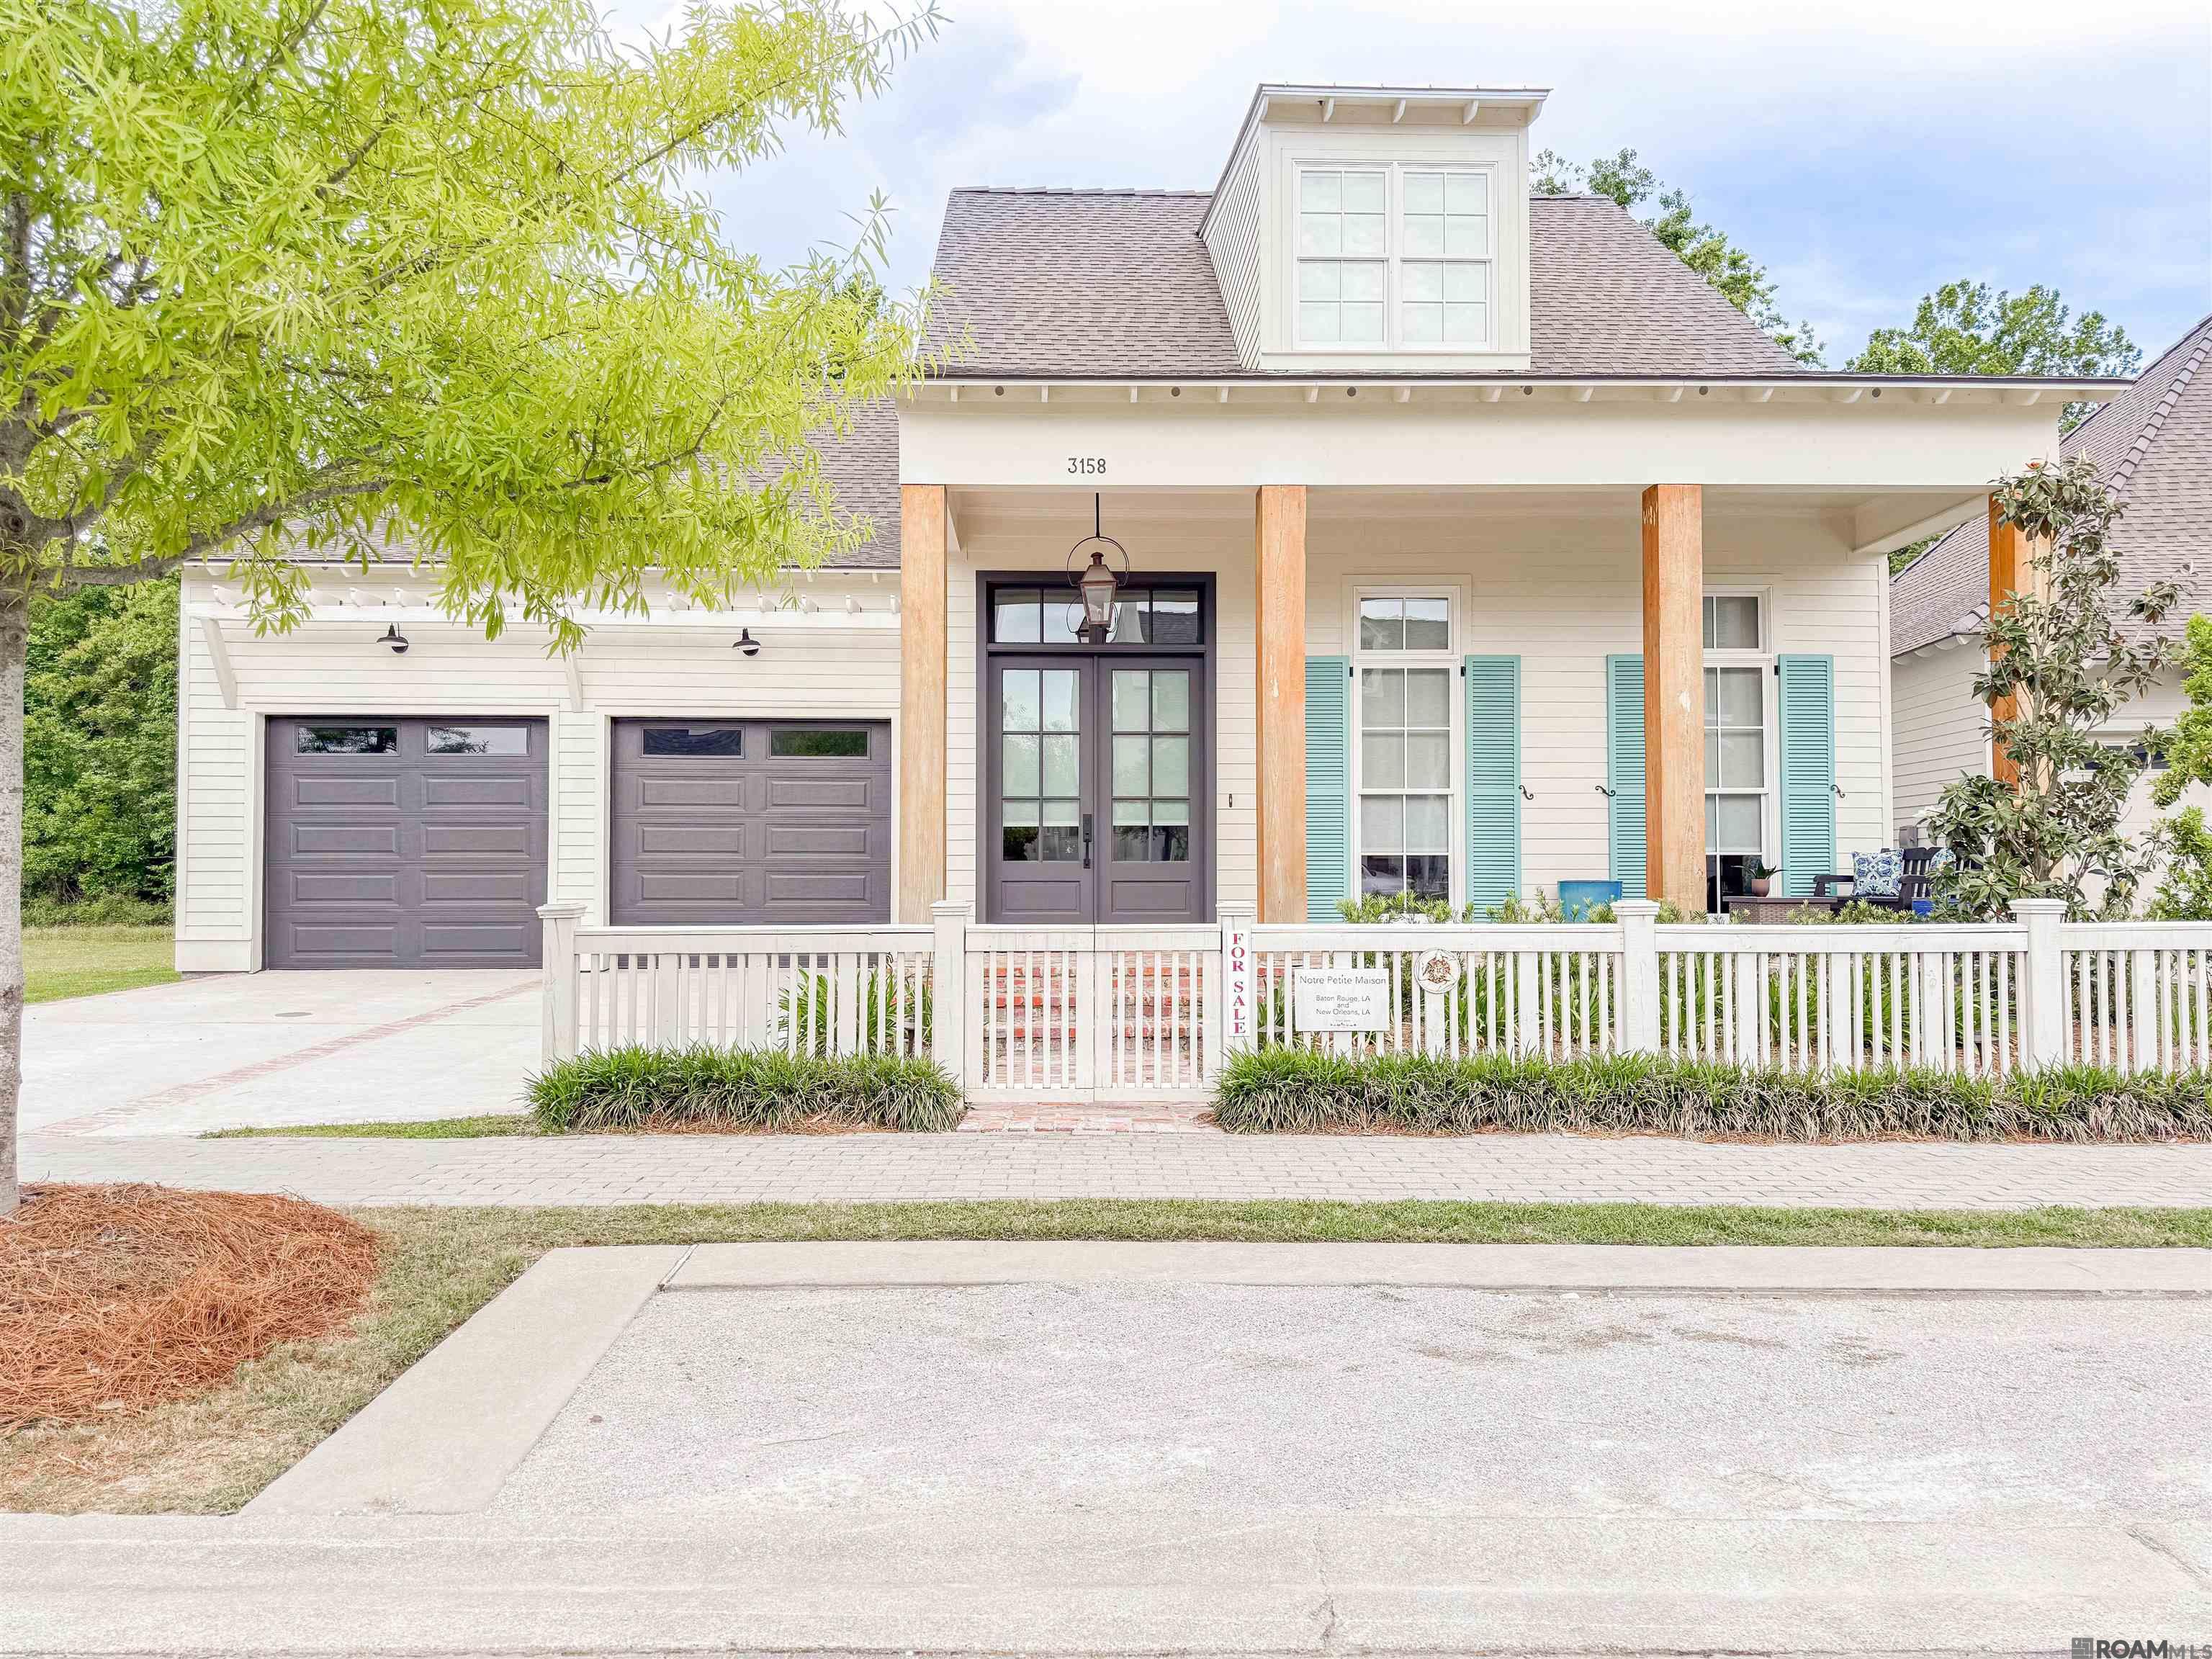
Active
$650,000
3
bds
|
4
ba
|
2,601
sqft
|
built
2022
3158 Pointe Marie Dr, Baton Rouge, LA 70820
$-1,602
Cash flow
-12.9%
Cash-on-Cash Return
3.3%
Cap rate
0.4%
Rent to Value Ratio
Active
$349,900
3
bds
|
3
ba
|
2,380
sqft
|
built
1979
5853 Hickory Ridge Blvd, Baton Rouge, LA 70817
$-456
Cash flow
-6.8%
Cash-on-Cash Return
4.7%
Cap rate
0.6%
Rent to Value Ratio
Active
$3,100,000
5
bds
|
5
ba
|
8,901
sqft
|
built
2008
22110 Rabbit Run Dr, Baton Rouge, LA 70817
$-12,158
Cash flow
-20.5%
Cash-on-Cash Return
1.6%
Cap rate
0.2%
Rent to Value Ratio

Active
$30,000
2
bds
|
1
ba
|
902
sqft
|
built
1955
2334 Cherry St, Baton Rouge, LA 70802
$552
Cash flow
21.4%
Cash-on-Cash Return
22.1%
Cap rate
2.7%
Rent to Value Ratio
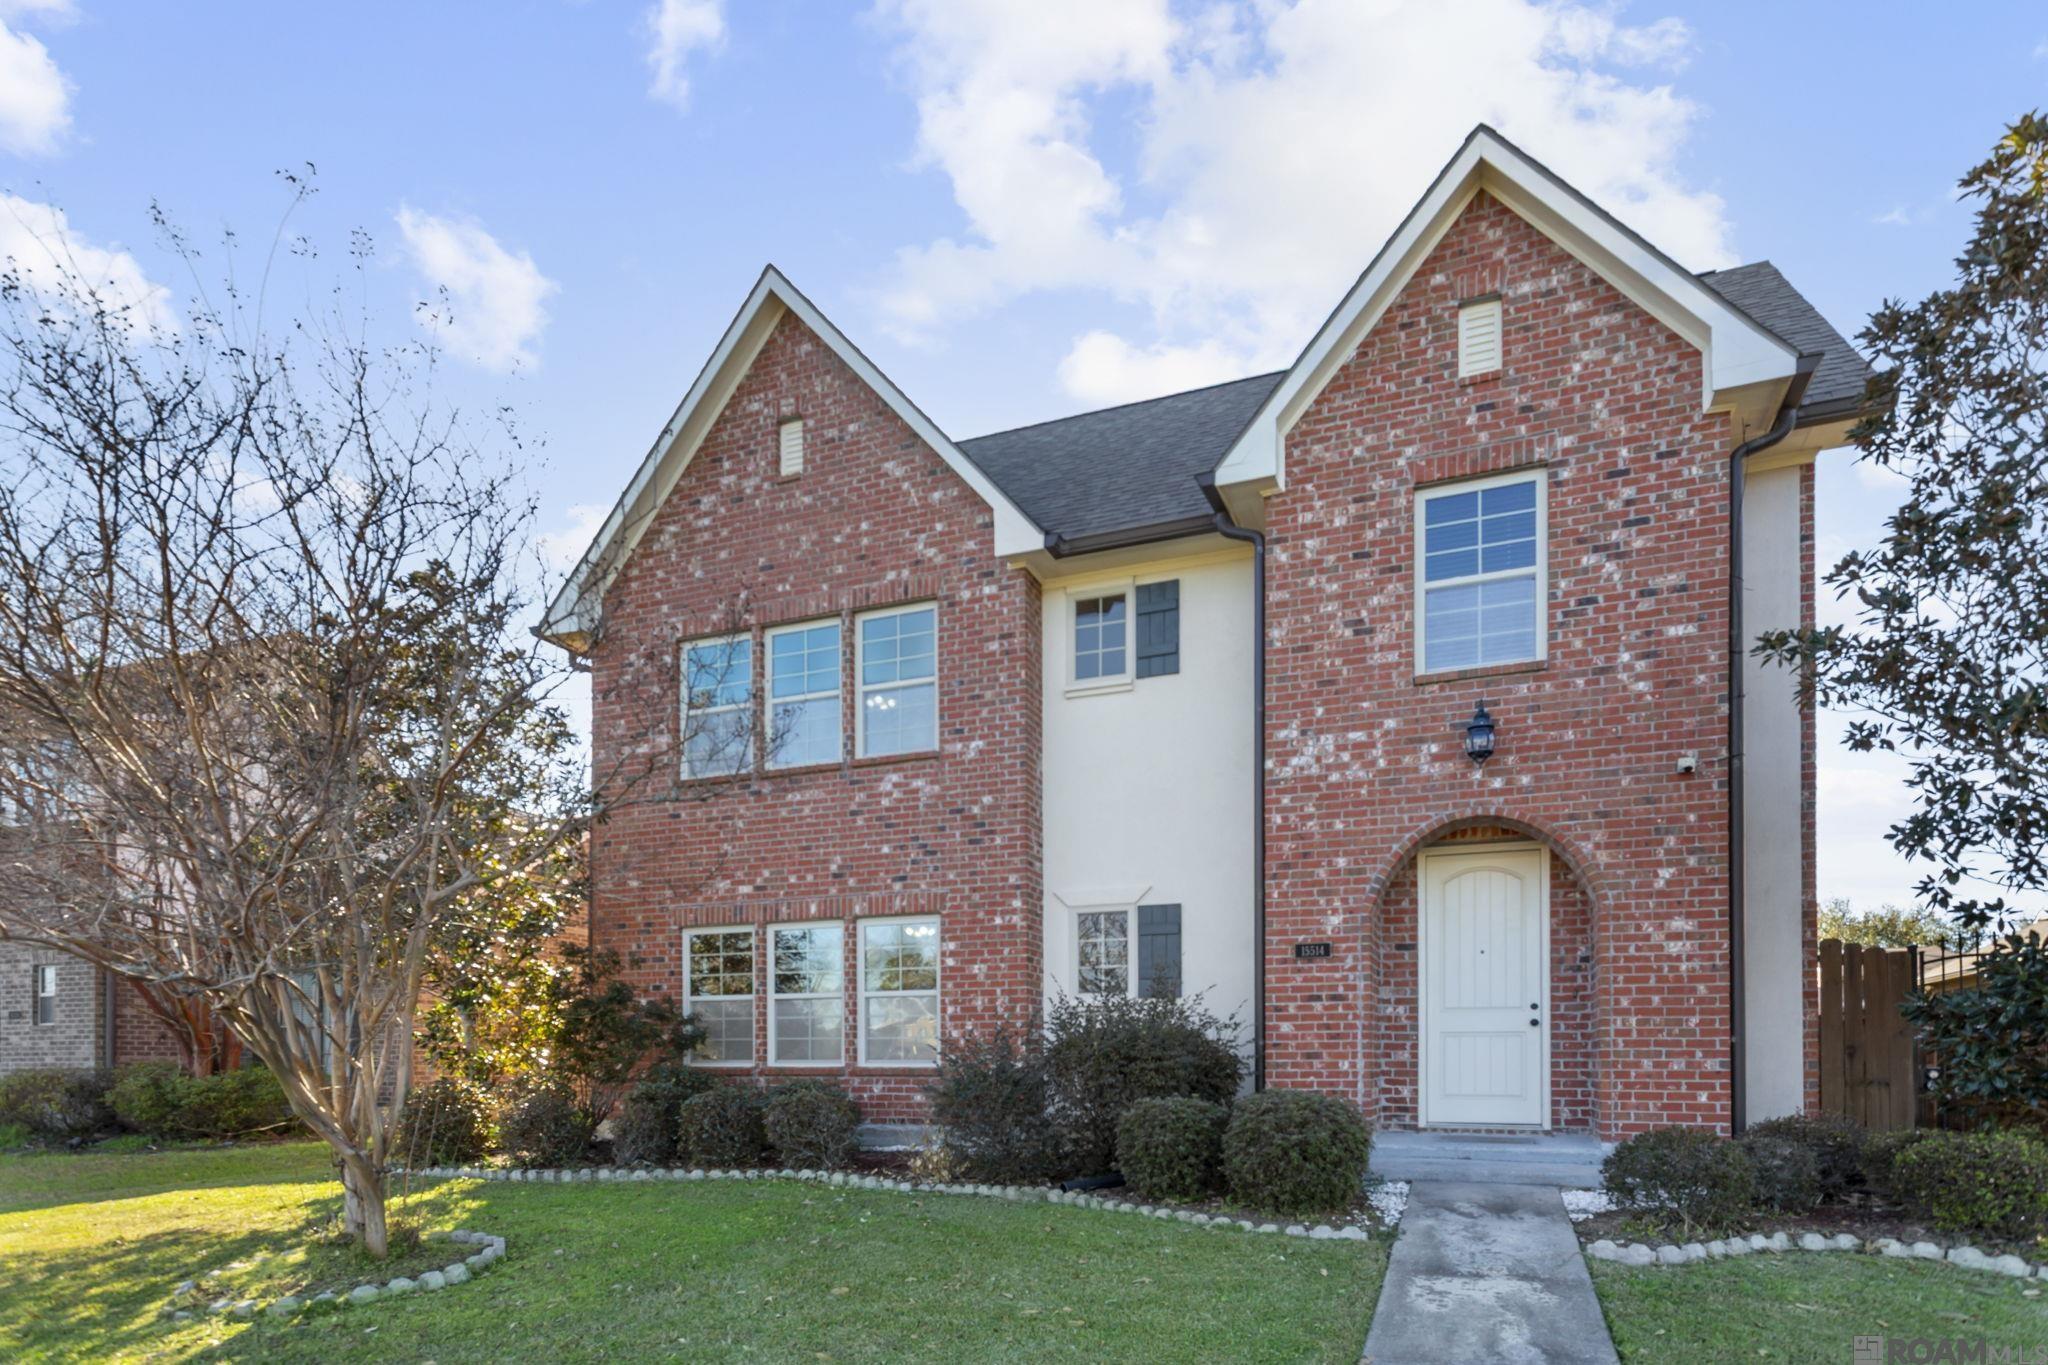
Active
$415,000
3
bds
|
3
ba
|
2,598
sqft
|
built
2011
15514 Green Trails Blvd, Baton Rouge, LA 70817
$-276
Cash flow
-3.5%
Cash-on-Cash Return
5.5%
Cap rate
0.7%
Rent to Value Ratio
Active
$400,000
3
bds
|
3
ba
|
2,194
sqft
|
built
1975
816 Daventry Dr, Baton Rouge, LA 70808
$-370
Cash flow
-4.8%
Cash-on-Cash Return
5.2%
Cap rate
0.6%
Rent to Value Ratio
Active
$950,000
3
bds
|
3
ba
|
2,755
sqft
|
built
1965
7160 Richards Dr, Baton Rouge, LA 70809
$-2,560
Cash flow
-14.1%
Cash-on-Cash Return
3.1%
Cap rate
0.4%
Rent to Value Ratio
Active
$1,300,000
5
bds
|
5
ba
|
5,044
sqft
|
built
2005
9815 Myrtle Ln, Baton Rouge, LA 70810
$-2,634
Cash flow
-10.6%
Cash-on-Cash Return
3.9%
Cap rate
0.5%
Rent to Value Ratio
Active
$675,000
4
bds
|
4
ba
|
3,494
sqft
|
built
2005
3216 Broad Magnolia Ct, Baton Rouge, LA 70810
$-647
Cash flow
-5.0%
Cash-on-Cash Return
5.1%
Cap rate
0.7%
Rent to Value Ratio
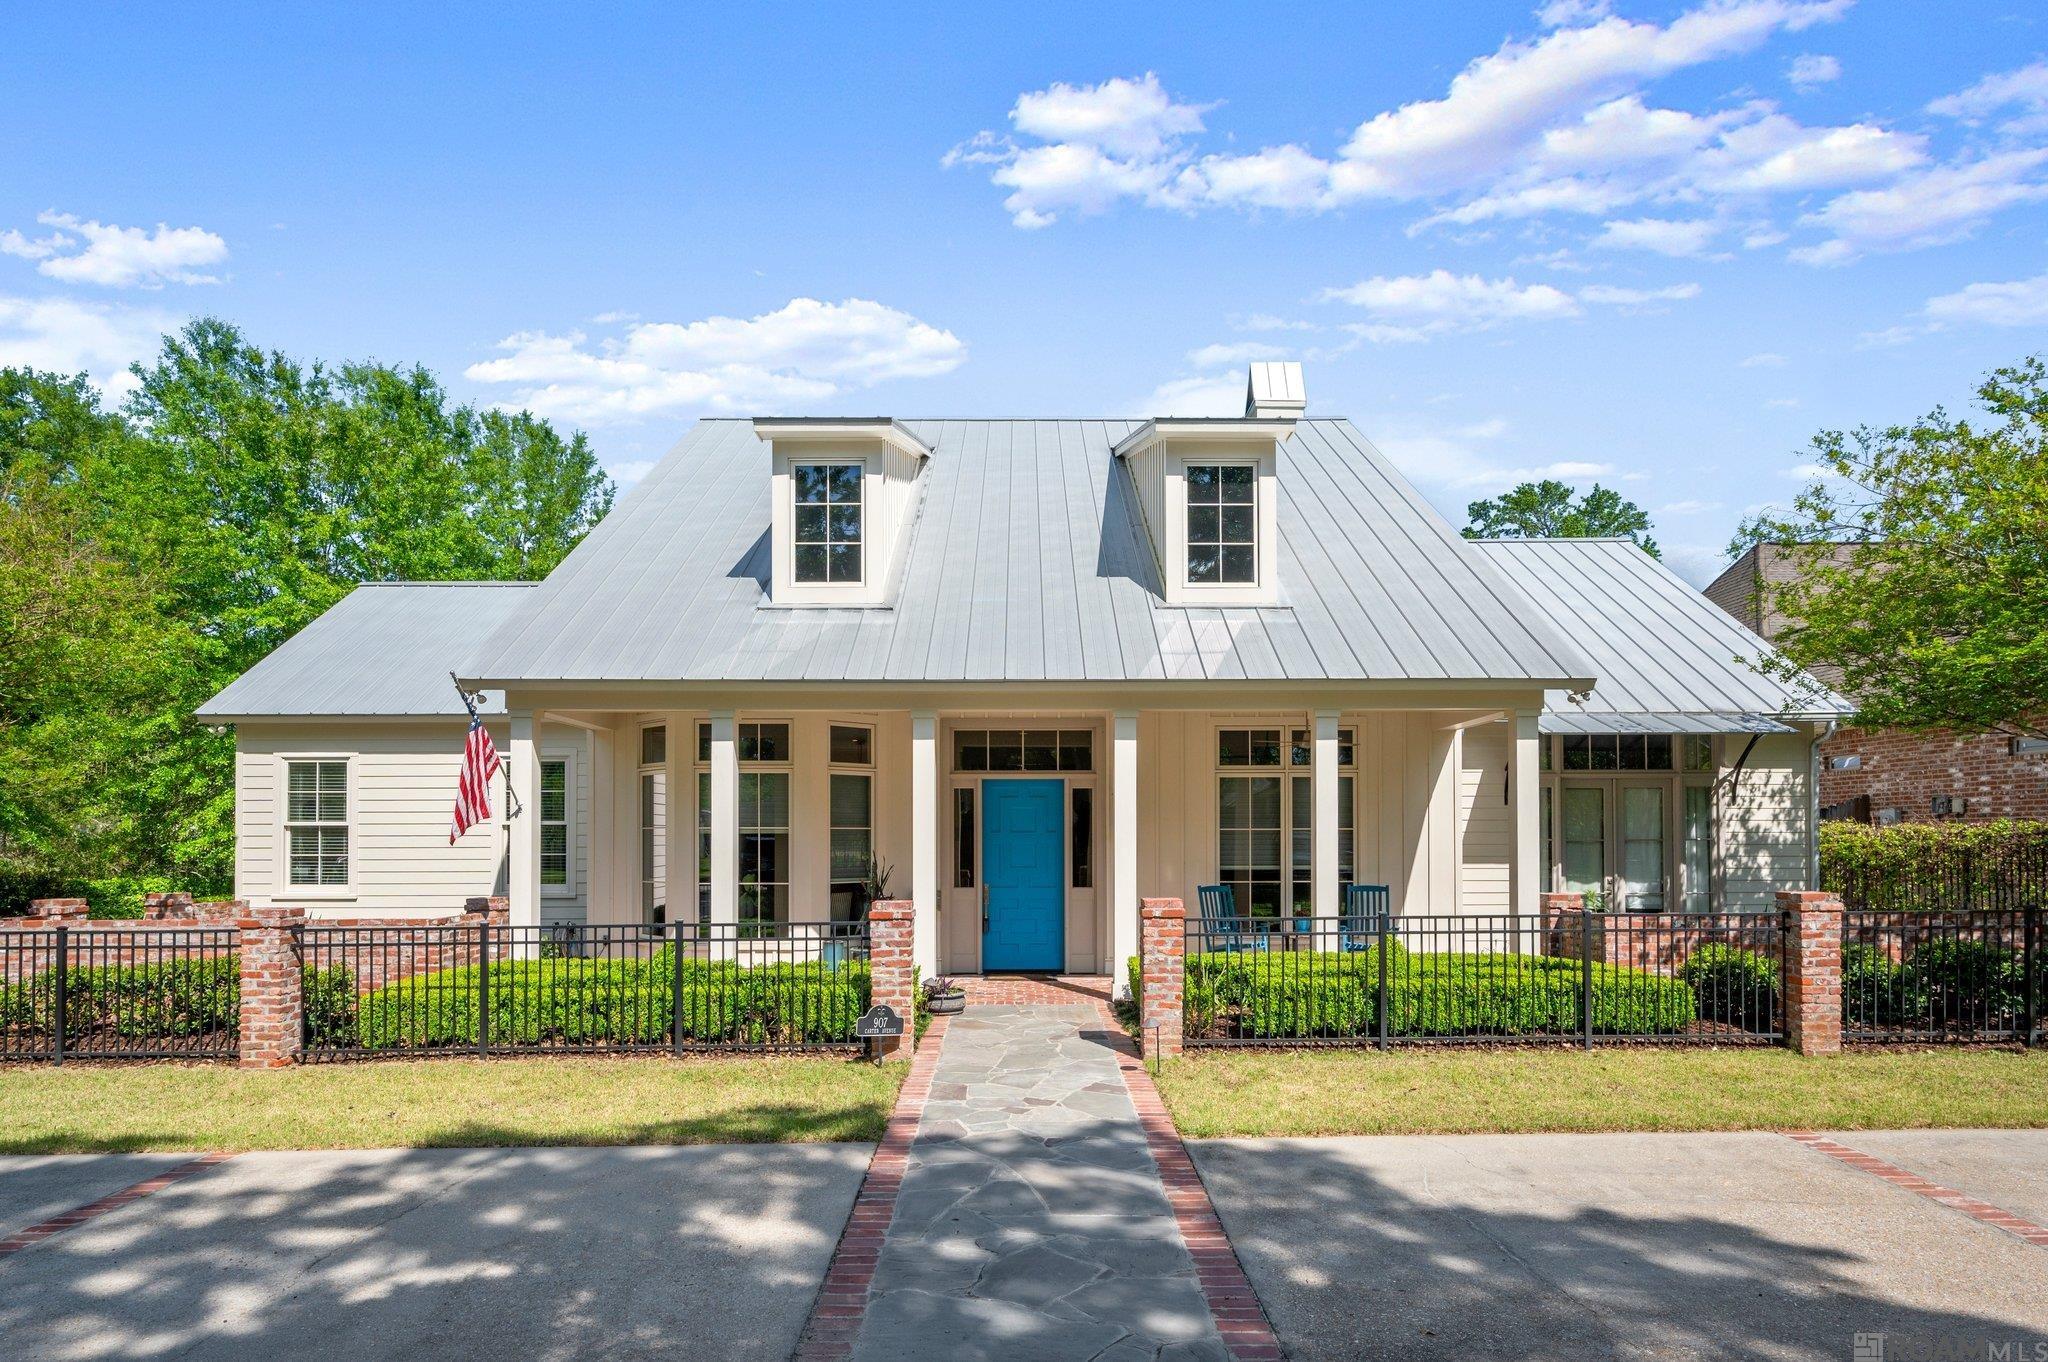
Active
$970,000
2
bds
|
3
ba
|
2,723
sqft
|
built
2017
907 Carter Ave, Baton Rouge, LA 70806
$-3,976
Cash flow
-21.4%
Cash-on-Cash Return
1.4%
Cap rate
0.2%
Rent to Value Ratio
Active
$325,400
bds
|
0
ba
|
4,000
sqft
|
built
1982
14121 Azalea Park Ave, Baton Rouge, LA 70816
$-1,083
Cash flow
-17.4%
Cash-on-Cash Return
2.3%
Cap rate
0.3%
Rent to Value Ratio
Active
$795,000
4
bds
|
5
ba
|
3,045
sqft
|
built
2023
2860 Pointe Marie Dr, Baton Rouge, LA 70820
$-429
Cash flow
-2.8%
Cash-on-Cash Return
5.6%
Cap rate
0.7%
Rent to Value Ratio

Active
$3,495,500
5
bds
|
6
ba
|
6,329
sqft
|
built
1994
17835 E Augusta Dr, Baton Rouge, LA 70810
$-13,060
Cash flow
-19.5%
Cash-on-Cash Return
1.8%
Cap rate
0.2%
Rent to Value Ratio
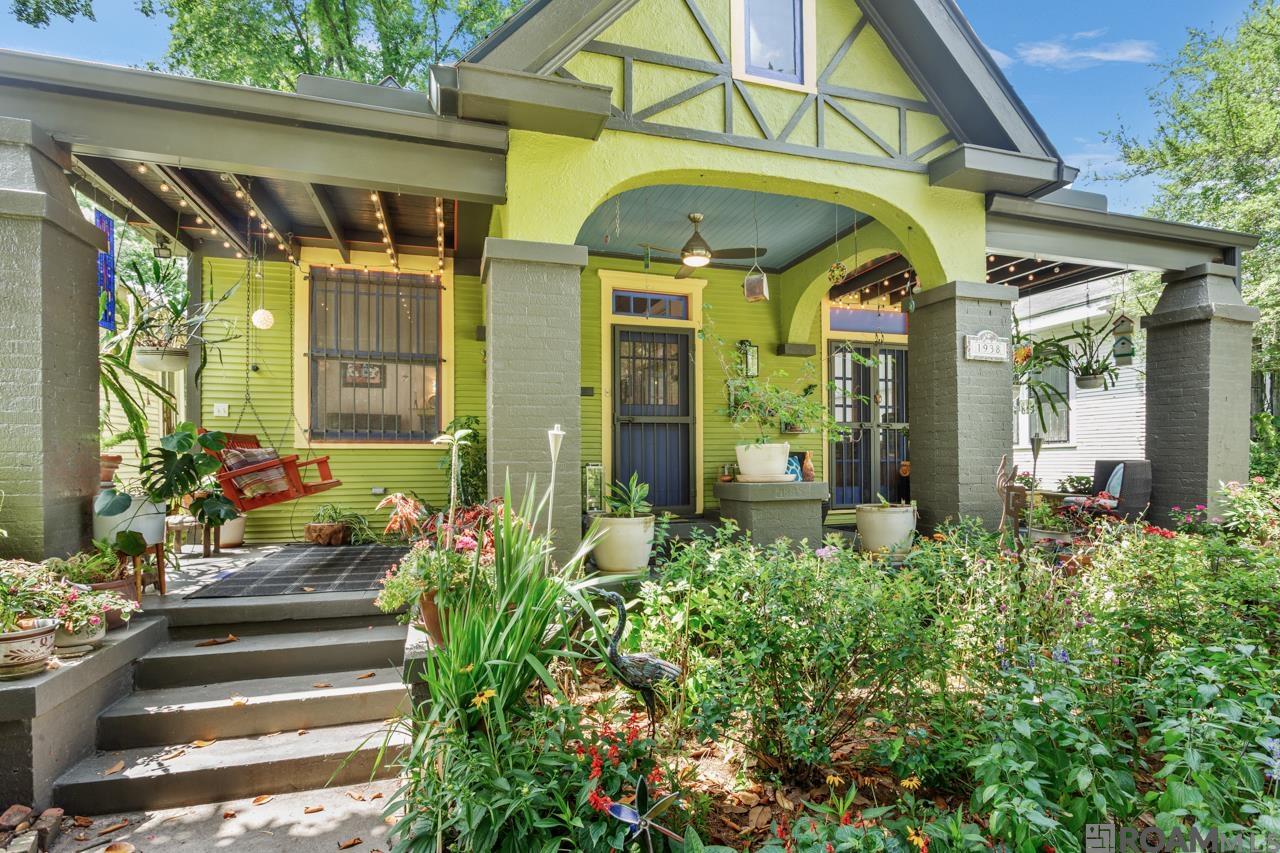
Active
$385,000
3
bds
|
2
ba
|
1,545
sqft
|
built
1949
1938 Wisteria St, Baton Rouge, LA 70806
$-774
Cash flow
-10.5%
Cash-on-Cash Return
3.9%
Cap rate
0.5%
Rent to Value Ratio
Active
$655,000
4
bds
|
4
ba
|
4,238
sqft
|
built
2001
17630 Creek Hollow Rd, Baton Rouge, LA 70817
$-749
Cash flow
-6.0%
Cash-on-Cash Return
4.9%
Cap rate
0.6%
Rent to Value Ratio
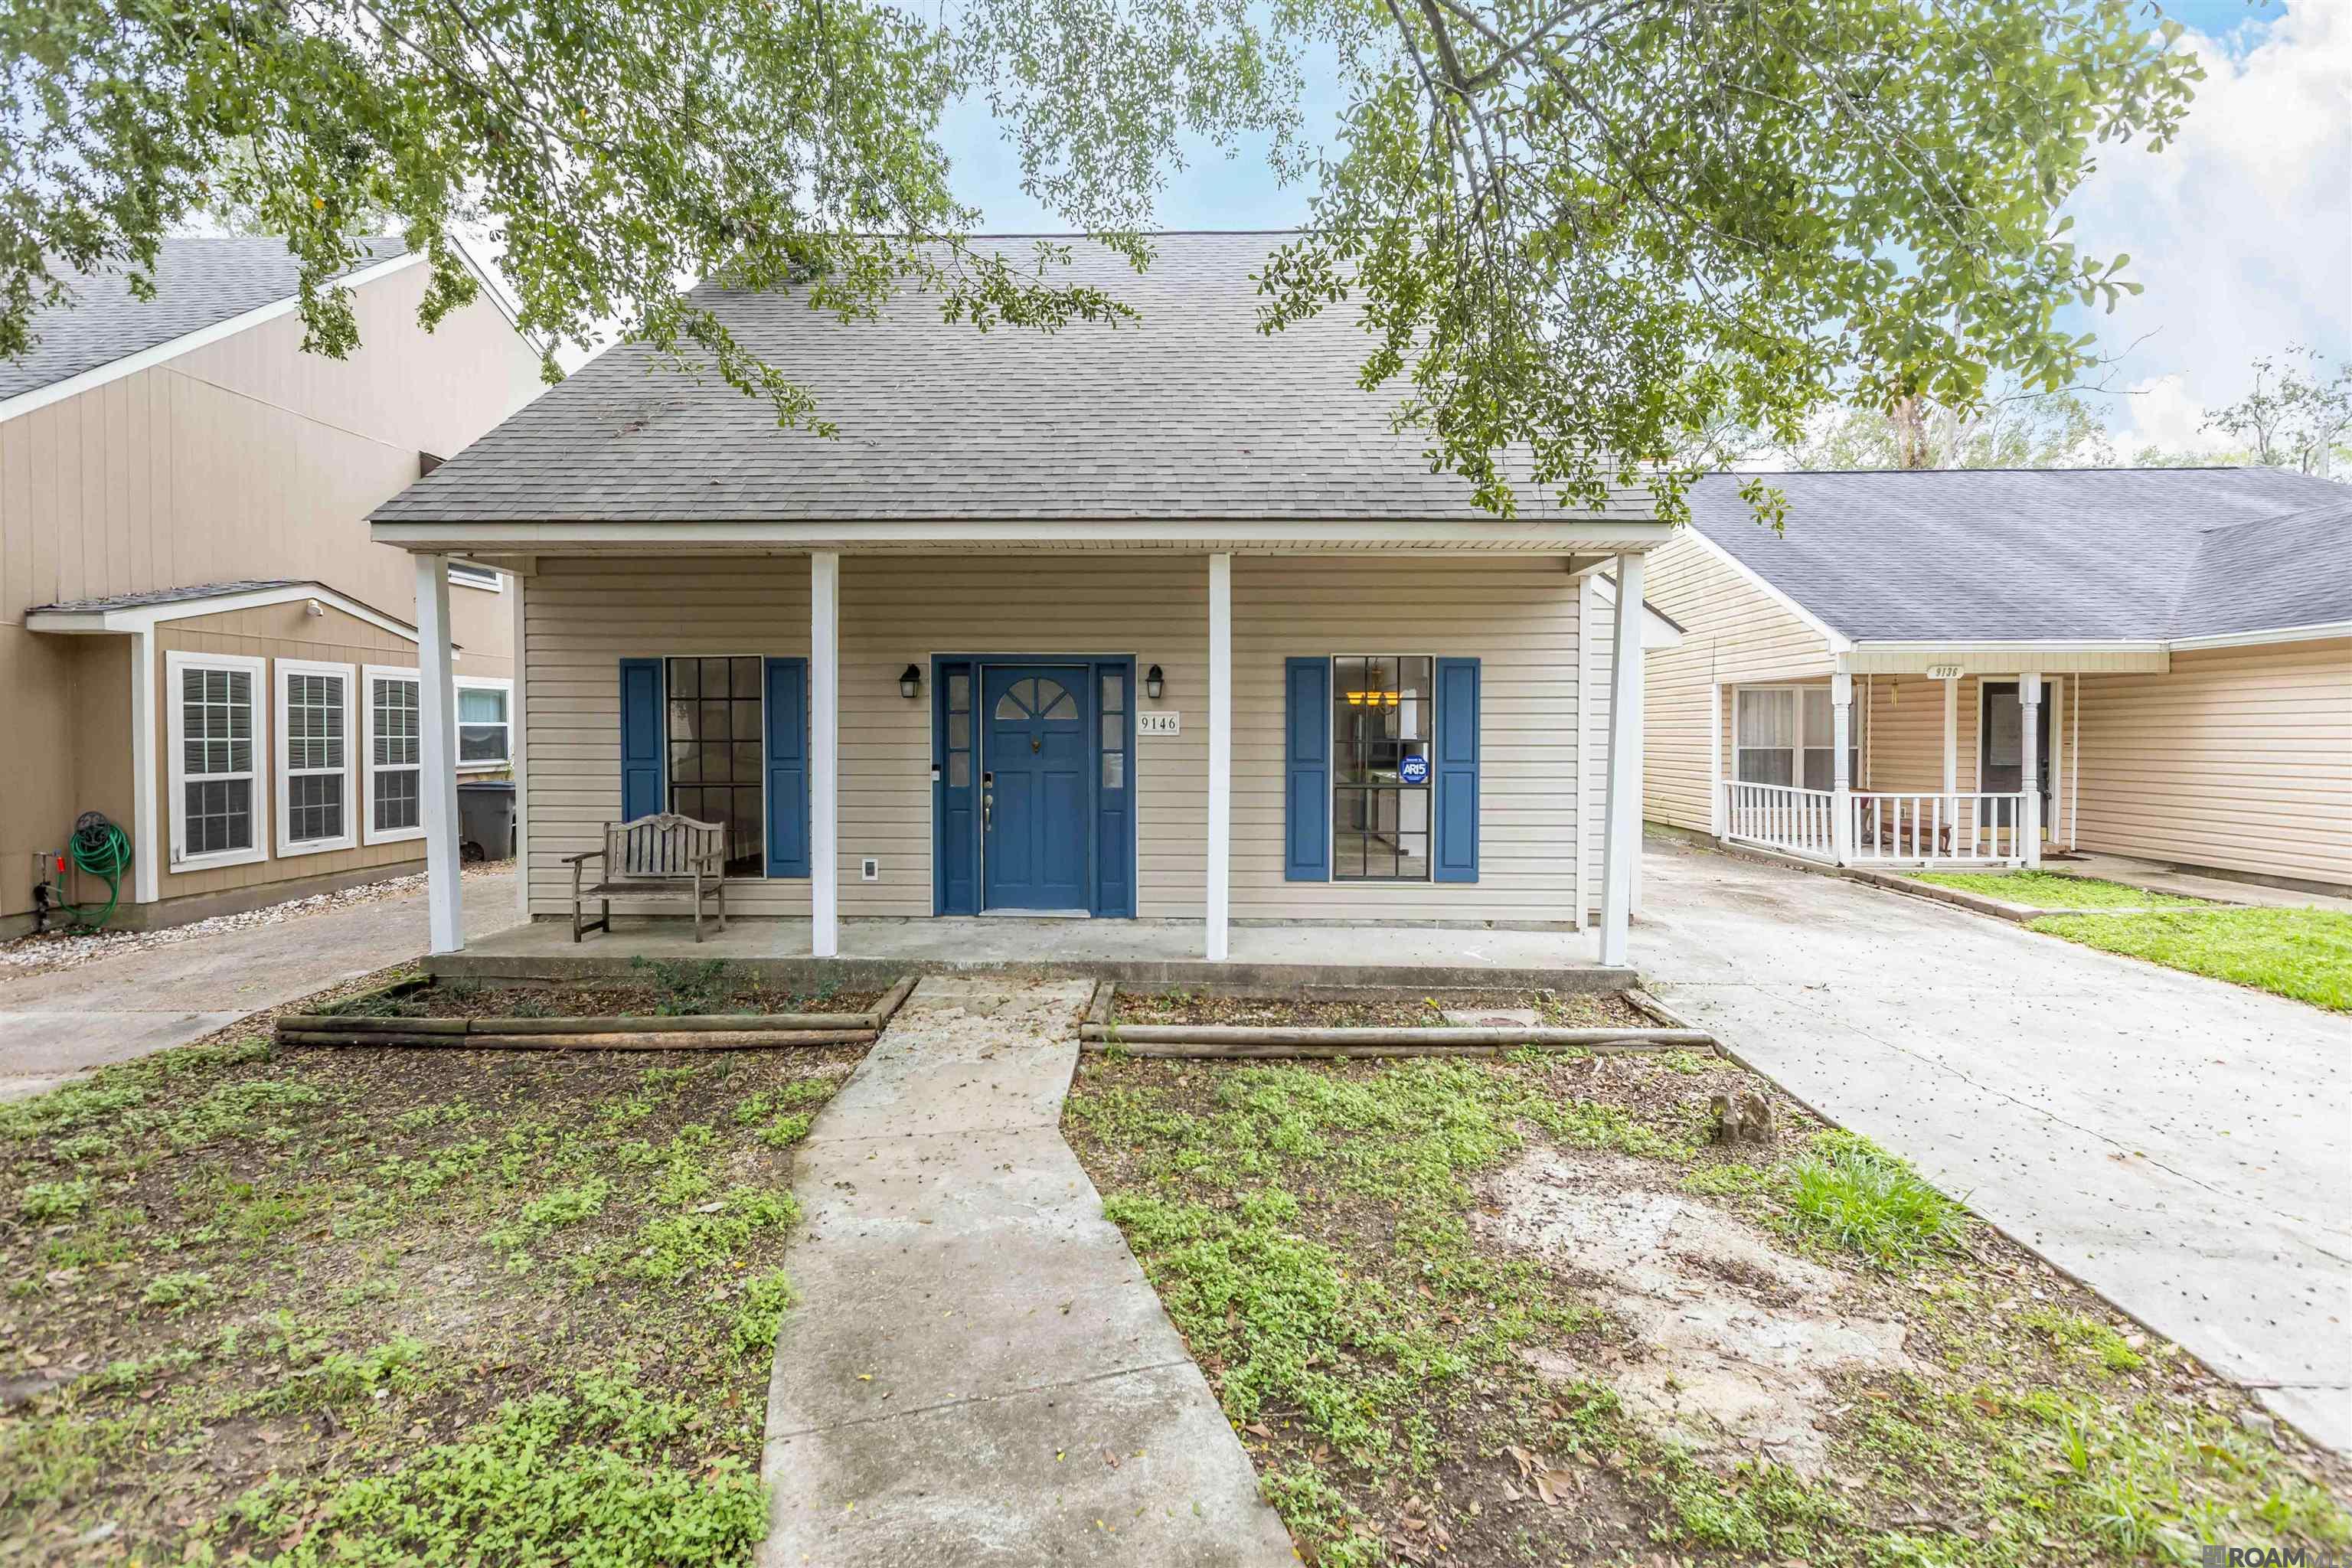
Active
$209,000
3
bds
|
2
ba
|
1,765
sqft
|
built
1987
9146 Fox Run Ave, Baton Rouge, LA 70808
$148
Cash flow
3.7%
Cash-on-Cash Return
7.1%
Cap rate
0.9%
Rent to Value Ratio
Active
$395,000
5
bds
|
5
ba
|
2,769
sqft
|
built
1970
633 Oak Hills Pkwy, Baton Rouge, LA 70810
$-154
Cash flow
-2.0%
Cash-on-Cash Return
5.8%
Cap rate
0.7%
Rent to Value Ratio
Active
$250,000
3
bds
|
2
ba
|
1,438
sqft
|
built
2006
8942 Westlake Ave, Baton Rouge, LA 70810
$-40
Cash flow
-0.8%
Cash-on-Cash Return
6.1%
Cap rate
0.8%
Rent to Value Ratio
Active
$215,000
3
bds
|
2
ba
|
1,468
sqft
|
built
1970
3584 Courtland Dr, Baton Rouge, LA 70814
$-22
Cash flow
-0.5%
Cash-on-Cash Return
6.2%
Cap rate
0.7%
Rent to Value Ratio
Active
$145,000
3
bds
|
2
ba
|
1,000
sqft
|
built
1972
4778 Broadway St, Baton Rouge, LA 70805
$-138
Cash flow
-5.0%
Cash-on-Cash Return
5.1%
Cap rate
0.6%
Rent to Value Ratio
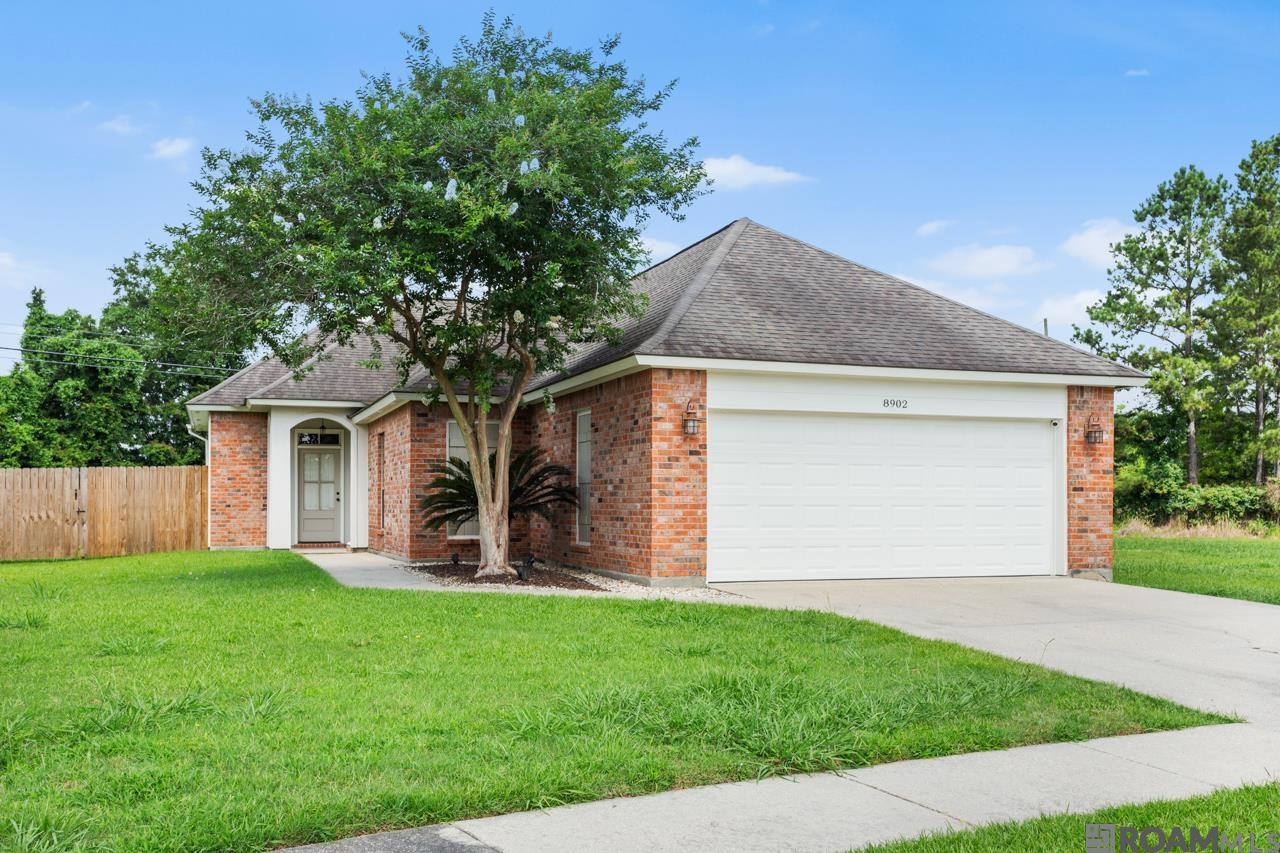
Active
$254,400
3
bds
|
2
ba
|
1,444
sqft
|
built
2006
8902 Westlake Ave, Baton Rouge, LA 70810
$-173
Cash flow
-3.5%
Cash-on-Cash Return
5.5%
Cap rate
0.7%
Rent to Value Ratio
Active
$349,000
3
bds
|
2
ba
|
1,783
sqft
|
built
2015
8365 Seville Ct, Baton Rouge, LA 70820
$-377
Cash flow
-5.6%
Cash-on-Cash Return
5.0%
Cap rate
0.6%
Rent to Value Ratio
Active
$205,000
4
bds
|
2
ba
|
1,621
sqft
|
built
1990
11994 Old Hammond Hwy, Baton Rouge, LA 70816
$30
Cash flow
0.8%
Cash-on-Cash Return
6.5%
Cap rate
0.8%
Rent to Value Ratio
Active
$549,000
4
bds
|
3
ba
|
3,094
sqft
|
built
1995
9230 Blueridge Ave, Baton Rouge, LA 70809
$-1,219
Cash flow
-11.6%
Cash-on-Cash Return
3.6%
Cap rate
0.4%
Rent to Value Ratio
Active
$60,000
2
bds
|
1
ba
|
1,234
sqft
|
built
1970
5089 Sycamore St, Baton Rouge, LA 70805
$828
Cash flow
16.1%
Cash-on-Cash Return
16.6%
Cap rate
2.0%
Rent to Value Ratio
Active
$57,500
2
bds
|
1
ba
|
1,080
sqft
|
built
1950
314 S 18th St, Baton Rouge, LA 70802
$690
Cash flow
14.0%
Cash-on-Cash Return
14.4%
Cap rate
1.7%
Rent to Value Ratio
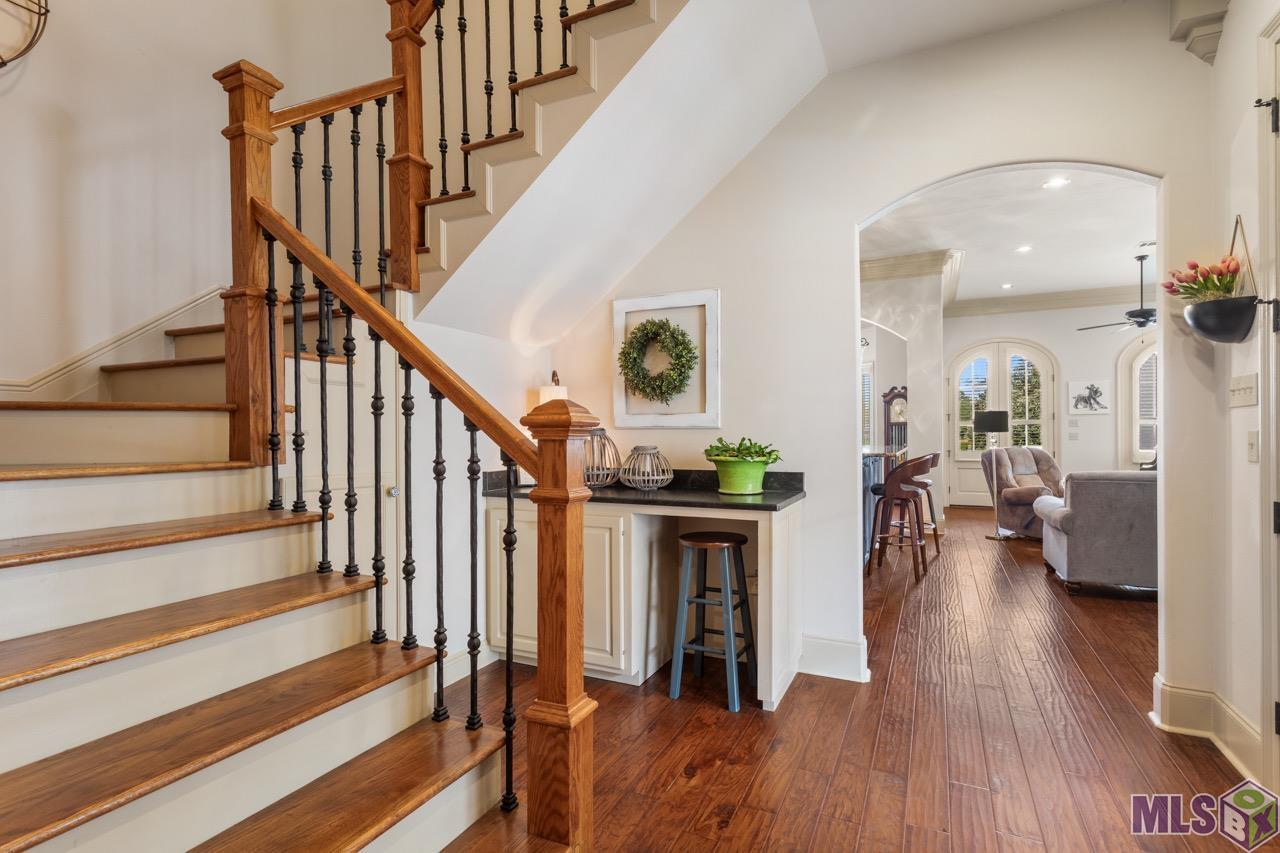
Pending
$80,000
3
bds
|
2
ba
|
1,666
sqft
|
built
1969
1645 Chestnut St, Baton Rouge, LA 70802
$340
Cash flow
22.2%
Cash-on-Cash Return
11.4%
Cap rate
1.4%
Rent to Value Ratio
Active
$110,000
3
bds
|
1
ba
|
1,001
sqft
|
built
1950
5021 Hammond St, Baton Rouge, LA 70805
$321
Cash flow
15.2%
Cash-on-Cash Return
9.8%
Cap rate
1.2%
Rent to Value Ratio
Active
$129,000
3
bds
|
1
ba
|
1,052
sqft
|
built
1970
2834 Century Ave, Baton Rouge, LA 70807
$290
Cash flow
11.7%
Cash-on-Cash Return
9.0%
Cap rate
1.1%
Rent to Value Ratio
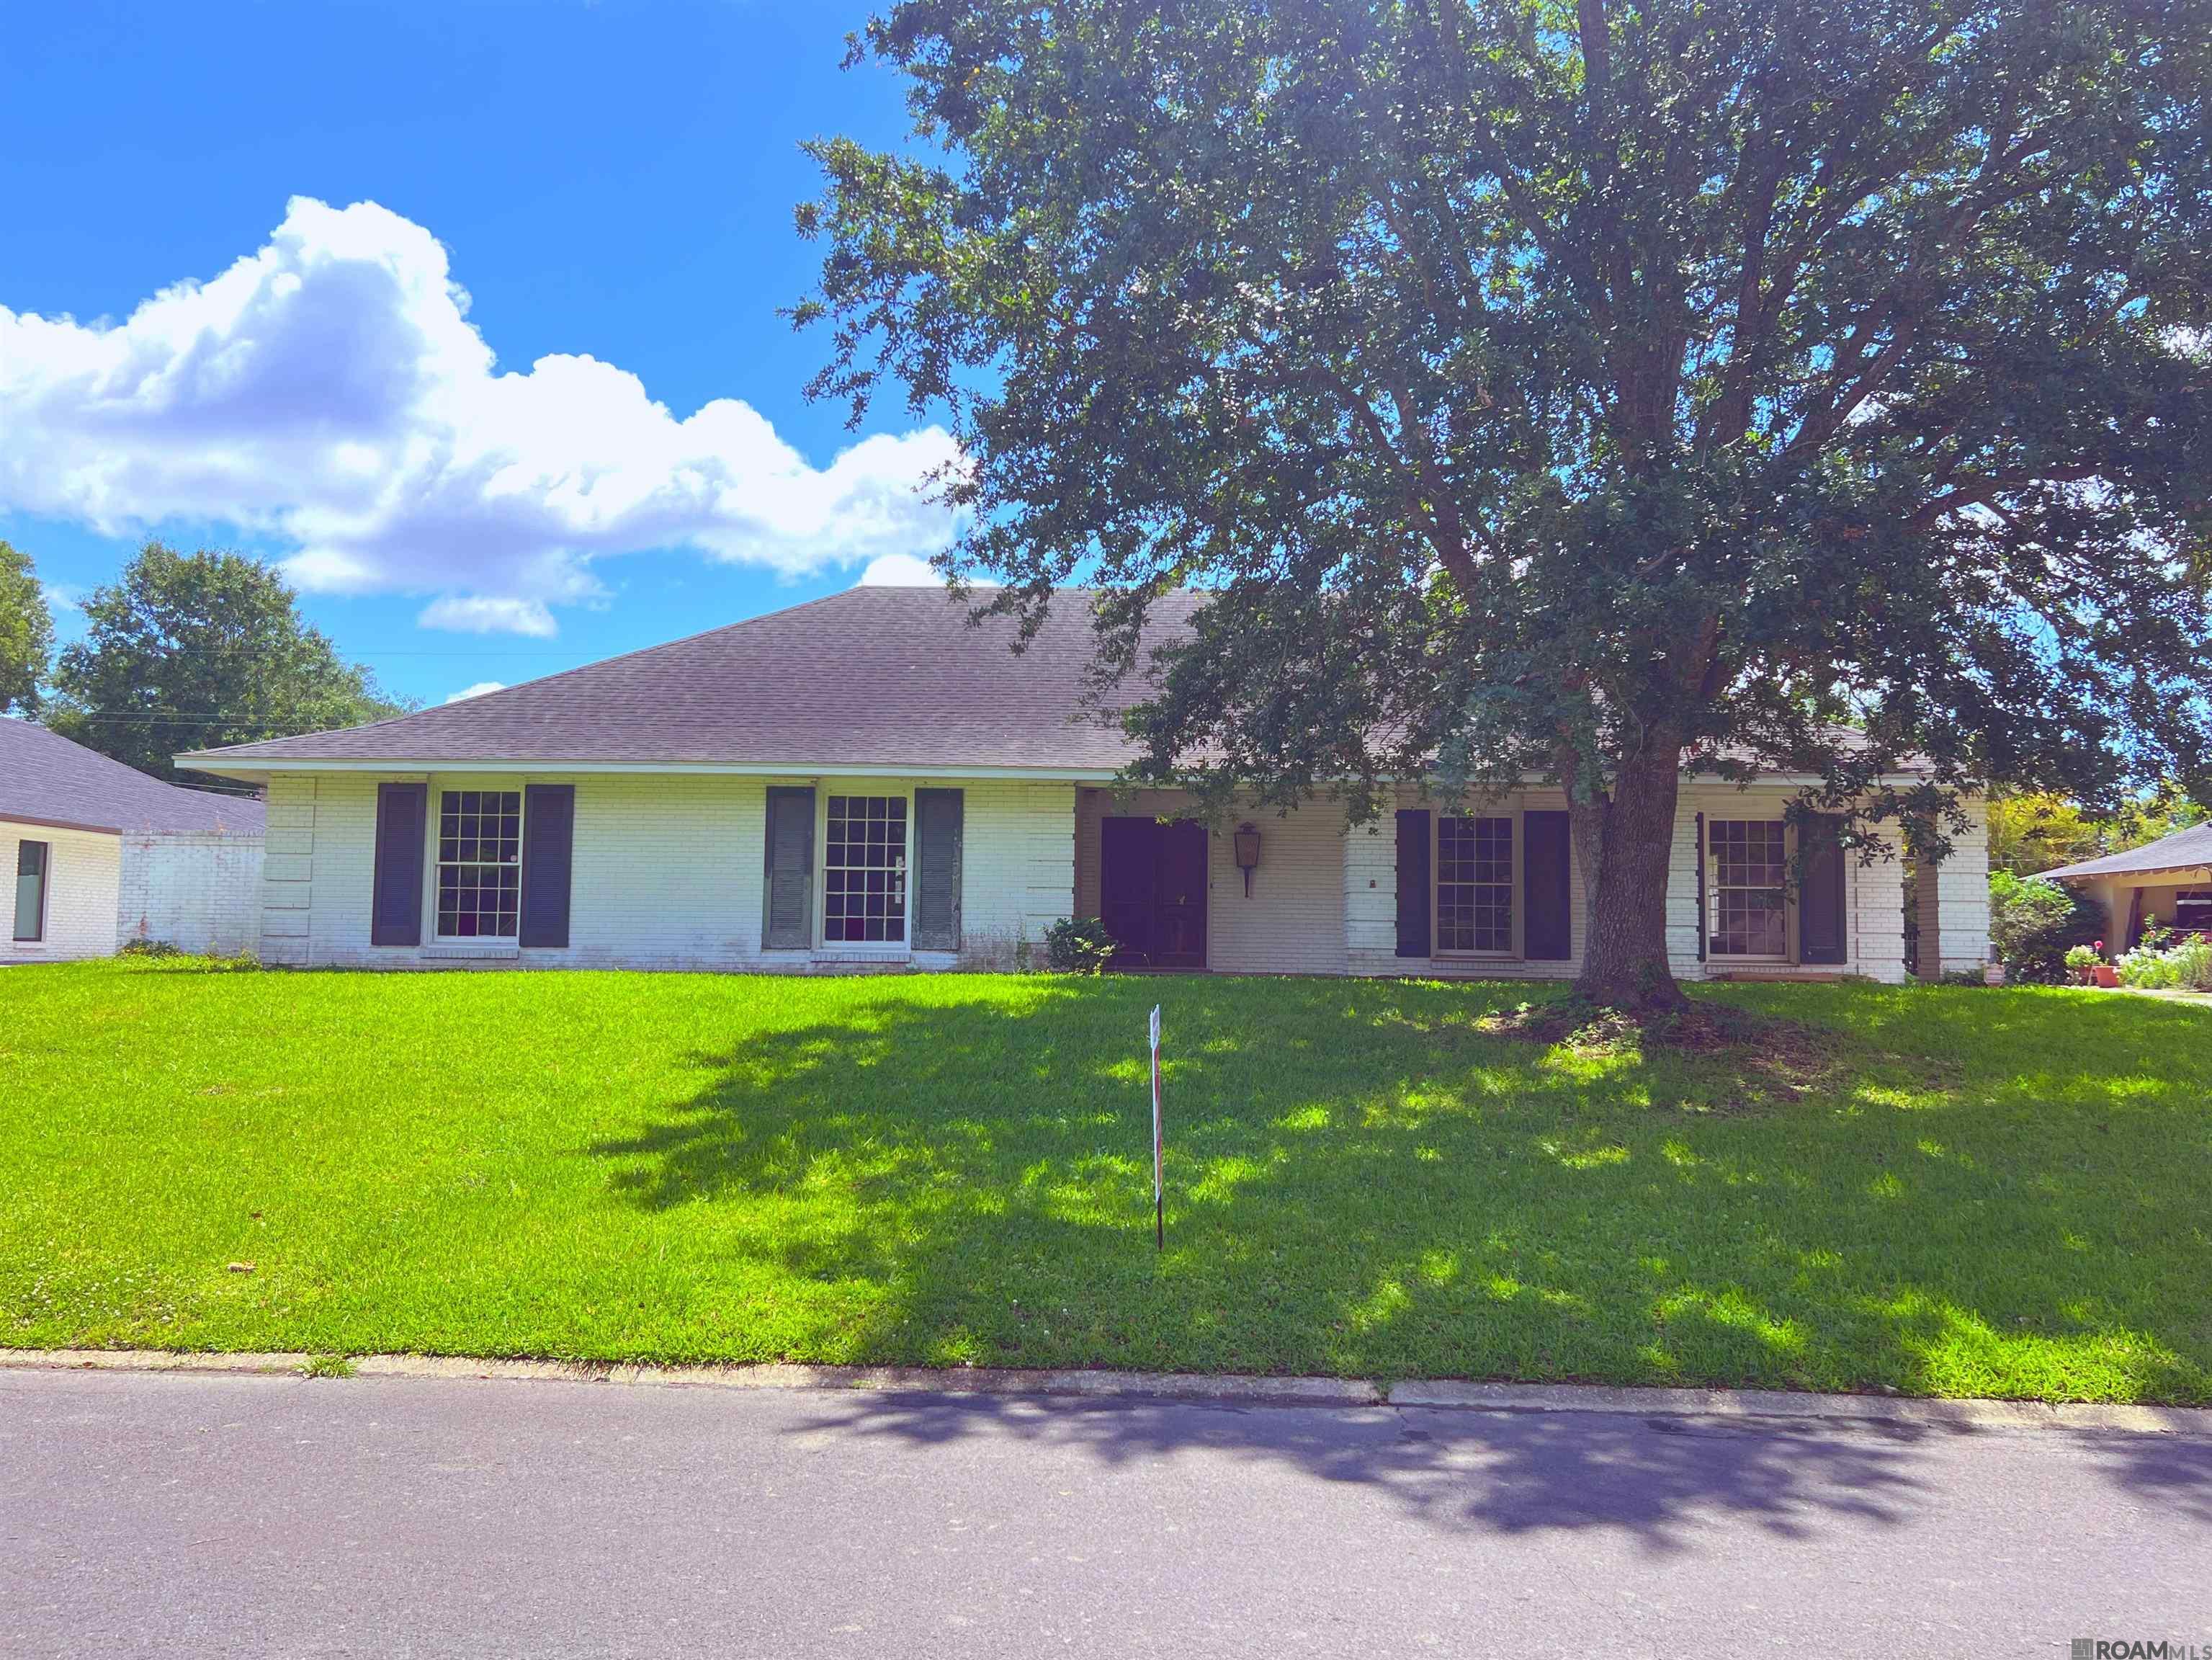
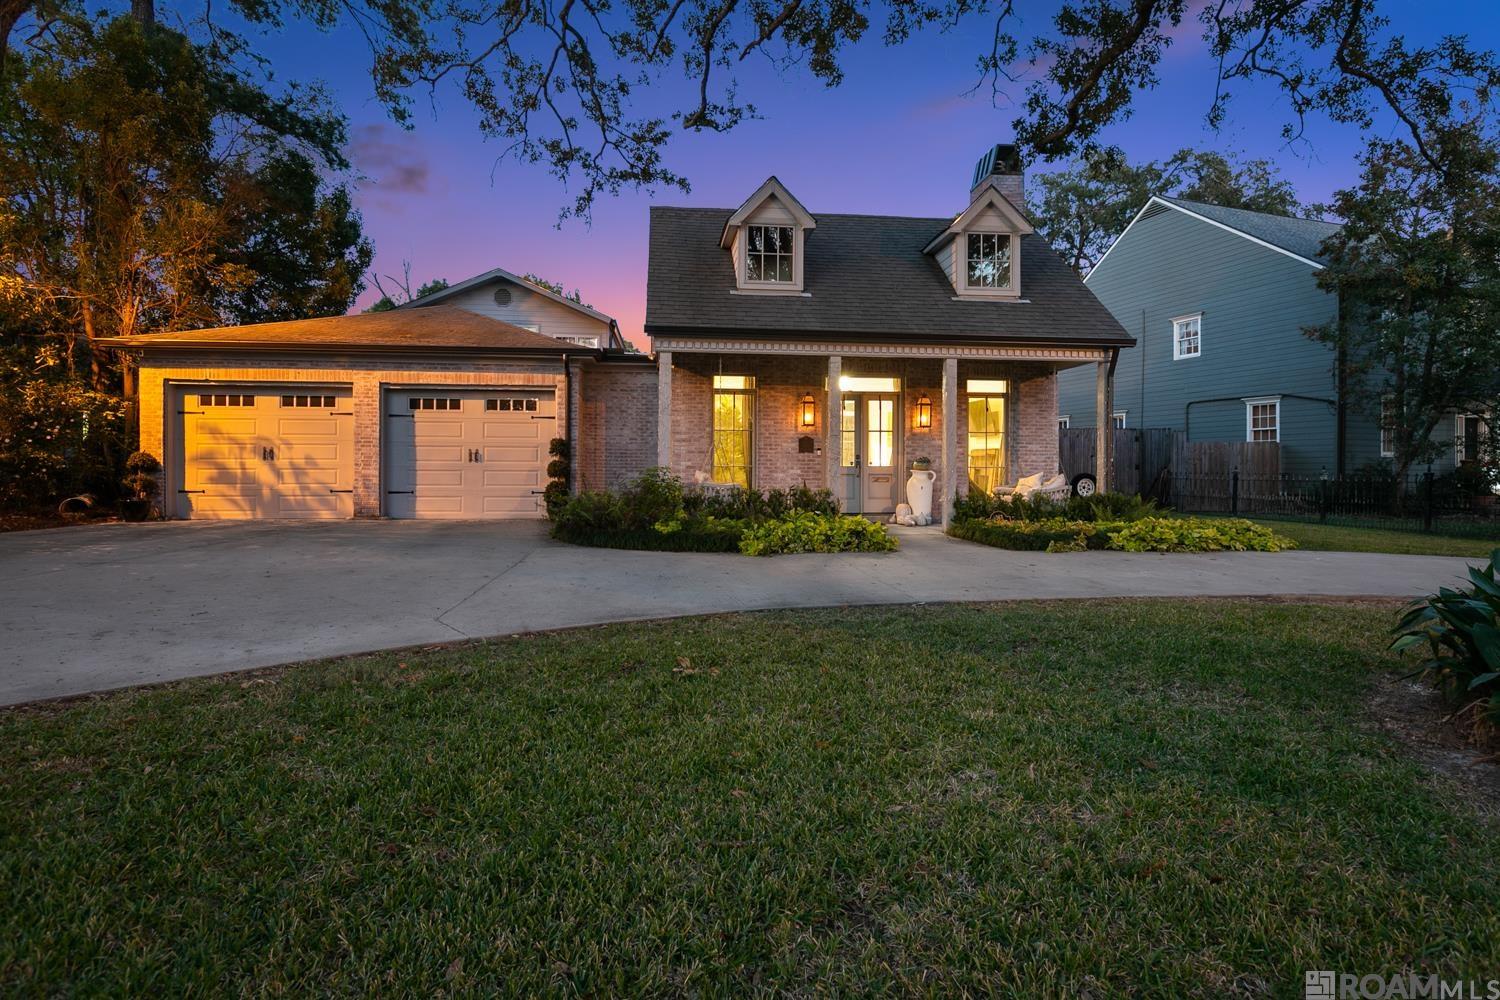
Pending
$490,000
4
bds
|
3
ba
|
3,929
sqft
|
built
1964
1142 Belvedere Dr, Baton Rouge, LA 70808
$-1,186
Cash flow
-12.6%
Cash-on-Cash Return
3.4%
Cap rate
0.4%
Rent to Value Ratio