Baton Rouge, LA Investment Properties for Sale
Browse homes for sale and investment properties in Baton Rouge, LA. Refine your search by price, property type, or more.
Best cash flowing properties in Baton Rouge, LA

Active
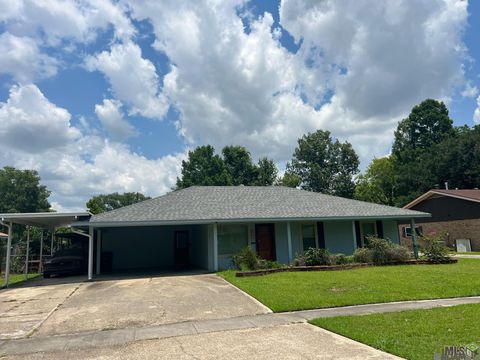
$70,000
3
bds
|
1
ba
|
802
sqft
|
built
1980
5667 Denova St, Baton Rouge, LA 70812
$759
Cash flow
12.6%
Cash-on-Cash Return
13.0%
Cap rate
1.6%
Rent to Value Ratio

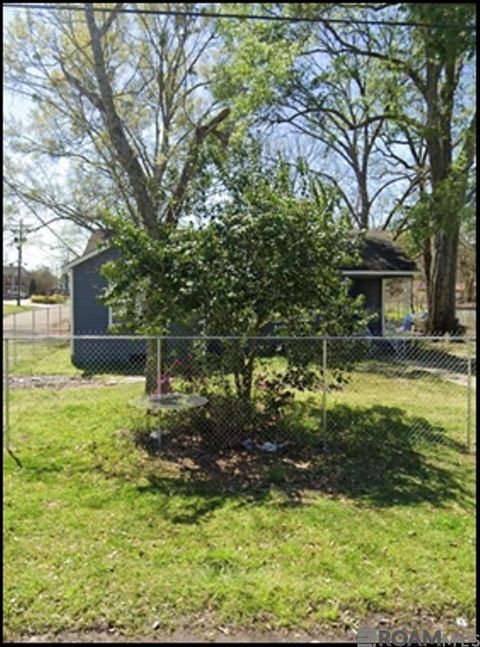
Active
$45,000
2
bds
|
1
ba
|
781
sqft
|
built
1975
3339 Wenonah St, Baton Rouge, LA 70805
$552
Cash flow
14.3%
Cash-on-Cash Return
14.7%
Cap rate
1.8%
Rent to Value Ratio
975 out of 1,258 properties for sale in Baton Rouge, LA
Limited Results Shown
Create a free account, or log in to reveal all property listings and enjoy the complete experience.

Active
$1,111,111
4
bds
|
4
ba
|
3,705
sqft
|
built
1985
213 W Woodgate Ct, Baton Rouge, LA 70808
$-3,422
Cash flow
-16.1%
Cash-on-Cash Return
2.0%
Cap rate
0.2%
Rent to Value Ratio

Active
$569,900
4
bds
|
3
ba
|
3,818
sqft
|
built
1952
3343 Hyacinth Ave, Baton Rouge, LA 70808
$-221
Cash flow
-2.0%
Cash-on-Cash Return
5.2%
Cap rate
0.6%
Rent to Value Ratio

Active
$1,285,000
4
bds
|
4
ba
|
4,723
sqft
|
built
1979
8753 W Fairway Dr, Baton Rouge, LA 70809
$-2,286
Cash flow
-9.3%
Cash-on-Cash Return
3.5%
Cap rate
0.4%
Rent to Value Ratio

Pending
$440,000
4
bds
|
3
ba
|
2,488
sqft
|
built
1978
7726 Lew Hoad Ave, Baton Rouge, LA 70810
$-154
Cash flow
-1.8%
Cash-on-Cash Return
5.3%
Cap rate
0.6%
Rent to Value Ratio

Active
$950,000
5
bds
|
5
ba
|
4,038
sqft
|
built
2018
18219 Woodland Cove Dr, Baton Rouge, LA 70817
$-1,157
Cash flow
-6.4%
Cash-on-Cash Return
4.2%
Cap rate
0.5%
Rent to Value Ratio
Active
$45,000
2
bds
|
1
ba
|
781
sqft
|
built
1975
3339 Wenonah St, Baton Rouge, LA 70805
$552
Cash flow
14.3%
Cash-on-Cash Return
14.7%
Cap rate
1.8%
Rent to Value Ratio
Active
$70,000
3
bds
|
1
ba
|
802
sqft
|
built
1980
5667 Denova St, Baton Rouge, LA 70812
$759
Cash flow
12.6%
Cash-on-Cash Return
13.0%
Cap rate
1.6%
Rent to Value Ratio

Active
$190,000
5
bds
|
2
ba
|
2,085
sqft
|
built
1977
6012 Frederick Dr, Baton Rouge, LA 70817
$412
Cash flow
11.3%
Cash-on-Cash Return
8.3%
Cap rate
1.0%
Rent to Value Ratio

Active
$75,000
3
bds
|
2
ba
|
1,790
sqft
|
built
1949
2029 Gracie St, Baton Rouge, LA 70802
$404
Cash flow
28.1%
Cash-on-Cash Return
12.1%
Cap rate
1.5%
Rent to Value Ratio
Active
$194,900
3
bds
|
2
ba
|
1,157
sqft
|
built
1986
17150 Lake Park Ave, Baton Rouge, LA 70816
$100
Cash flow
2.7%
Cash-on-Cash Return
6.3%
Cap rate
0.8%
Rent to Value Ratio
Active
$249,999
4
bds
|
2
ba
|
1,906
sqft
|
built
1977
1837 Stonewood Dr, Baton Rouge, LA 70816
$59
Cash flow
1.2%
Cash-on-Cash Return
6.0%
Cap rate
0.7%
Rent to Value Ratio

Active
$365,000
6
bds
|
6
ba
|
2,900
sqft
|
built
1970
10925 Tams Dr, Baton Rouge, LA 70815
$-2
Cash flow
0.0%
Cash-on-Cash Return
5.7%
Cap rate
0.7%
Rent to Value Ratio

Active
$240,000
3
bds
|
2
ba
|
1,938
sqft
|
built
1985
10525 Carmel Dr, Baton Rouge, LA 70818
$106
Cash flow
2.3%
Cash-on-Cash Return
6.2%
Cap rate
0.8%
Rent to Value Ratio
Active
$369,500
5
bds
|
3
ba
|
2,950
sqft
|
built
1974
1233 Ashbourne Dr, Baton Rouge, LA 70815
$45
Cash flow
0.6%
Cash-on-Cash Return
5.8%
Cap rate
0.7%
Rent to Value Ratio

Active
$199,900
3
bds
|
2
ba
|
1,645
sqft
|
built
1984
12511 Coursey Blvd, Baton Rouge, LA 70816
$86
Cash flow
2.2%
Cash-on-Cash Return
6.2%
Cap rate
0.9%
Rent to Value Ratio

Active
$264,900
3
bds
|
2
ba
|
1,468
sqft
|
built
1983
931 E Tom Stokes Ct, Baton Rouge, LA 70810
$-81
Cash flow
-1.6%
Cash-on-Cash Return
5.3%
Cap rate
0.6%
Rent to Value Ratio

Active
$199,900
3
bds
|
2
ba
|
1,701
sqft
|
built
1955
234 Cloud Dr, Baton Rouge, LA 70806
$158
Cash flow
4.1%
Cash-on-Cash Return
6.6%
Cap rate
0.8%
Rent to Value Ratio

Active
$342,000
3
bds
|
4
ba
|
2,870
sqft
|
built
1978
9534 Shoe Creek Dr, Baton Rouge, LA 70818
$312
Cash flow
4.8%
Cash-on-Cash Return
6.8%
Cap rate
0.8%
Rent to Value Ratio

Active
$169,900
4
bds
|
2
ba
|
1,407
sqft
|
built
1980
4745 Lorraine St, Baton Rouge, LA 70805
$24
Cash flow
0.7%
Cash-on-Cash Return
5.8%
Cap rate
0.7%
Rent to Value Ratio

Active
$469,900
4
bds
|
3
ba
|
2,823
sqft
|
built
1973
4480 Downing Dr, Baton Rouge, LA 70809
$260
Cash flow
2.9%
Cash-on-Cash Return
6.3%
Cap rate
0.8%
Rent to Value Ratio

Active
$249,000
4
bds
|
2
ba
|
2,627
sqft
|
built
1974
9492 Wesson St, Baton Rouge, LA 70809
$202
Cash flow
4.2%
Cash-on-Cash Return
6.7%
Cap rate
0.8%
Rent to Value Ratio

Active
$135,000
2
bds
|
3
ba
|
1,741
sqft
|
built
1982
2455 Aubin Ln, Baton Rouge, LA 70816
$112
Cash flow
4.3%
Cash-on-Cash Return
6.7%
Cap rate
1.0%
Rent to Value Ratio

Active
$399,999
3
bds
|
3
ba
|
2,662
sqft
|
built
1995
1072 Kimbro Dr, Baton Rouge, LA 70808
$246
Cash flow
3.2%
Cash-on-Cash Return
6.4%
Cap rate
0.8%
Rent to Value Ratio

Active
$384,000
4
bds
|
3
ba
|
2,449
sqft
|
built
1980
6433 Lawnridge Dr, Baton Rouge, LA 70818
$180
Cash flow
2.4%
Cash-on-Cash Return
6.2%
Cap rate
0.8%
Rent to Value Ratio

Active
$228,000
3
bds
|
2
ba
|
1,741
sqft
|
built
1969
3923 Aletha Dr, Baton Rouge, LA 70814
$439
Cash flow
10.0%
Cash-on-Cash Return
8.0%
Cap rate
1.0%
Rent to Value Ratio
Active
$143,000
3
bds
|
1
ba
|
1,412
sqft
|
built
1954
2635 79th Ave, Baton Rouge, LA 70807
$427
Cash flow
15.6%
Cash-on-Cash Return
9.3%
Cap rate
1.1%
Rent to Value Ratio

Active
$144,800
3
bds
|
2
ba
|
1,570
sqft
|
built
1970
2731 Michelli Dr, Baton Rouge, LA 70805
$419
Cash flow
15.1%
Cash-on-Cash Return
9.1%
Cap rate
1.1%
Rent to Value Ratio
Active
$244,900
3
bds
|
2
ba
|
1,611
sqft
|
built
1975
9741 Buttercup Dr, Baton Rouge, LA 70809
$83
Cash flow
1.8%
Cash-on-Cash Return
6.1%
Cap rate
0.7%
Rent to Value Ratio
Active
$649,900
3
bds
|
3
ba
|
2,470
sqft
|
built
2020
3129 Veranda Green Ave, Baton Rouge, LA 70810
$-740
Cash flow
-5.9%
Cash-on-Cash Return
4.3%
Cap rate
0.6%
Rent to Value Ratio
Active
$350,000
4
bds
|
2
ba
|
1,977
sqft
|
built
1978
17012 Sharpsburg Ave, Baton Rouge, LA 70817
$-279
Cash flow
-4.2%
Cash-on-Cash Return
4.7%
Cap rate
0.6%
Rent to Value Ratio

Active
$169,900
3
bds
|
2
ba
|
1,248
sqft
|
built
1959
11575 Biscayne Dr, Baton Rouge, LA 70814
$93
Cash flow
2.9%
Cash-on-Cash Return
6.3%
Cap rate
0.8%
Rent to Value Ratio
Active
$95,000
3
bds
|
1
ba
|
1,064
sqft
|
built
1970
5496 Frey St, Baton Rouge, LA 70805
$240
Cash flow
13.2%
Cash-on-Cash Return
8.7%
Cap rate
1.1%
Rent to Value Ratio
Active
$300,000
3
bds
|
2
ba
|
2,158
sqft
|
built
1975
897 Baird Dr, Baton Rouge, LA 70808
$95
Cash flow
1.7%
Cash-on-Cash Return
6.1%
Cap rate
0.7%
Rent to Value Ratio

Active
$537,400
4
bds
|
3
ba
|
2,260
sqft
|
built
2021
14238 Haile Way, Baton Rouge, LA 70817
$-475
Cash flow
-4.6%
Cash-on-Cash Return
4.6%
Cap rate
0.6%
Rent to Value Ratio
Active
$735,000
3
bds
|
3
ba
|
2,685
sqft
|
built
1999
1650 Cameron Ave, Baton Rouge, LA 70806
$-787
Cash flow
-5.6%
Cash-on-Cash Return
4.4%
Cap rate
0.5%
Rent to Value Ratio

Active
$895,000
4
bds
|
4
ba
|
3,376
sqft
|
built
2021
3257 Pointe Marie Dr, Baton Rouge, LA 70820
$-816
Cash flow
-4.8%
Cash-on-Cash Return
4.6%
Cap rate
0.6%
Rent to Value Ratio
Active
$585,000
3
bds
|
3
ba
|
1,956
sqft
|
built
2022
5321 N Pointer Ct, Baton Rouge, LA 70808
$-544
Cash flow
-4.9%
Cash-on-Cash Return
4.6%
Cap rate
0.6%
Rent to Value Ratio

Active
$1,075,000
4
bds
|
4
ba
|
3,809
sqft
|
built
1991
17627 Masters Pointe Ct, Baton Rouge, LA 70810
$-1,835
Cash flow
-8.9%
Cash-on-Cash Return
3.6%
Cap rate
0.5%
Rent to Value Ratio

Active
$1,369,500
4
bds
|
6
ba
|
5,301
sqft
|
built
2007
1923 Old Plantation Ln, Baton Rouge, LA 70806
$-3,376
Cash flow
-12.9%
Cash-on-Cash Return
2.7%
Cap rate
0.3%
Rent to Value Ratio

Active
$749,900
4
bds
|
4
ba
|
3,424
sqft
|
built
1960
6565 Sevenoaks Ave, Baton Rouge, LA 70806
$-1,824
Cash flow
-12.7%
Cash-on-Cash Return
2.8%
Cap rate
0.3%
Rent to Value Ratio