Baton Rouge, LA Investment Properties for Sale
Browse homes for sale and investment properties in Baton Rouge, LA. Refine your search by price, property type, or more.
Best cash flowing properties in Baton Rouge, LA
Active
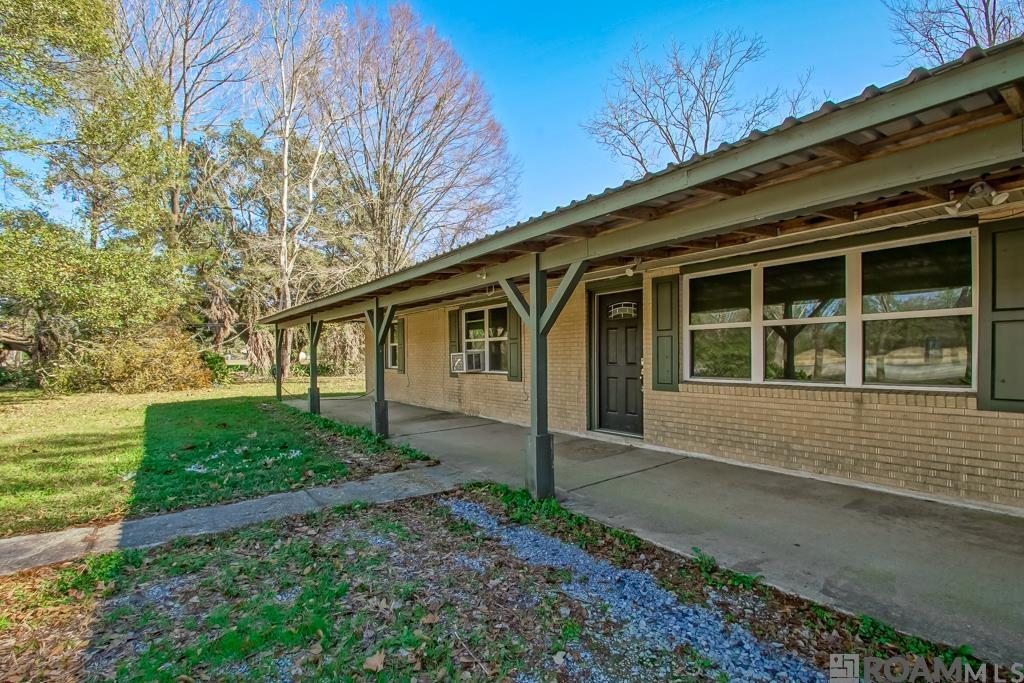
$185,000
3
bds
|
2
ba
|
1,860
sqft
|
built
1975
9786 Hooper Rd, Baton Rouge, LA 70818
$367
Cash flow
10.4%
Cash-on-Cash Return
8.1%
Cap rate
1.0%
Rent to Value Ratio
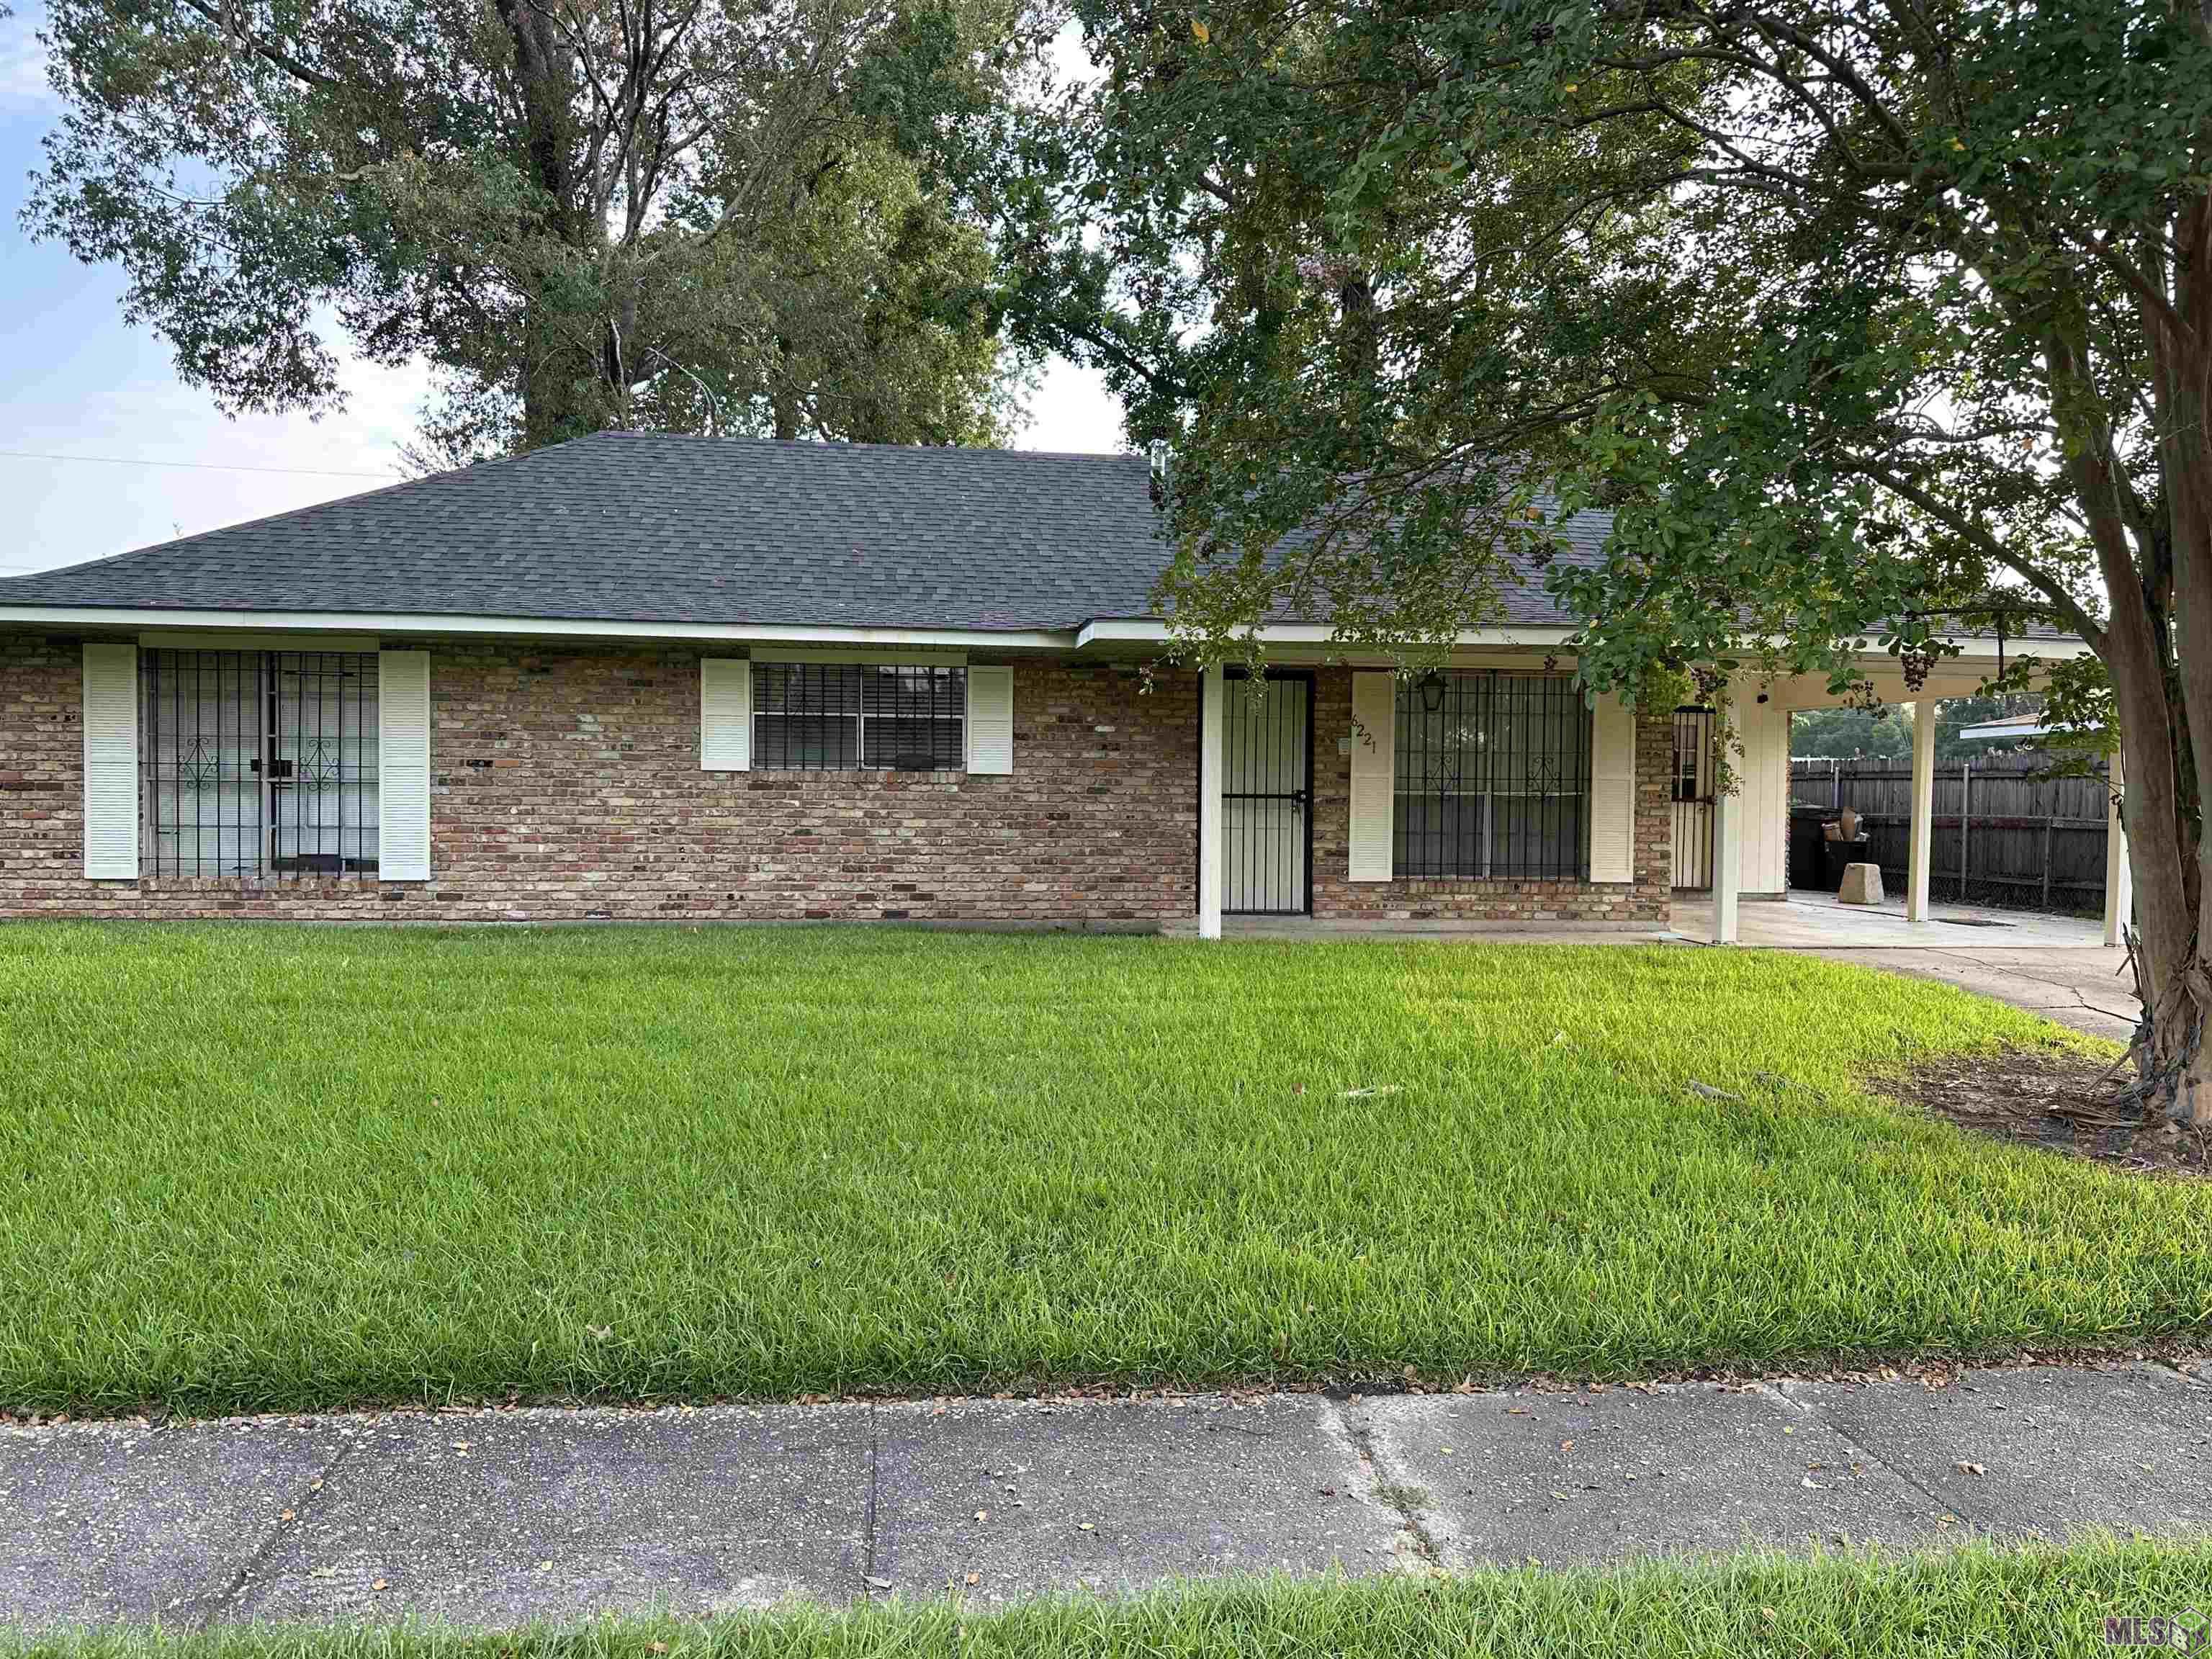
Active
$189,000
4
bds
|
3
ba
|
2,078
sqft
|
built
1990
6221 Lotus St, Baton Rouge, LA 70812
$348
Cash flow
9.6%
Cash-on-Cash Return
7.9%
Cap rate
1.0%
Rent to Value Ratio
997 out of 1,285 properties for sale in Baton Rouge, LA
Limited Results Shown
Create a free account, or log in to reveal all property listings and enjoy the complete experience.
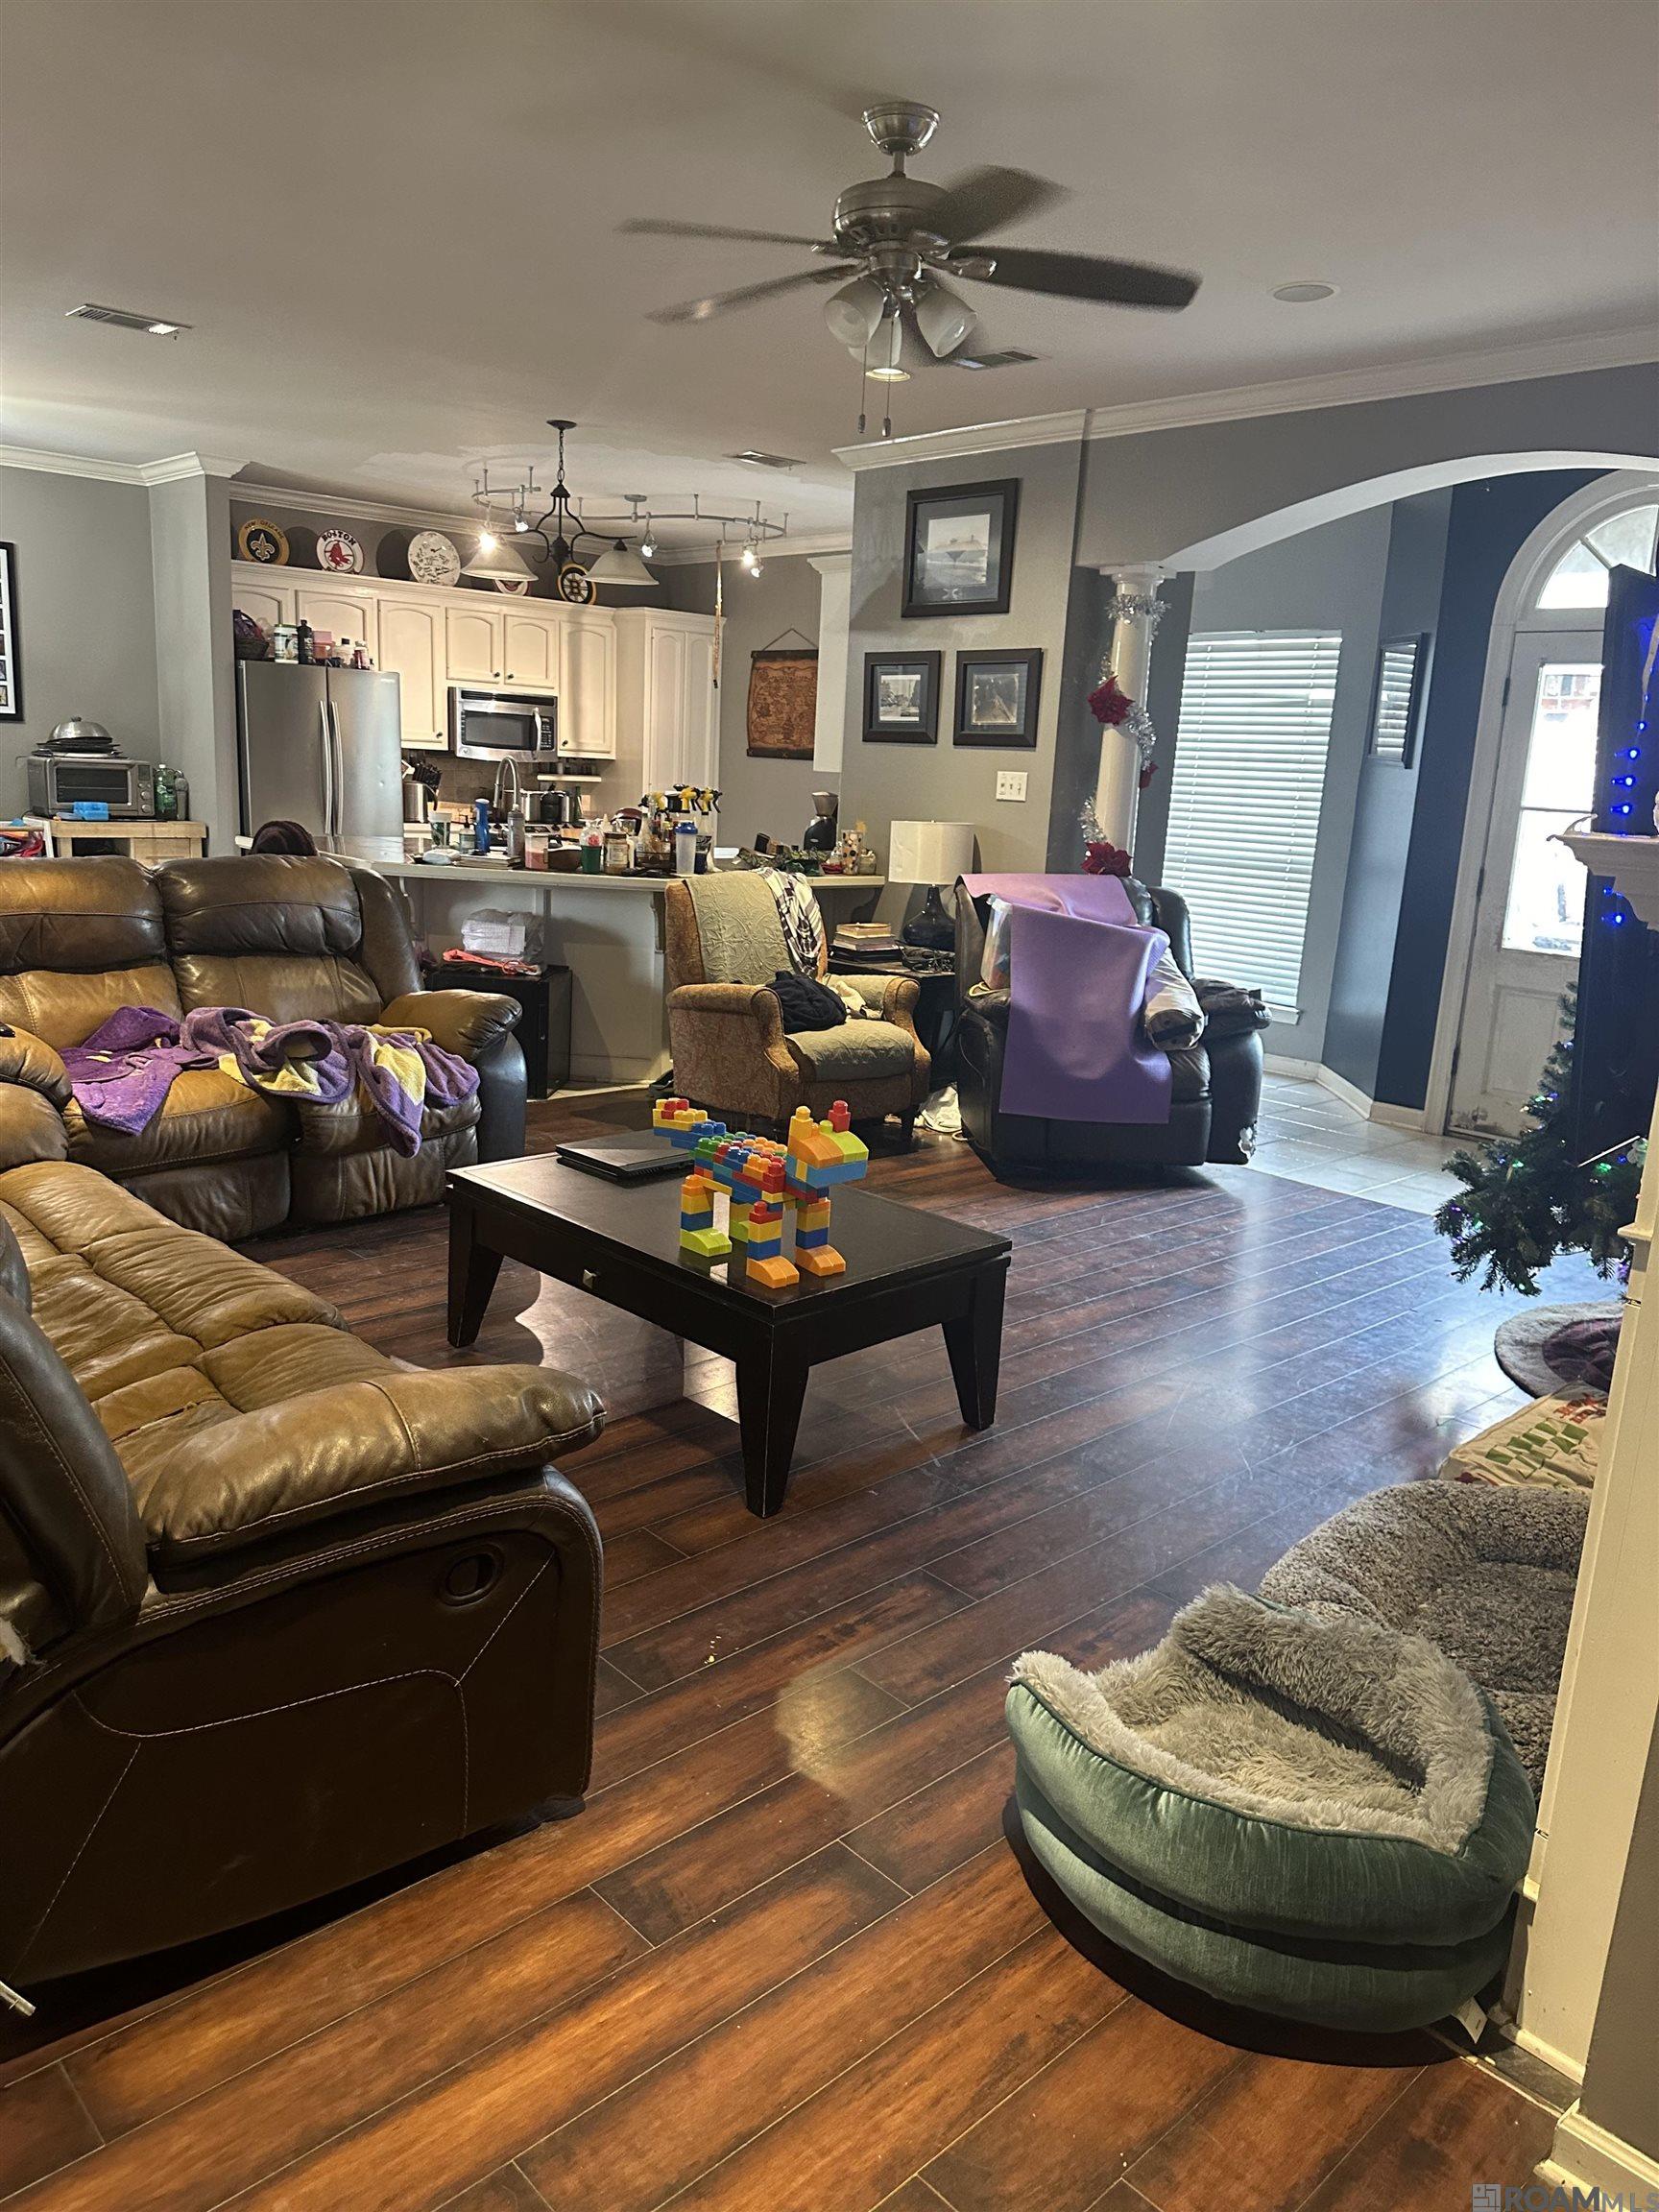
Active
$269,000
3
bds
|
2
ba
|
1,642
sqft
|
built
1997
3988 Meadow Ridge Dr, Baton Rouge, LA 70817
$23
Cash flow
0.4%
Cash-on-Cash Return
5.8%
Cap rate
0.7%
Rent to Value Ratio
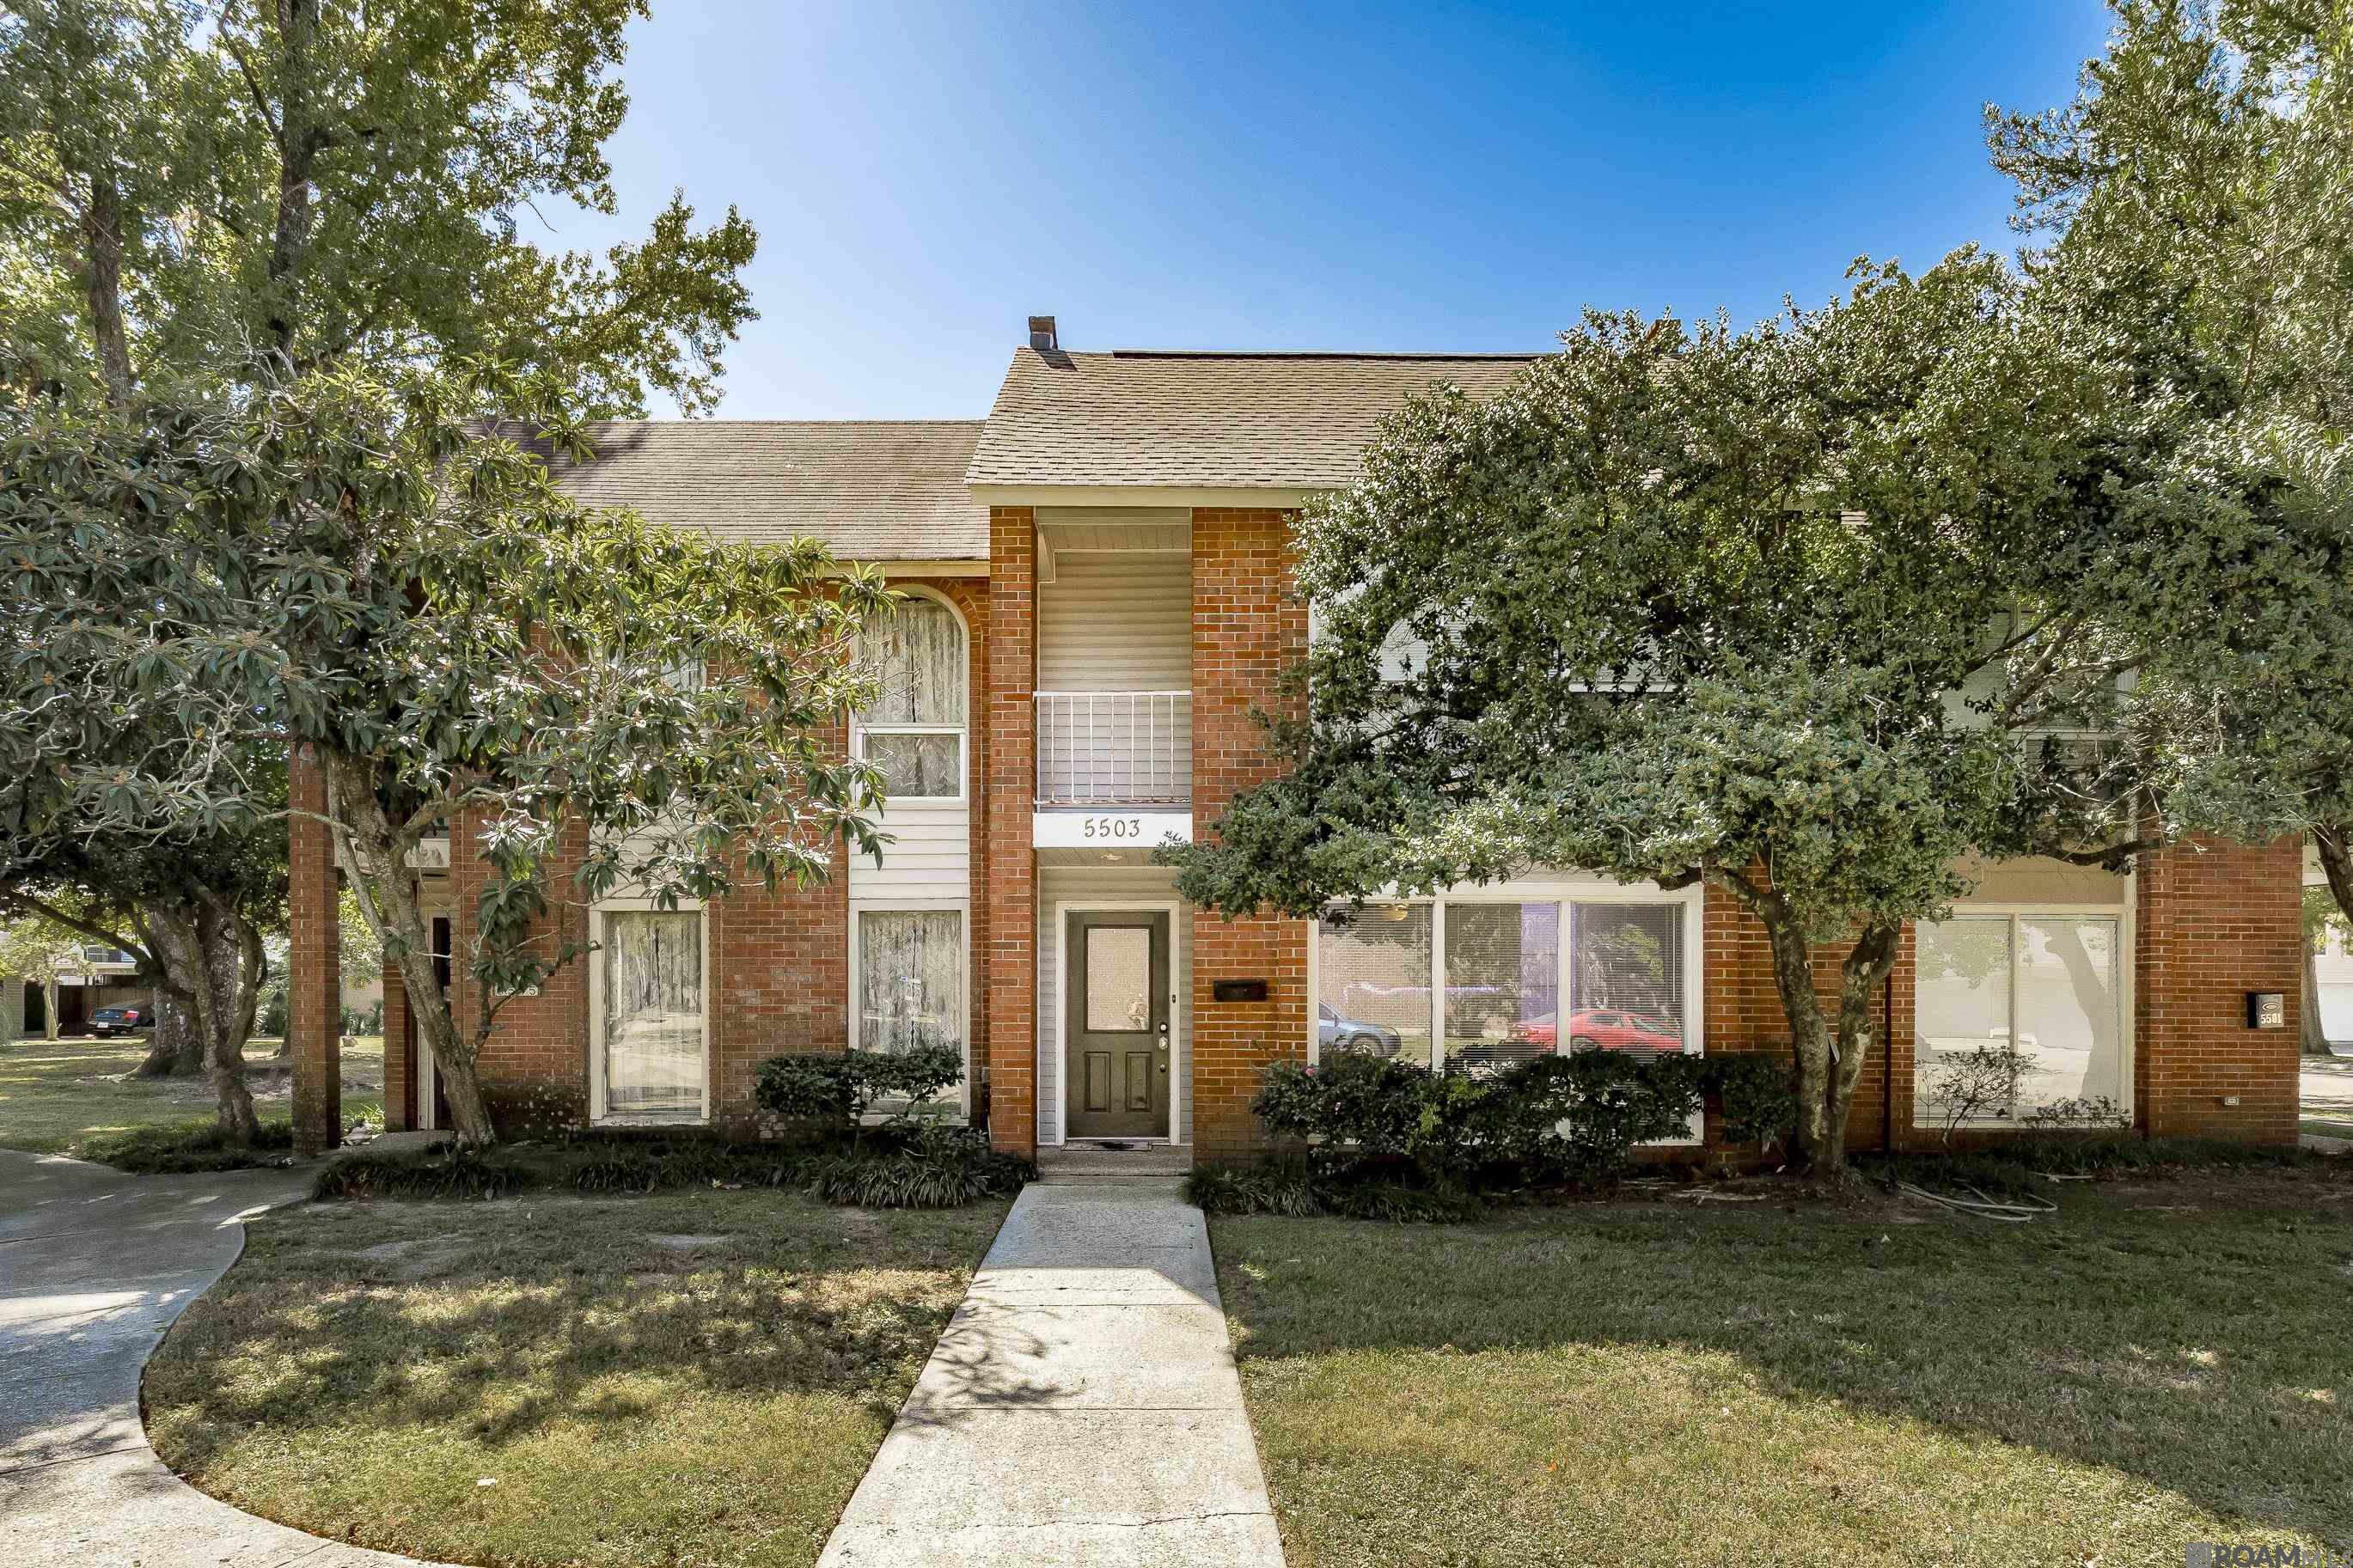
Pending
$159,900
2
bds
|
3
ba
|
1,850
sqft
|
built
1982
5503 Moorstone Dr, Baton Rouge, LA 70820
$290
Cash flow
9.5%
Cash-on-Cash Return
7.9%
Cap rate
1.1%
Rent to Value Ratio
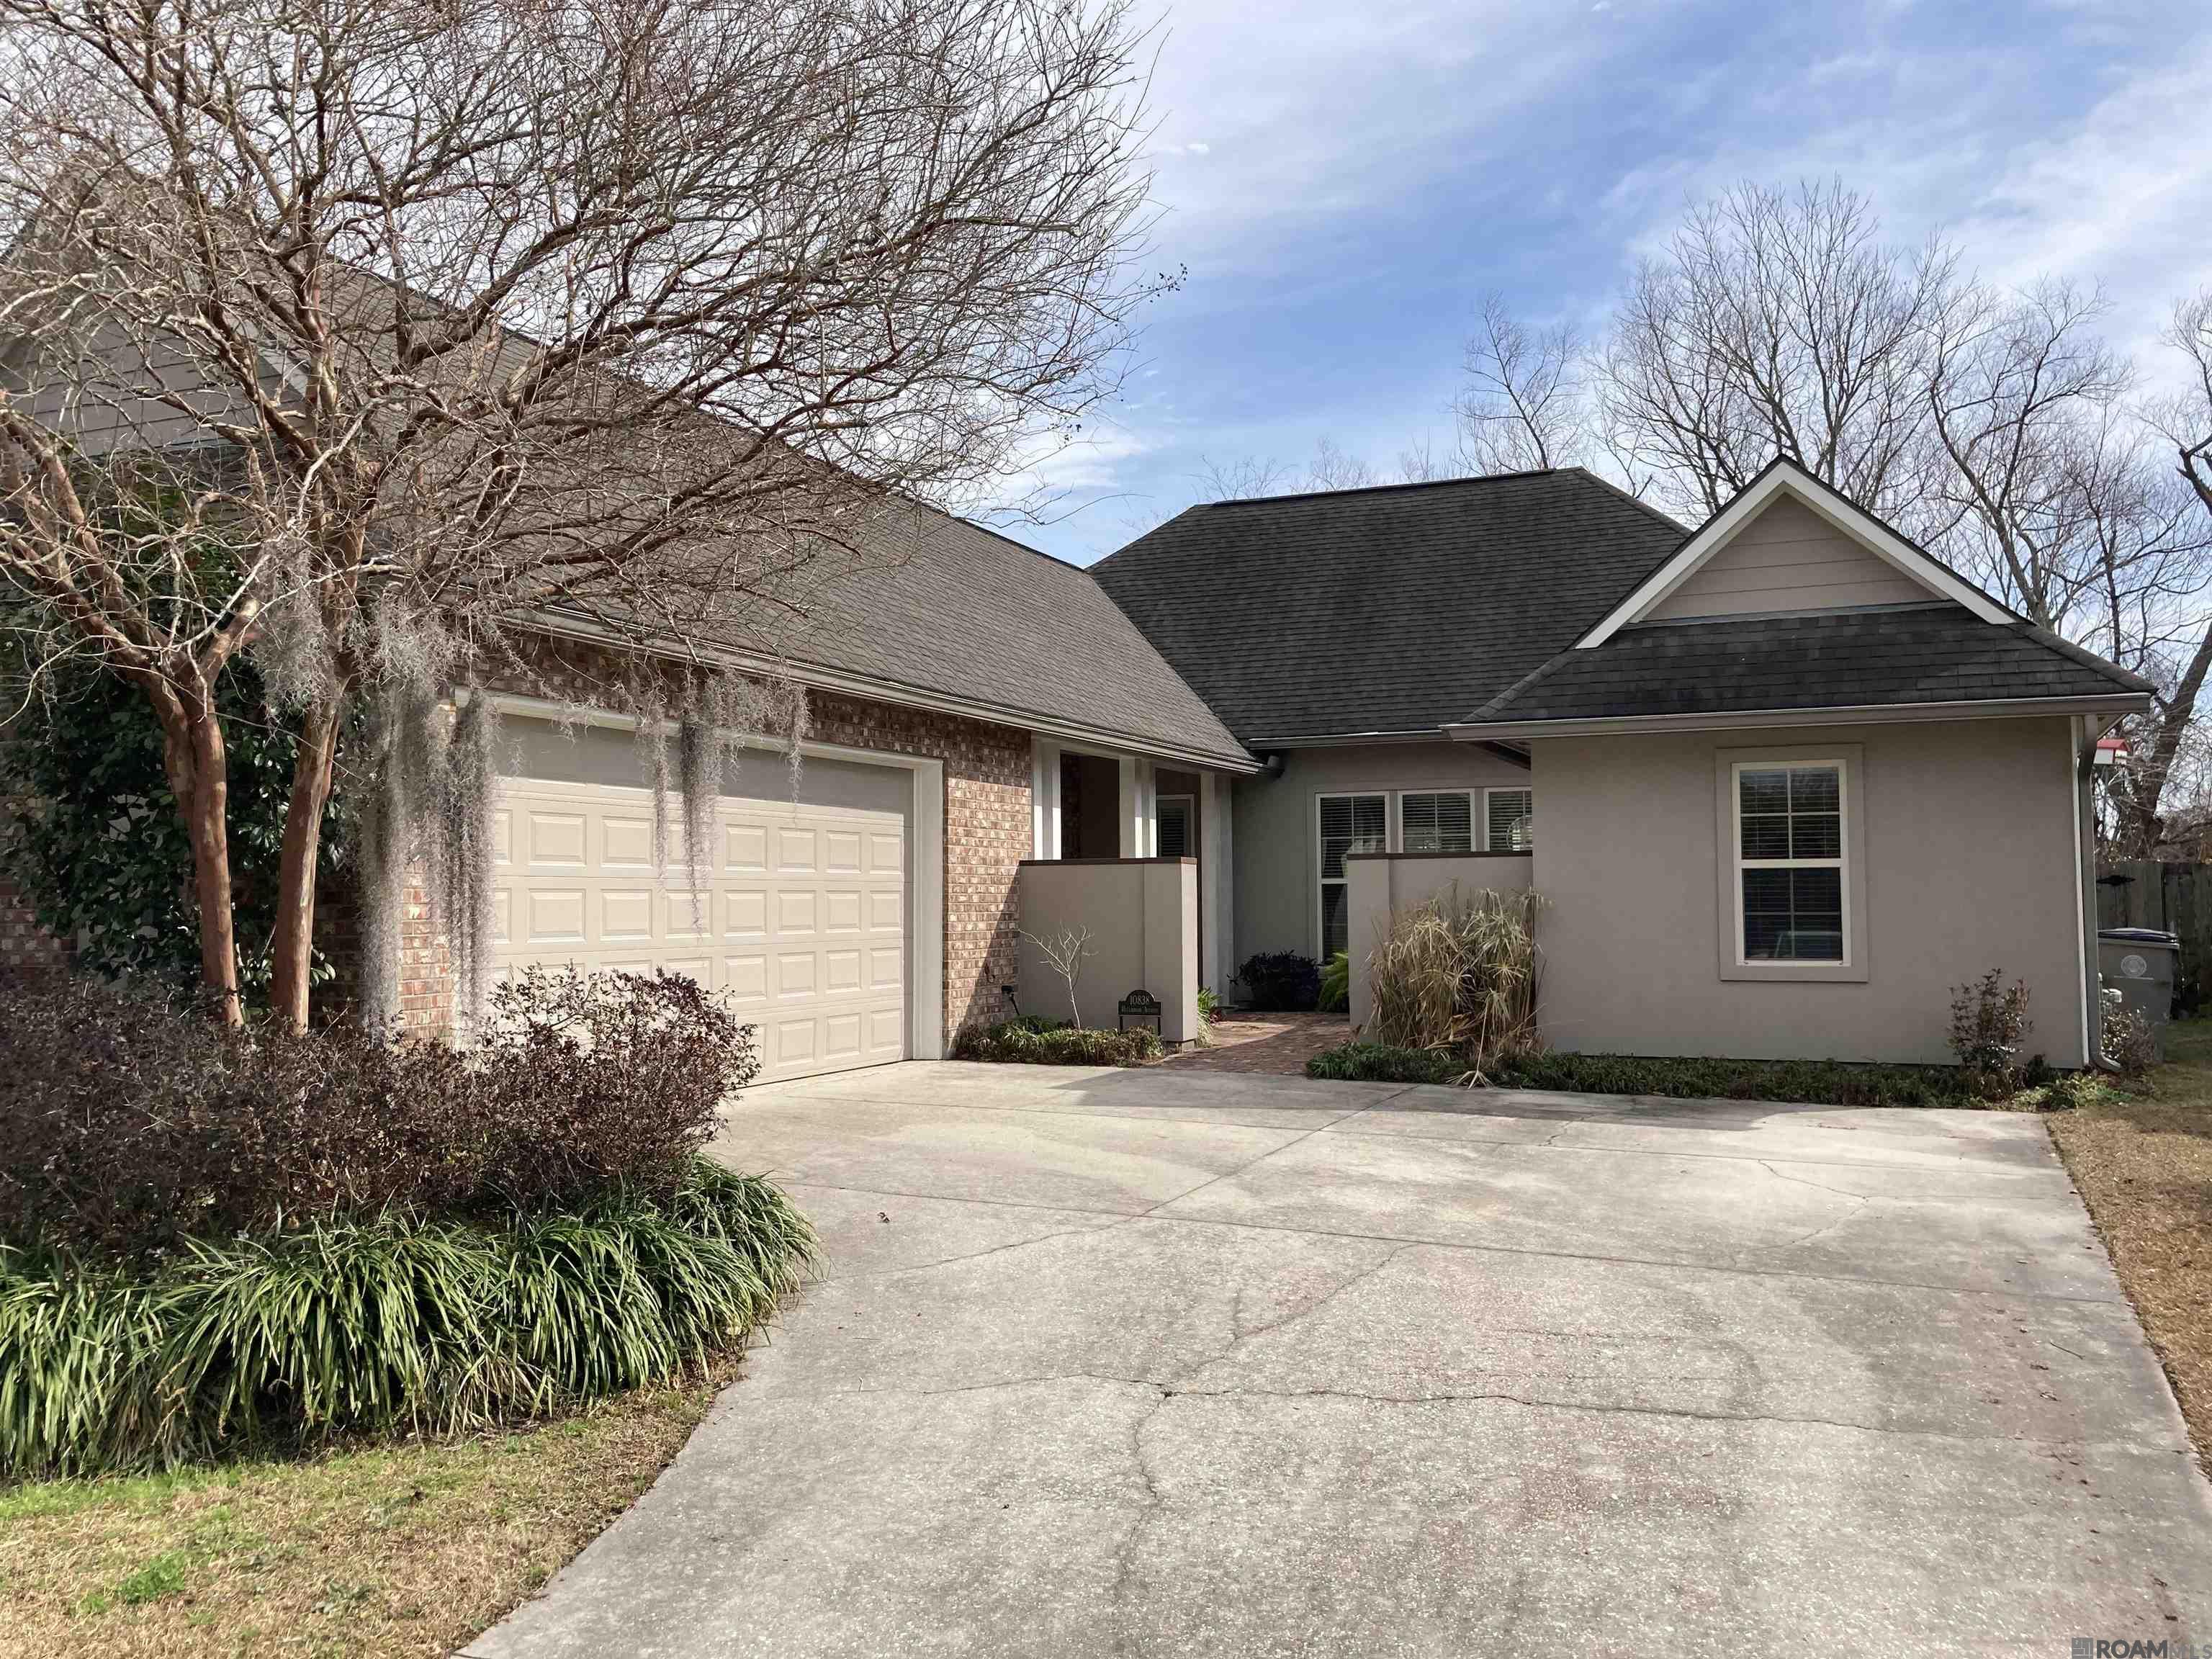
Active
$350,000
4
bds
|
3
ba
|
2,107
sqft
|
built
2009
10838 Hillbrook Ave, Baton Rouge, LA 70810
$243
Cash flow
3.6%
Cash-on-Cash Return
6.5%
Cap rate
0.8%
Rent to Value Ratio
Active
$229,900
3
bds
|
2
ba
|
1,532
sqft
|
built
2006
516 Hardwick Dr, Baton Rouge, LA 70815
$134
Cash flow
3.0%
Cash-on-Cash Return
6.4%
Cap rate
0.8%
Rent to Value Ratio
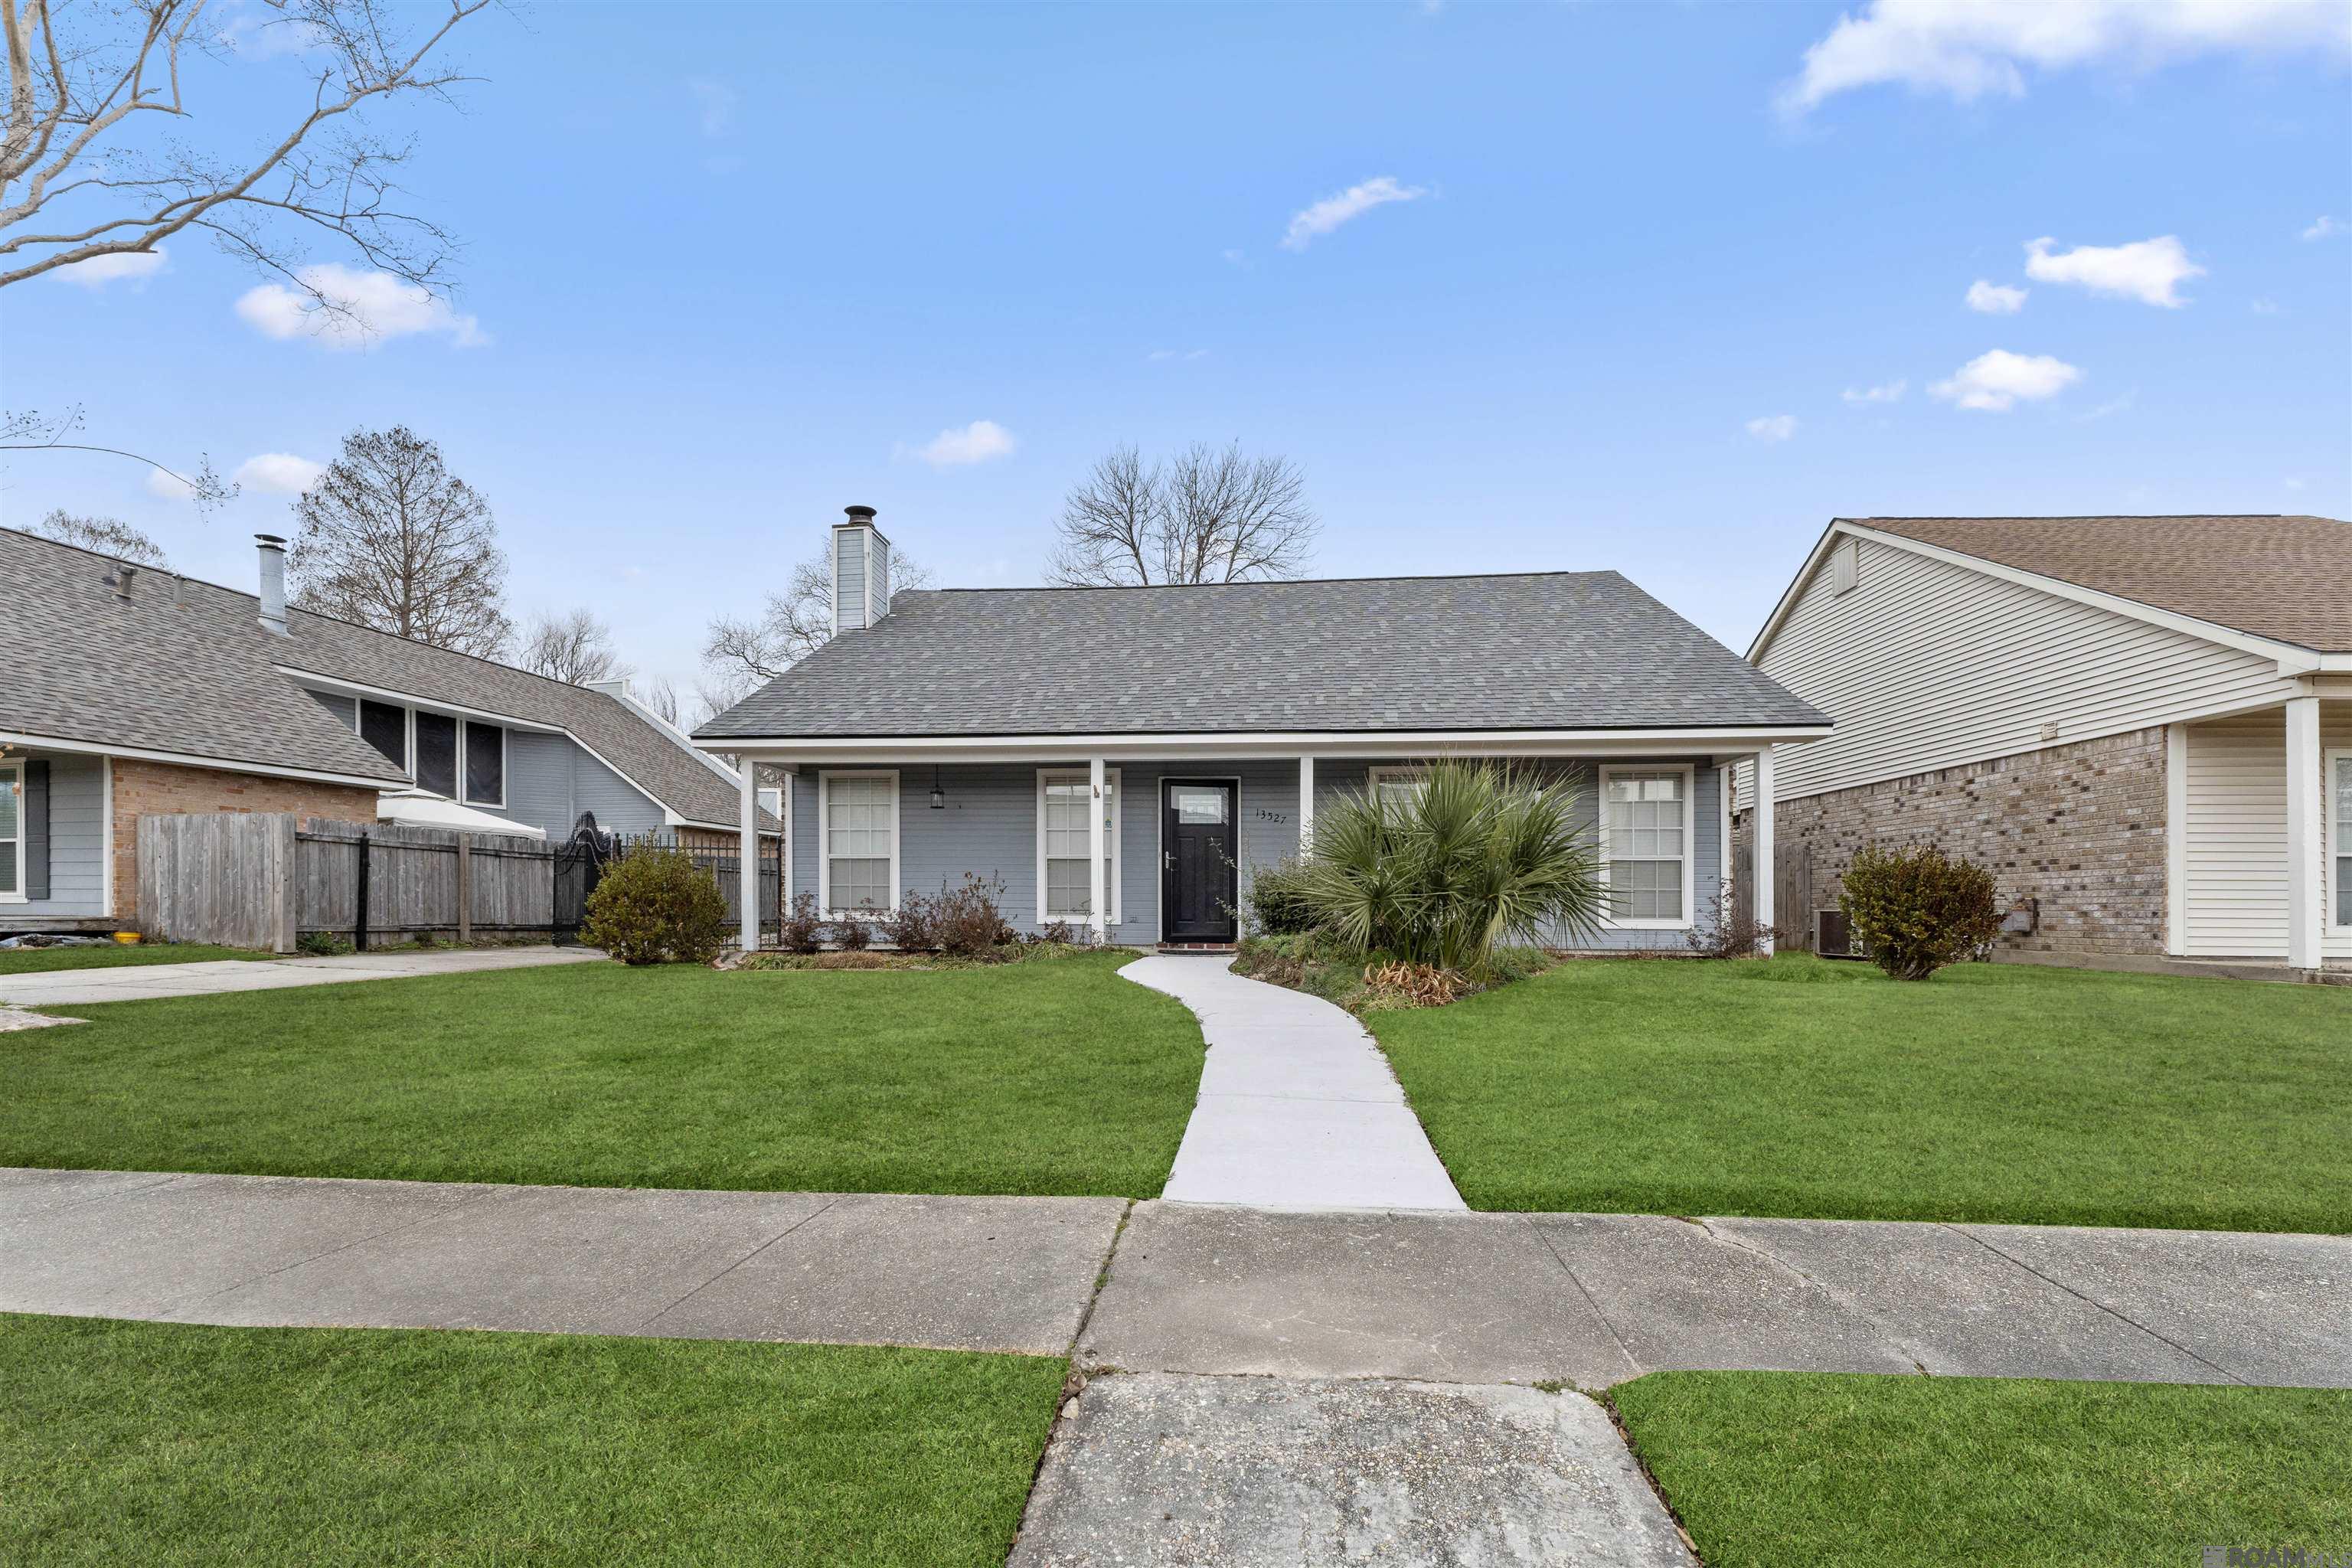
Active
$230,000
3
bds
|
2
ba
|
1,437
sqft
|
built
1984
13527 Parwood Ave, Baton Rouge, LA 70816
$85
Cash flow
1.9%
Cash-on-Cash Return
6.1%
Cap rate
0.7%
Rent to Value Ratio

Active
$320,000
4
bds
|
3
ba
|
2,775
sqft
|
built
1982
5421 Bluewater Dr, Baton Rouge, LA 70817
$211
Cash flow
3.4%
Cash-on-Cash Return
6.5%
Cap rate
0.8%
Rent to Value Ratio

Active
$159,000
3
bds
|
2
ba
|
1,185
sqft
|
built
1965
6063 Glen Oaks Dr, Baton Rouge, LA 70811
$214
Cash flow
7.0%
Cash-on-Cash Return
7.3%
Cap rate
0.9%
Rent to Value Ratio
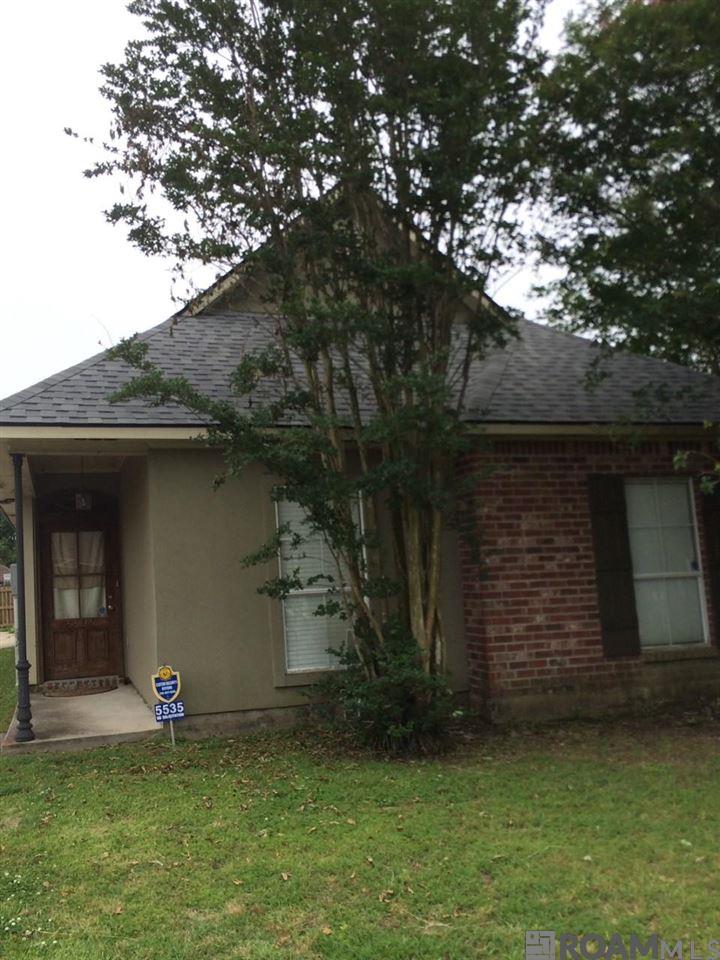
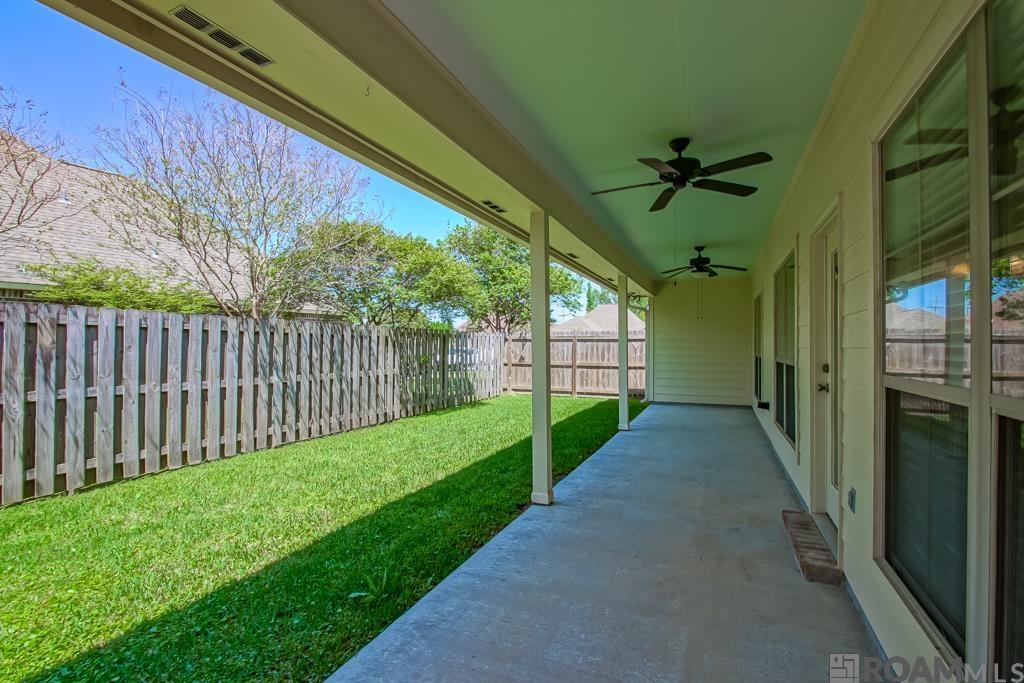
Active
$244,900
3
bds
|
2
ba
|
1,418
sqft
|
built
1999
5535 Ducros Dr, Baton Rouge, LA 70820
$-108
Cash flow
-2.3%
Cash-on-Cash Return
5.1%
Cap rate
0.7%
Rent to Value Ratio
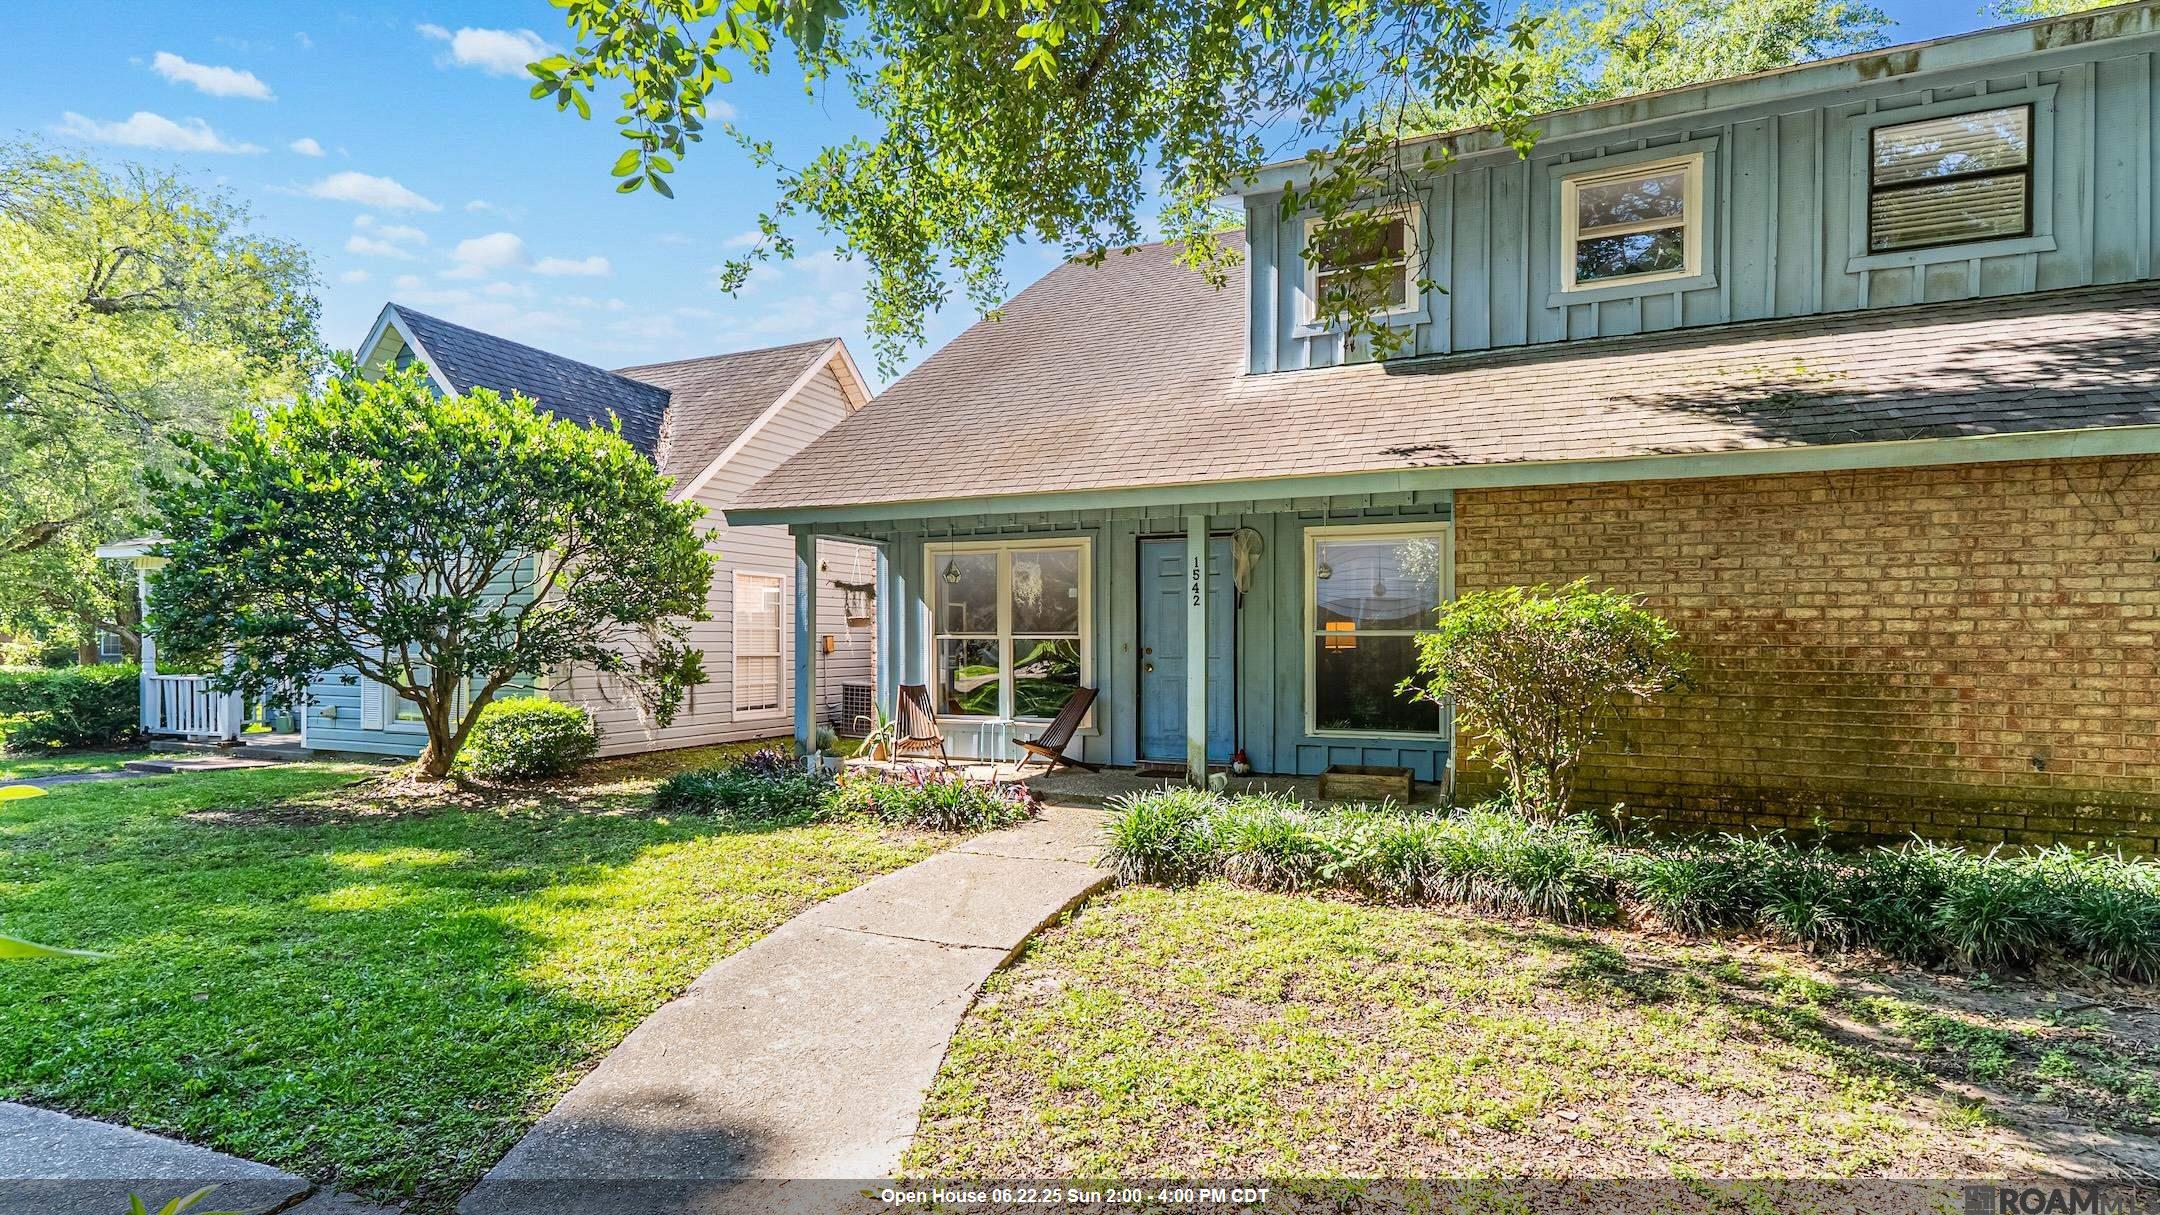
Active
$183,500
3
bds
|
3
ba
|
1,735
sqft
|
built
1983
1542 Sharlo Ave, Baton Rouge, LA 70820
$196
Cash flow
5.6%
Cash-on-Cash Return
7.0%
Cap rate
0.9%
Rent to Value Ratio
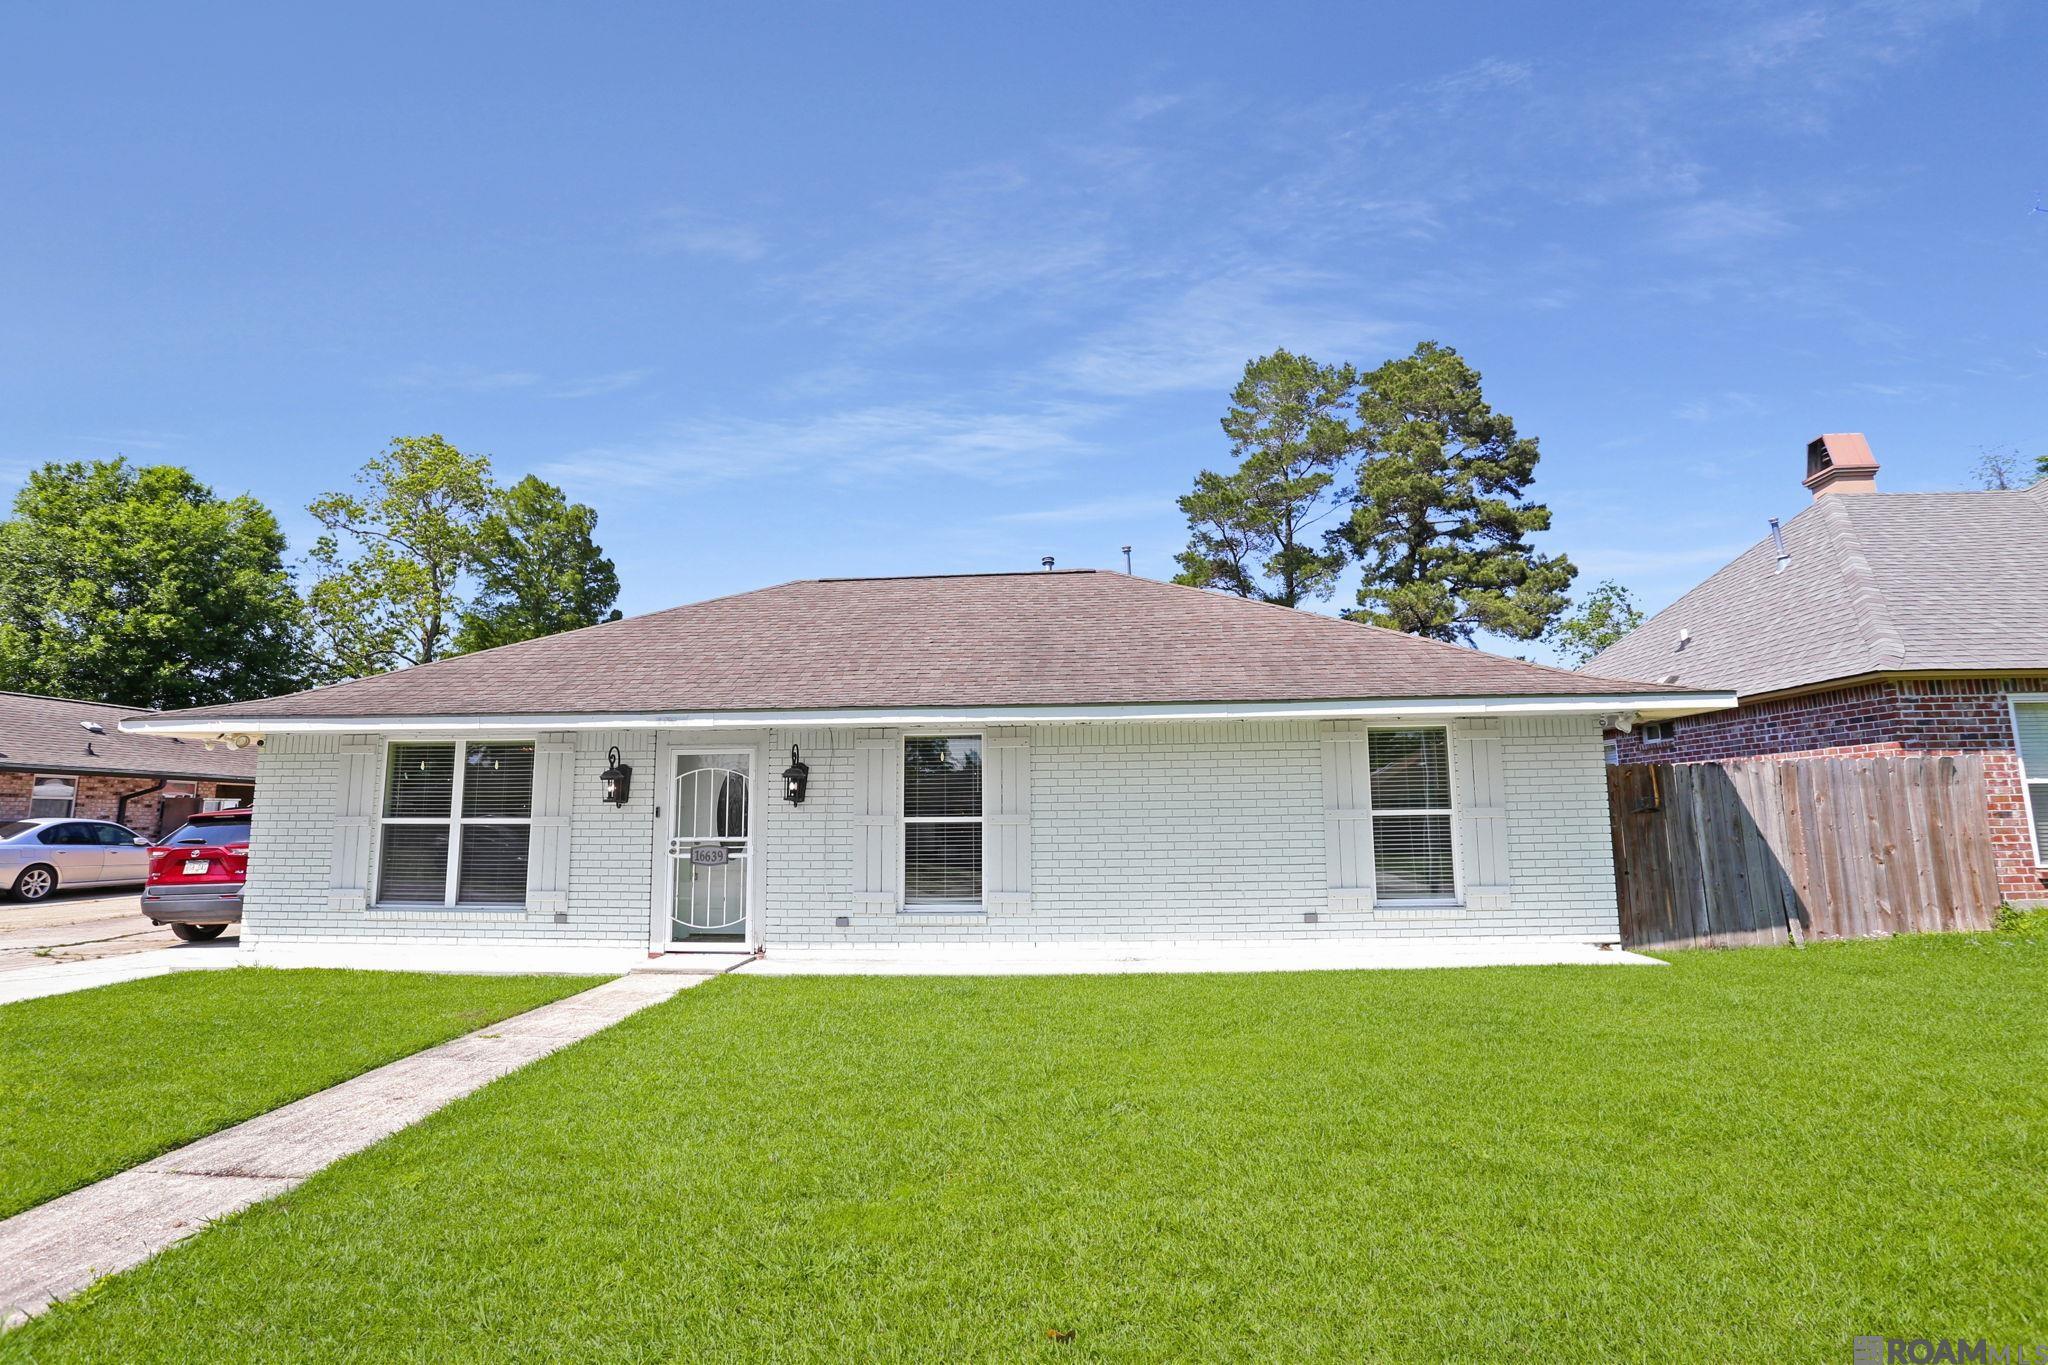
Active
$314,900
5
bds
|
3
ba
|
2,672
sqft
|
built
1979
16639 Patton Ave, Baton Rouge, LA 70816
$235
Cash flow
3.9%
Cash-on-Cash Return
6.6%
Cap rate
0.8%
Rent to Value Ratio

Active
$240,000
3
bds
|
2
ba
|
1,973
sqft
|
built
1967
1125 Terrace Ave, Baton Rouge, LA 70802
$106
Cash flow
2.3%
Cash-on-Cash Return
6.2%
Cap rate
0.8%
Rent to Value Ratio
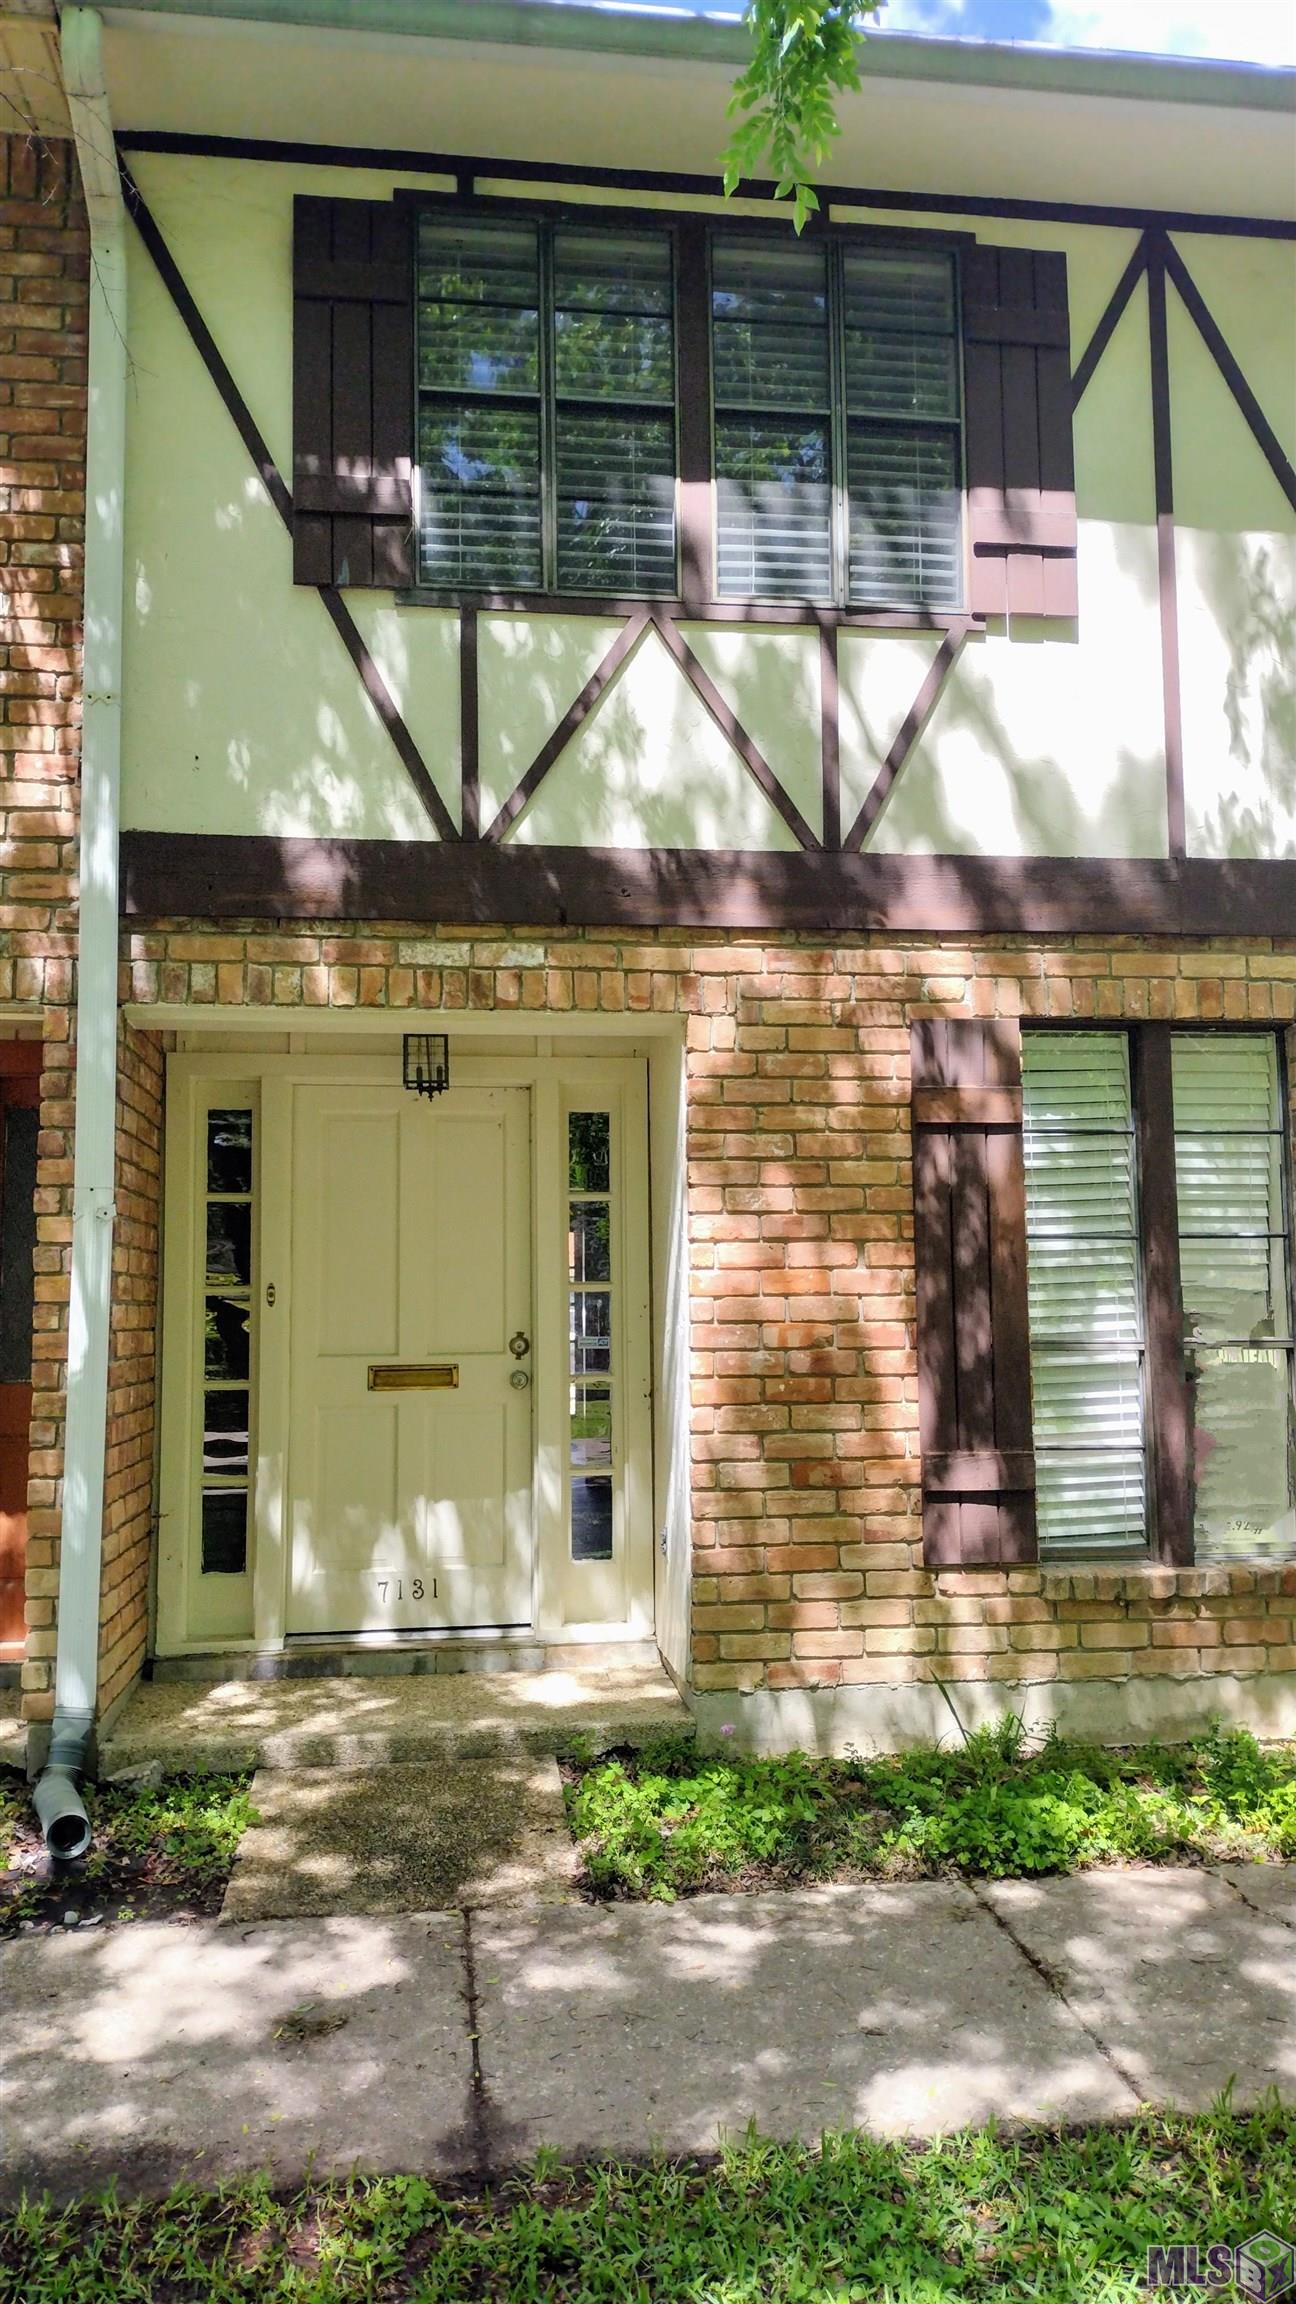
Active
$230,000
3
bds
|
2
ba
|
1,928
sqft
|
built
1980
7131 Winthrop Ave, Baton Rouge, LA 70806
$85
Cash flow
1.9%
Cash-on-Cash Return
6.1%
Cap rate
0.7%
Rent to Value Ratio
Active
$185,000
3
bds
|
2
ba
|
1,860
sqft
|
built
1975
9786 Hooper Rd, Baton Rouge, LA 70818
$367
Cash flow
10.4%
Cash-on-Cash Return
8.1%
Cap rate
1.0%
Rent to Value Ratio
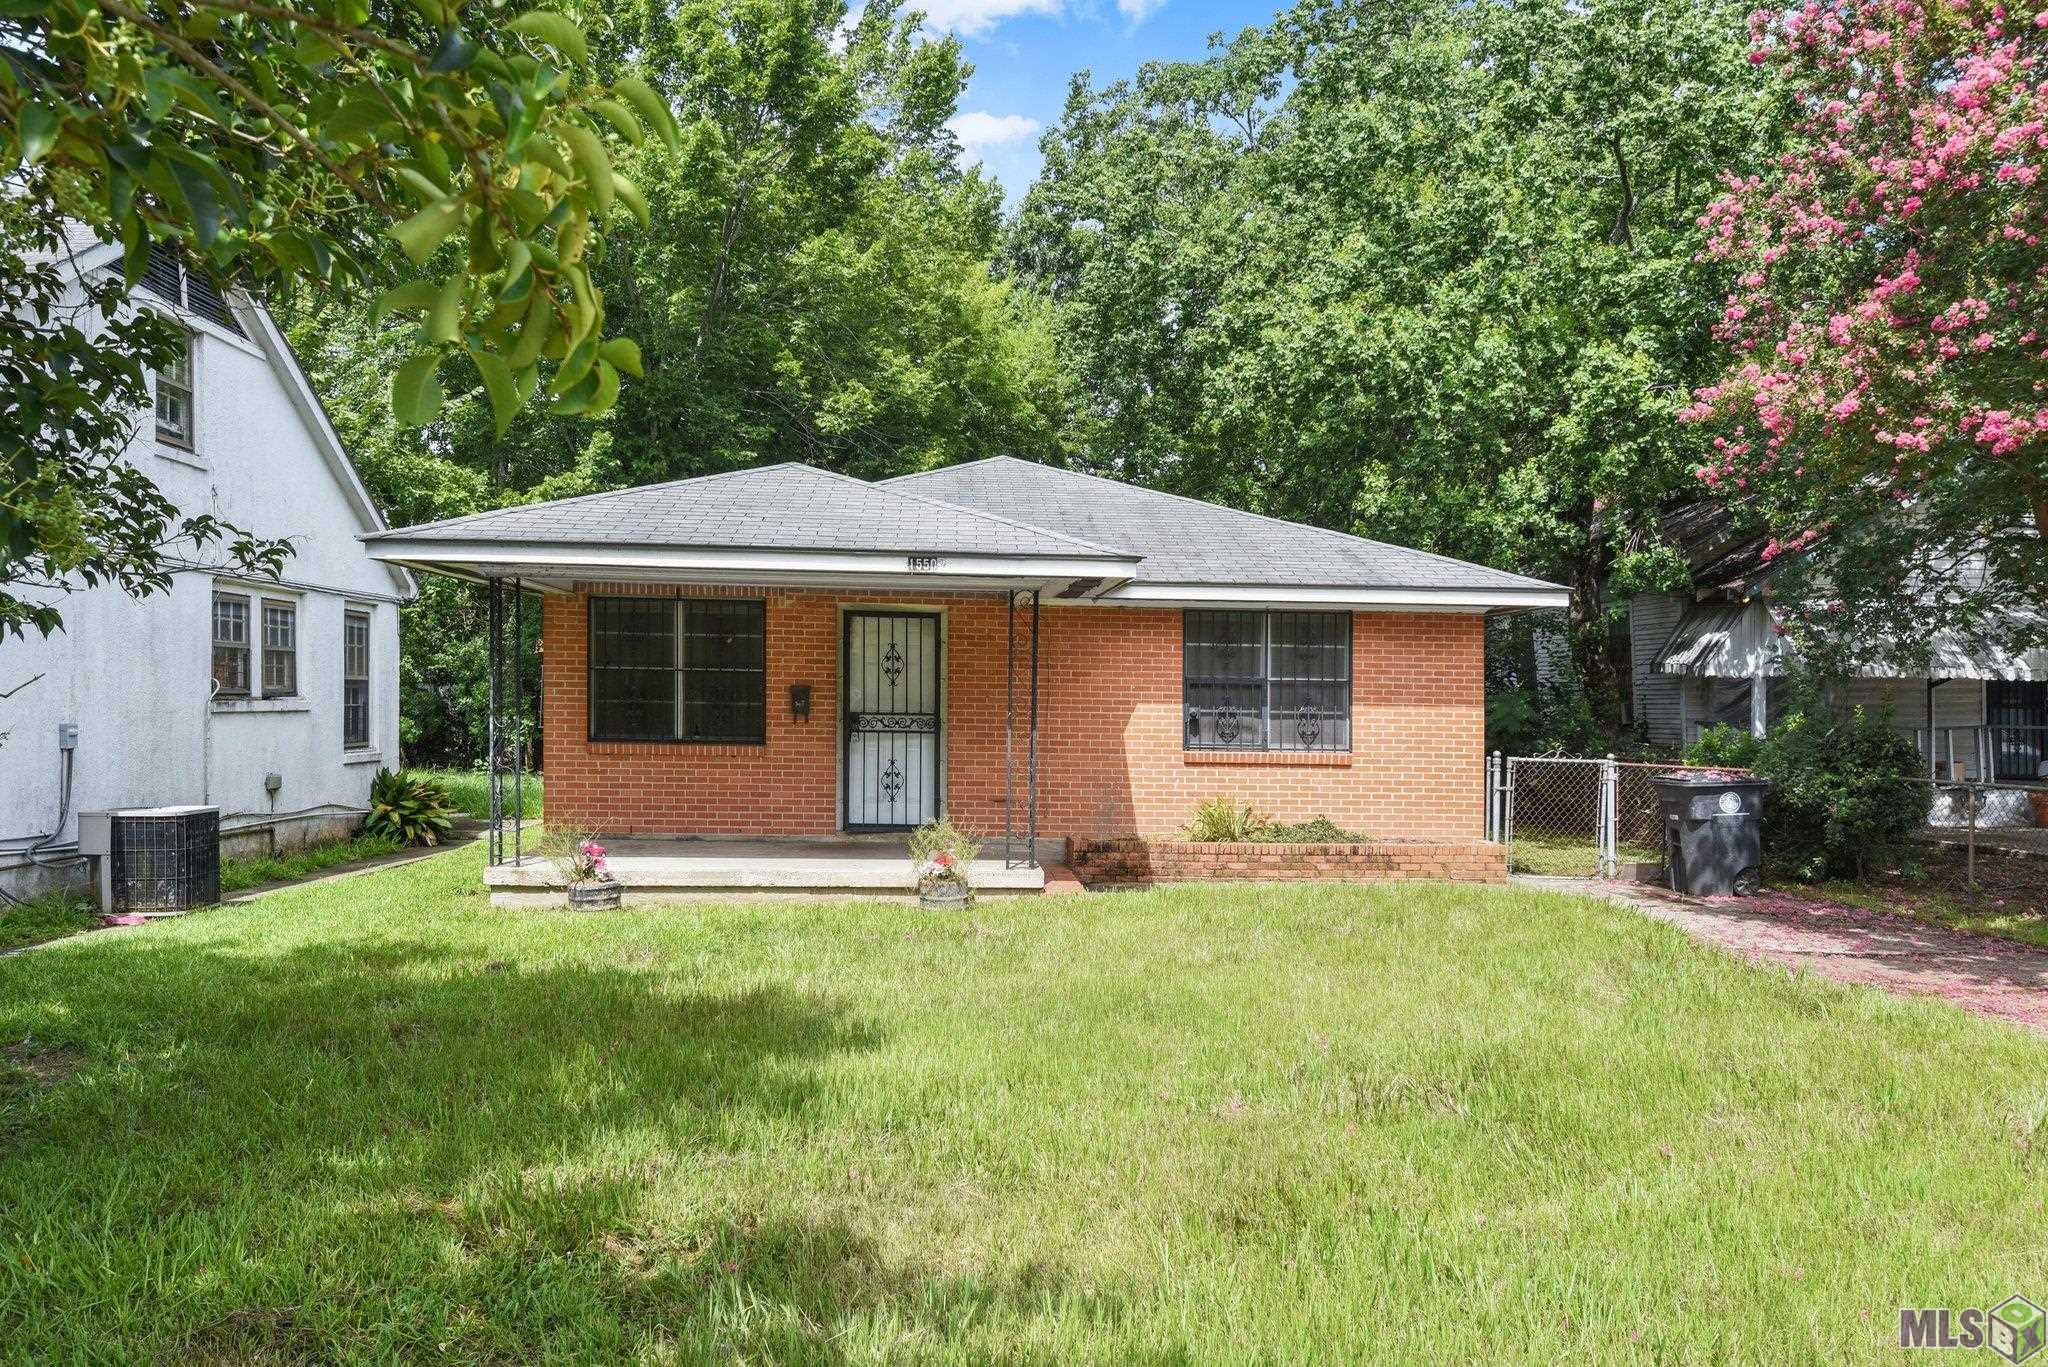
Active
$125,000
3
bds
|
2
ba
|
1,450
sqft
|
built
1958
1550 Utah St, Baton Rouge, LA 70802
$305
Cash flow
12.7%
Cash-on-Cash Return
8.6%
Cap rate
1.0%
Rent to Value Ratio
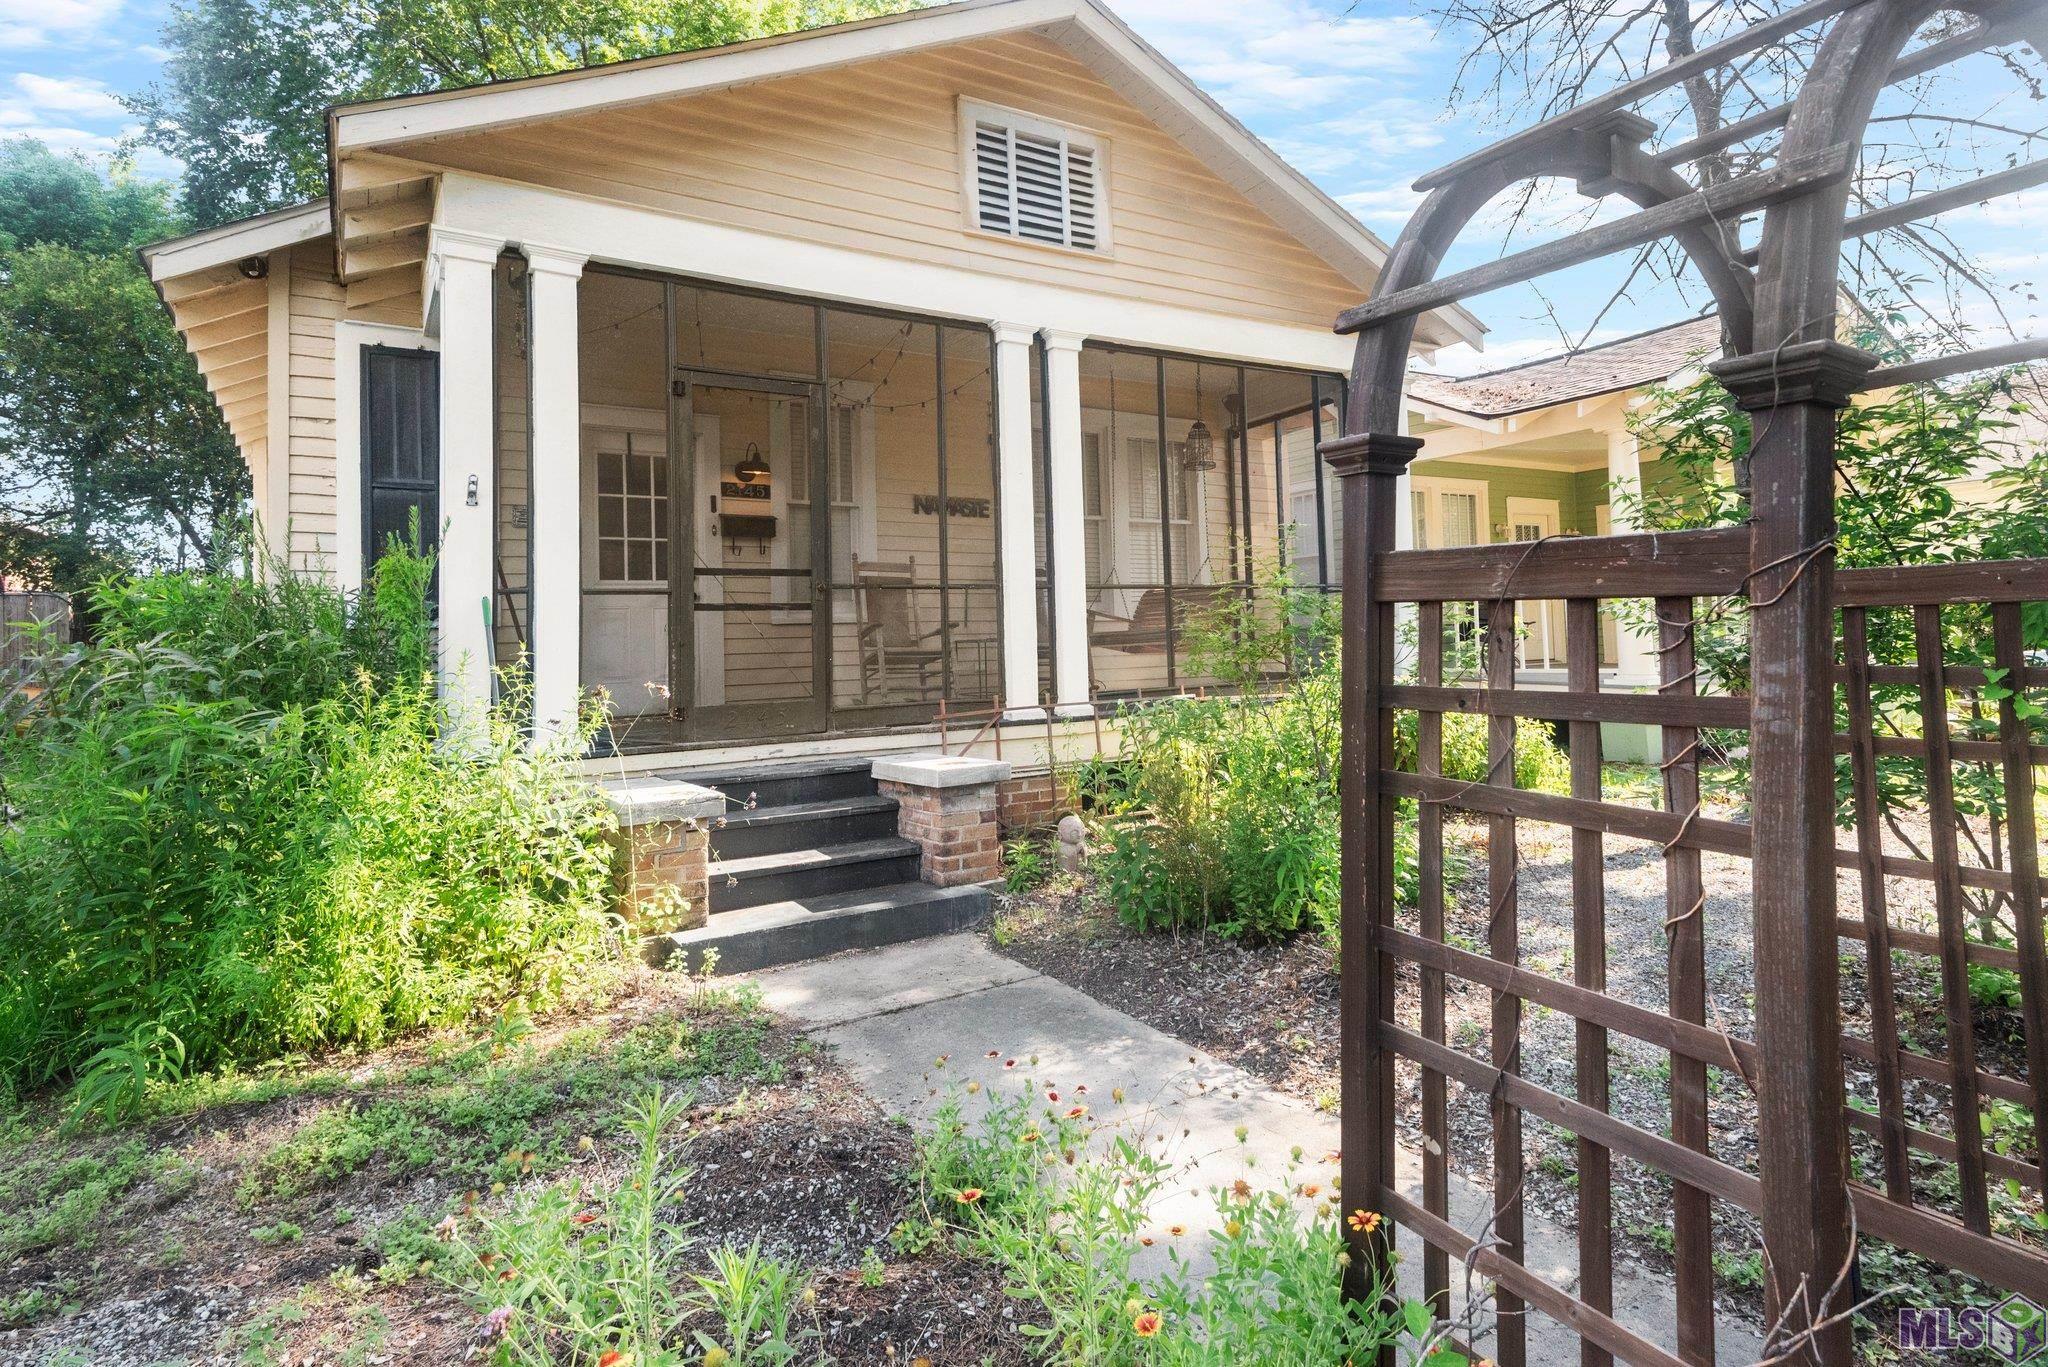
Active
$320,000
3
bds
|
2
ba
|
1,717
sqft
|
built
1938
2145 Wisteria St, Baton Rouge, LA 70806
$4
Cash flow
0.1%
Cash-on-Cash Return
5.7%
Cap rate
0.7%
Rent to Value Ratio
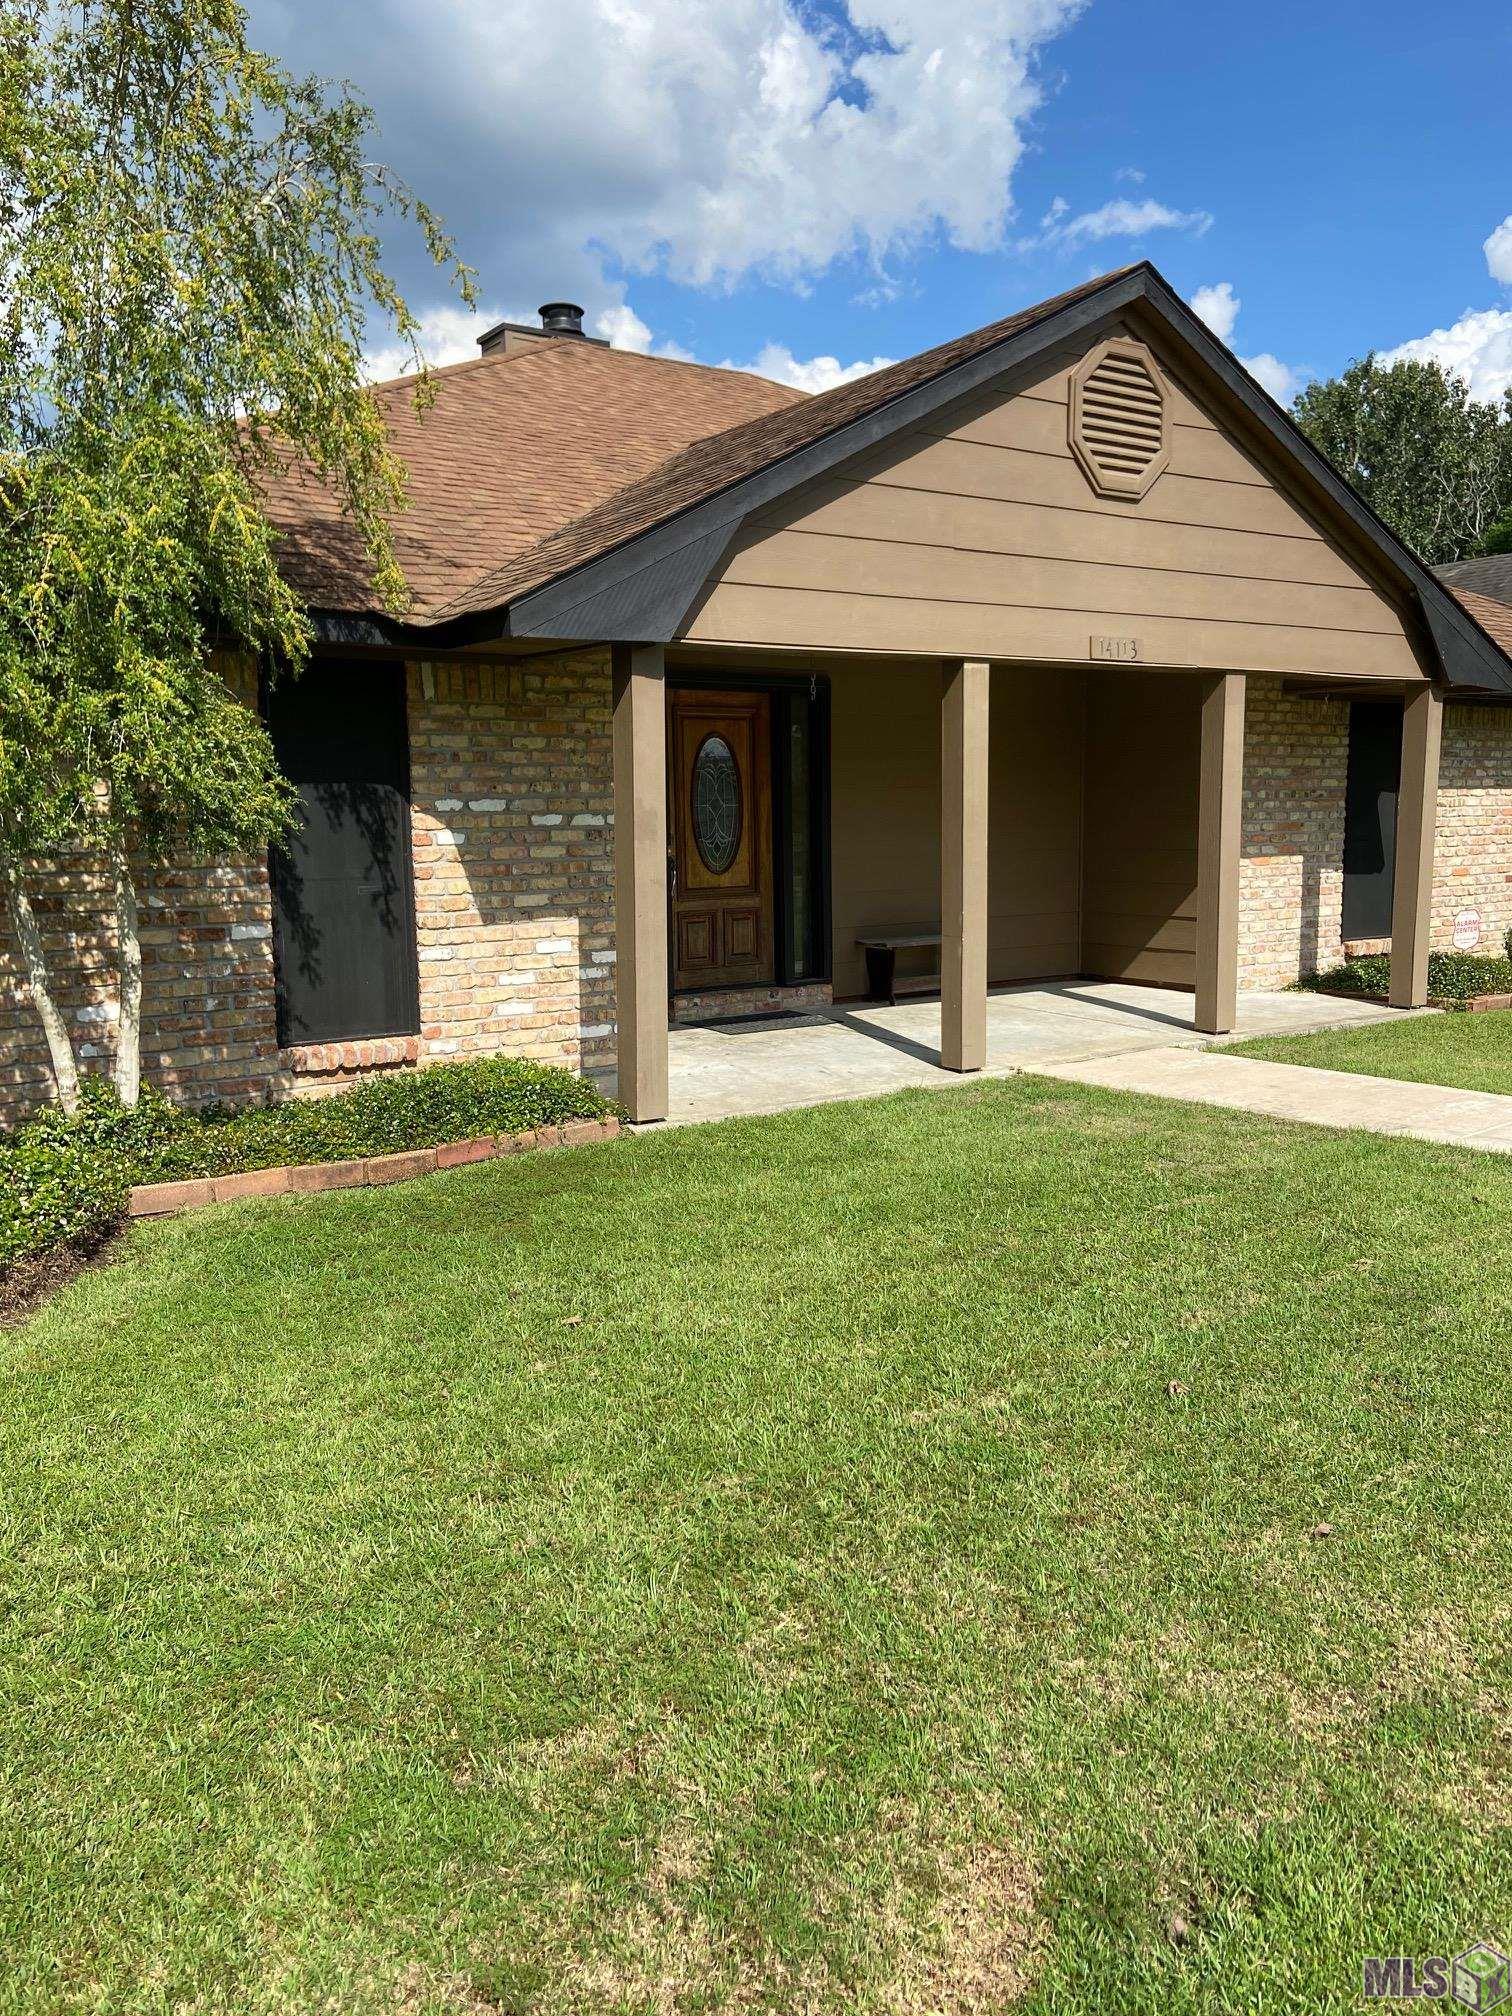
Active
$279,900
3
bds
|
3
ba
|
2,224
sqft
|
built
1977
14113 Pinehurst Ave, Baton Rouge, LA 70817
$33
Cash flow
0.6%
Cash-on-Cash Return
5.8%
Cap rate
0.7%
Rent to Value Ratio

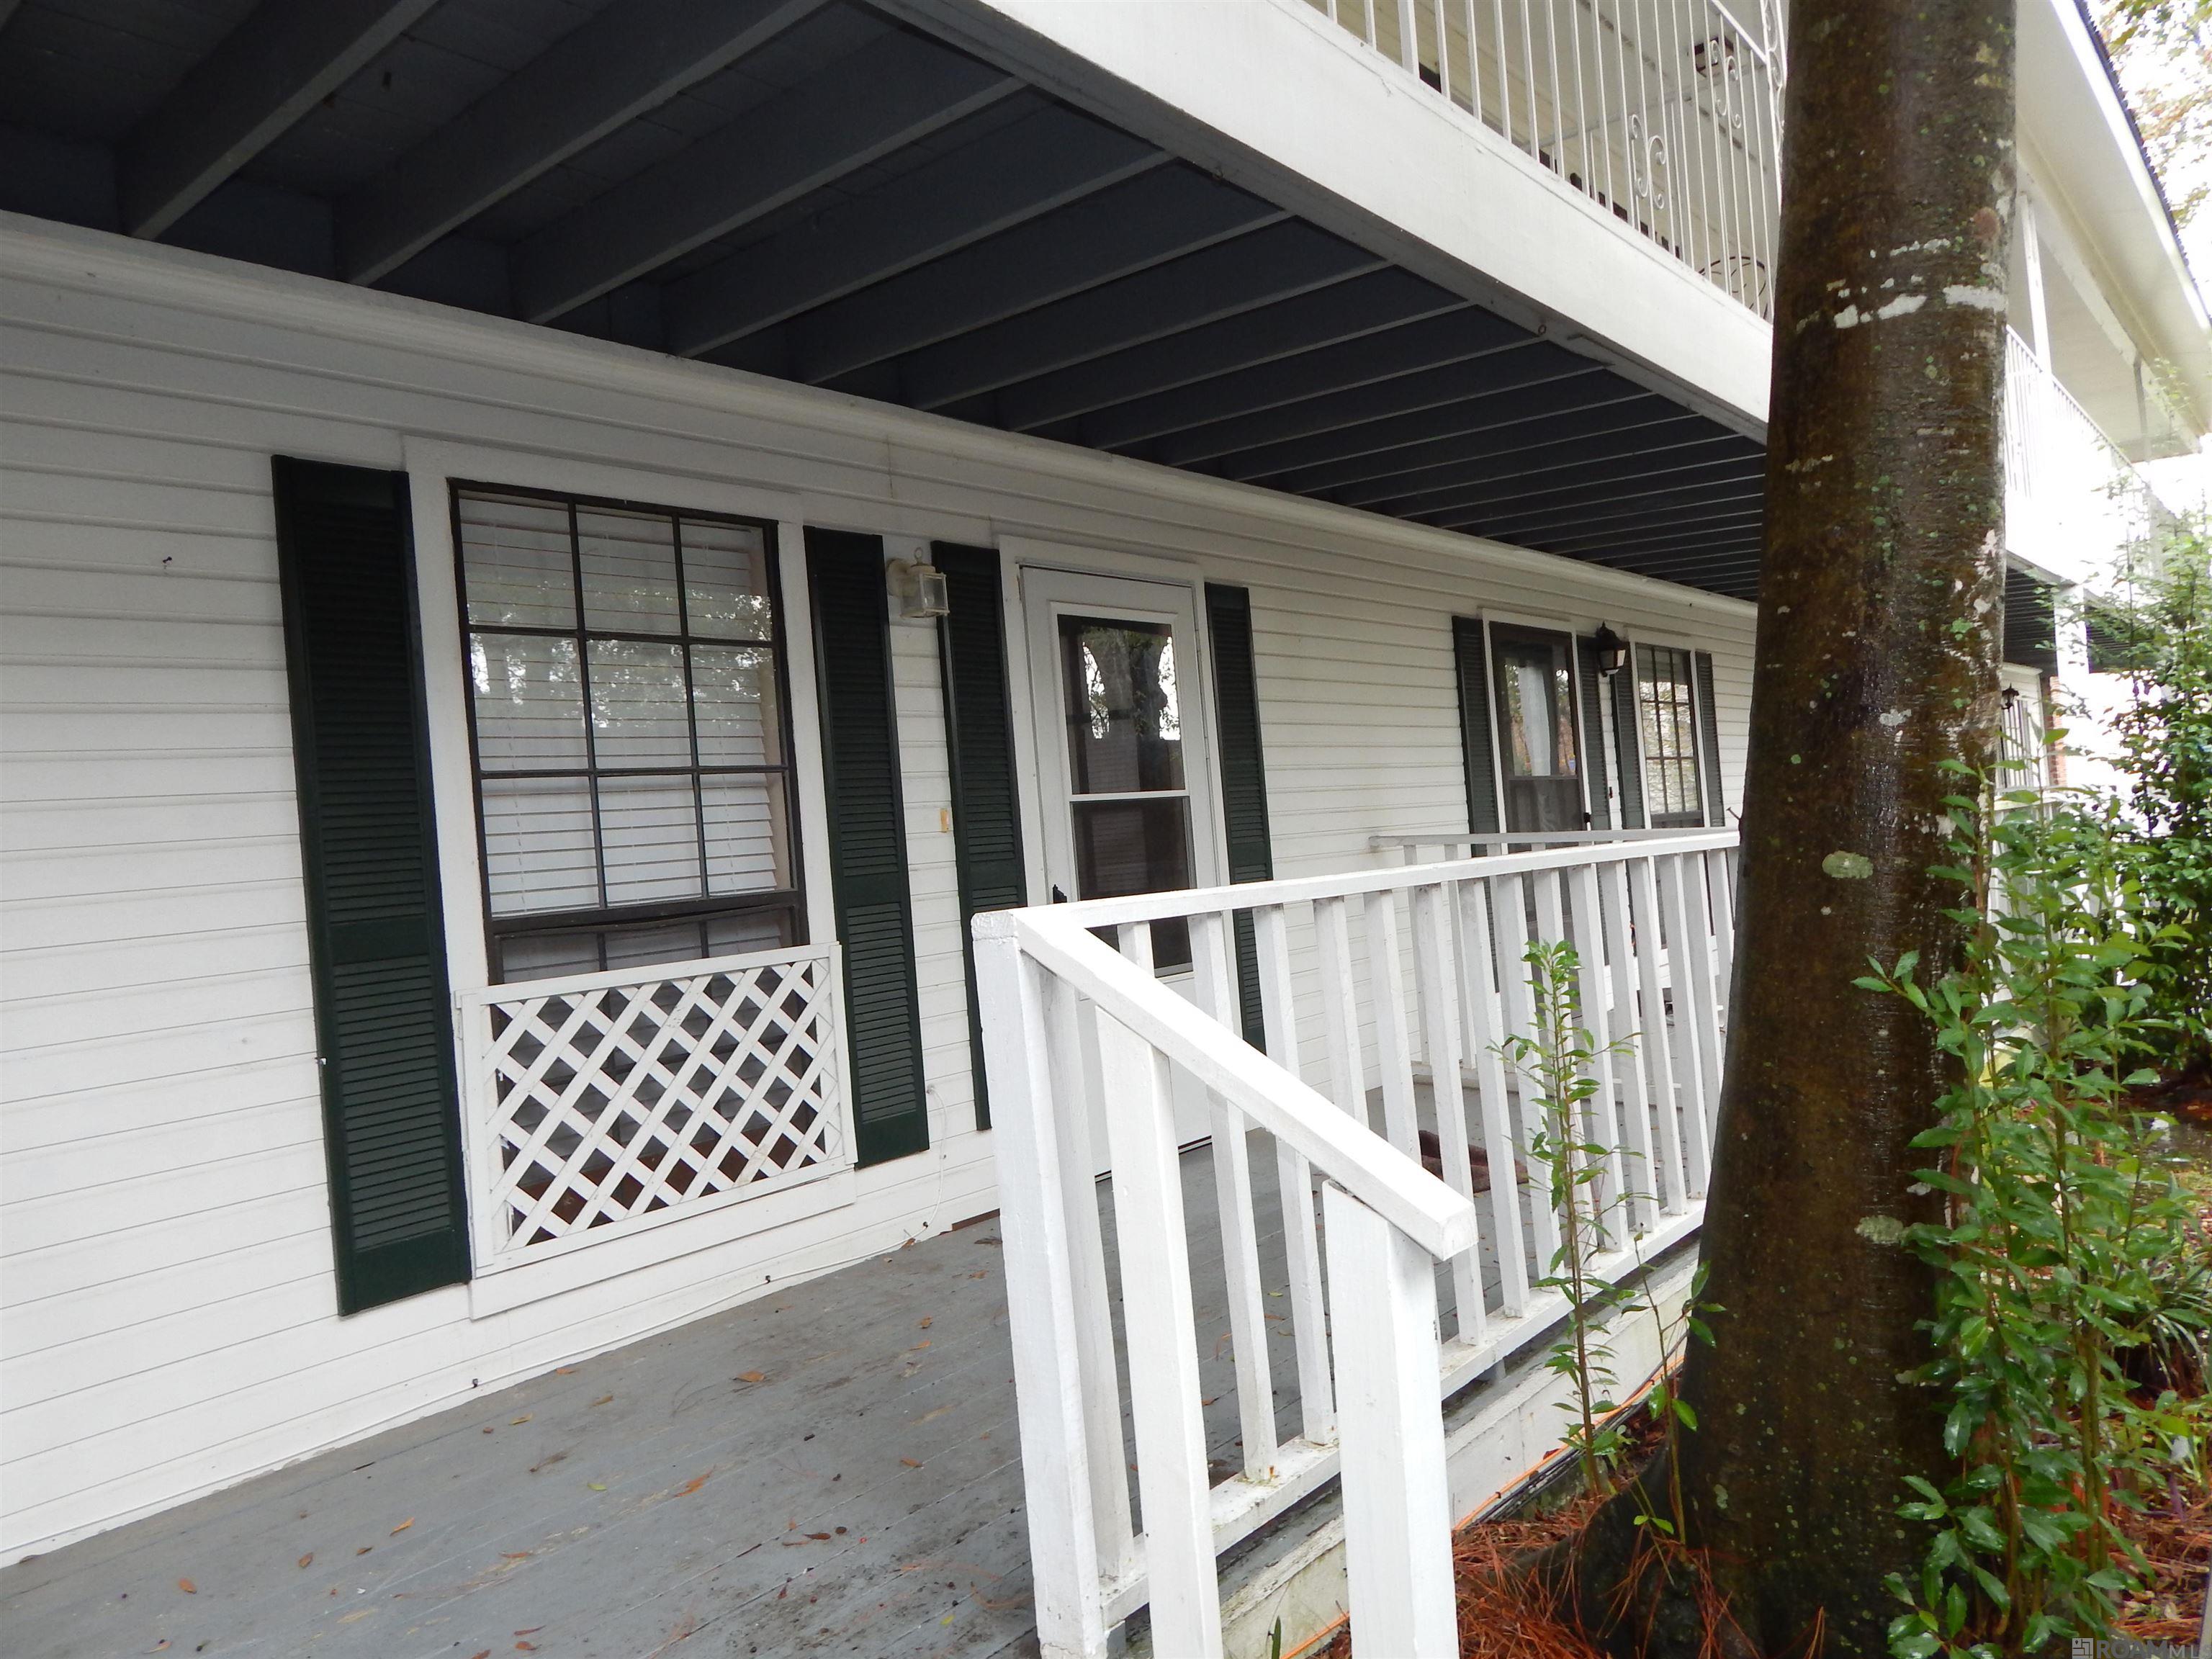
Active
$415,000
3
bds
|
3
ba
|
2,201
sqft
|
built
2014
3246 Pine Grove Dr, Baton Rouge, LA 70816
$-61
Cash flow
-0.8%
Cash-on-Cash Return
5.5%
Cap rate
0.7%
Rent to Value Ratio
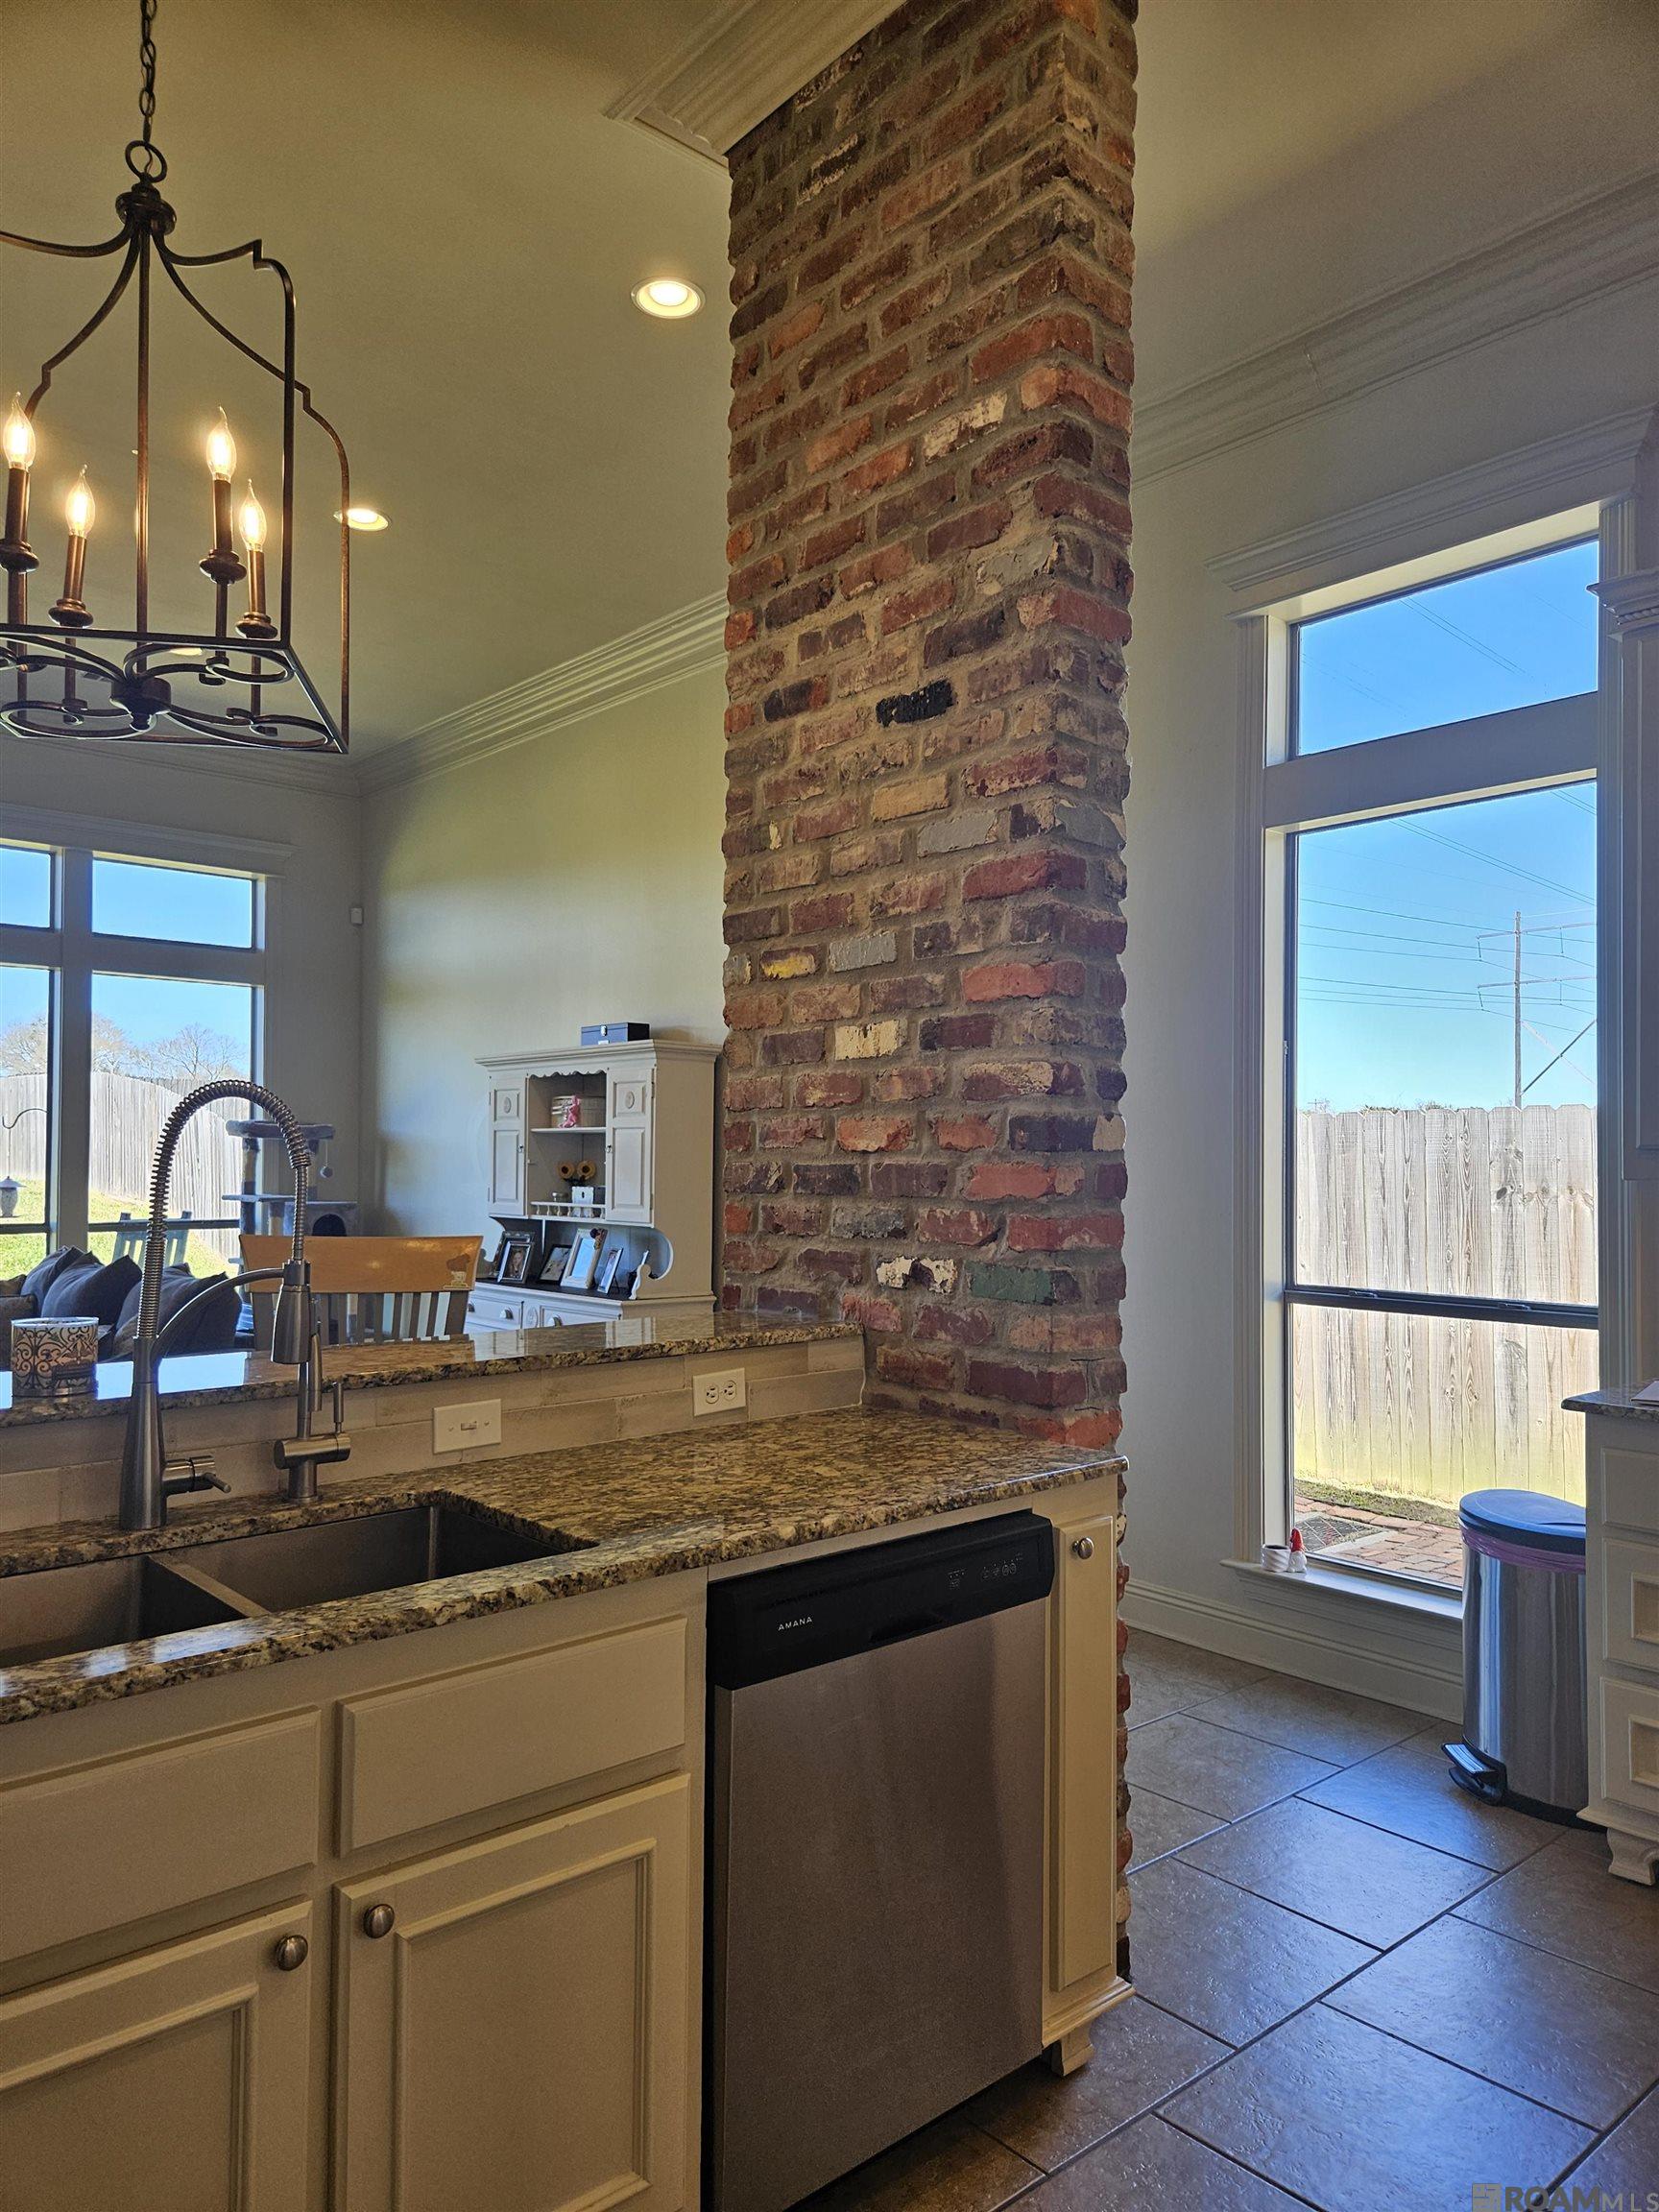
Active
$130,000
2
bds
|
3
ba
|
1,186
sqft
|
built
1983
4456 Stumberg Ln, Baton Rouge, LA 70816
$136
Cash flow
5.5%
Cash-on-Cash Return
6.9%
Cap rate
1.1%
Rent to Value Ratio

Active
$269,000
4
bds
|
3
ba
|
2,406
sqft
|
built
1978
3014 Lancelot Dr, Baton Rouge, LA 70816
$97
Cash flow
1.9%
Cash-on-Cash Return
6.1%
Cap rate
0.7%
Rent to Value Ratio

Pending
$337,900
3
bds
|
2
ba
|
1,742
sqft
|
built
2015
3103 Cypress View Ln, Baton Rouge, LA 70810
$51
Cash flow
0.8%
Cash-on-Cash Return
5.9%
Cap rate
0.7%
Rent to Value Ratio

Active
$239,500
3
bds
|
2
ba
|
2,090
sqft
|
built
1963
388 Wingate Dr, Baton Rouge, LA 70815
$109
Cash flow
2.4%
Cash-on-Cash Return
6.2%
Cap rate
0.8%
Rent to Value Ratio
Active
$449,000
4
bds
|
3
ba
|
2,440
sqft
|
built
2006
8926 Fox Gate Dr, Baton Rouge, LA 70809
$-11
Cash flow
-0.1%
Cash-on-Cash Return
5.6%
Cap rate
0.7%
Rent to Value Ratio
Active
$208,000
4
bds
|
3
ba
|
2,738
sqft
|
built
1977
14138 Pinehurst Ave, Baton Rouge, LA 70817
$323
Cash flow
8.1%
Cash-on-Cash Return
7.5%
Cap rate
0.9%
Rent to Value Ratio
Active
$339,900
4
bds
|
3
ba
|
2,874
sqft
|
built
1977
12679 E Sheraton Ave, Baton Rouge, LA 70815
$116
Cash flow
1.8%
Cash-on-Cash Return
6.1%
Cap rate
0.7%
Rent to Value Ratio

Active
$265,000
3
bds
|
2
ba
|
1,736
sqft
|
built
1979
14072 Pinehurst Ave, Baton Rouge, LA 70817
$-35
Cash flow
-0.7%
Cash-on-Cash Return
5.5%
Cap rate
0.7%
Rent to Value Ratio
Active
$235,000
3
bds
|
2
ba
|
2,035
sqft
|
built
1981
11435 Robin Hood Dr, Baton Rouge, LA 70815
$130
Cash flow
2.9%
Cash-on-Cash Return
6.3%
Cap rate
0.8%
Rent to Value Ratio

Active
$235,000
3
bds
|
2
ba
|
1,571
sqft
|
built
1960
3265 Charlotte Dr, Baton Rouge, LA 70814
$-146
Cash flow
-3.2%
Cash-on-Cash Return
4.9%
Cap rate
0.6%
Rent to Value Ratio

Active
$399,999
4
bds
|
4
ba
|
3,051
sqft
|
built
1961
4056 Drusilla Dr, Baton Rouge, LA 70809
$39
Cash flow
0.5%
Cash-on-Cash Return
5.8%
Cap rate
0.7%
Rent to Value Ratio

Pending
$274,500
3
bds
|
2
ba
|
1,617
sqft
|
built
2005
5617 Hidden Ridge Ln, Baton Rouge, LA 70816
$-70
Cash flow
-1.3%
Cash-on-Cash Return
5.4%
Cap rate
0.7%
Rent to Value Ratio
Active
$210,000
3
bds
|
2
ba
|
1,450
sqft
|
built
1974
16631 Abshire Ave, Baton Rouge, LA 70816
$110
Cash flow
2.7%
Cash-on-Cash Return
6.3%
Cap rate
0.8%
Rent to Value Ratio
Active
$169,900
3
bds
|
2
ba
|
1,400
sqft
|
built
1980
5354 Linden St, Baton Rouge, LA 70805
$-45
Cash flow
-1.4%
Cash-on-Cash Return
5.4%
Cap rate
0.6%
Rent to Value Ratio
Active
$180,000
bds
|
0
ba
|
2,382
sqft
|
built
1984
824 E Polk St, Baton Rouge, LA 70802
$-162
Cash flow
-4.7%
Cash-on-Cash Return
4.6%
Cap rate
0.6%
Rent to Value Ratio

Active
$174,000
3
bds
|
3
ba
|
1,780
sqft
|
built
1989
5205 Heatherstone Dr, Baton Rouge, LA 70820
$163
Cash flow
4.9%
Cash-on-Cash Return
6.8%
Cap rate
1.0%
Rent to Value Ratio
Active
$377,000
4
bds
|
2
ba
|
2,368
sqft
|
built
1954
270 Croydon Ave, Baton Rouge, LA 70806
$148
Cash flow
2.0%
Cash-on-Cash Return
6.1%
Cap rate
0.7%
Rent to Value Ratio
Active
$289,000
3
bds
|
2
ba
|
1,642
sqft
|
built
1979
10052 Mint Dr, Baton Rouge, LA 70809
$12
Cash flow
0.2%
Cash-on-Cash Return
5.7%
Cap rate
0.7%
Rent to Value Ratio
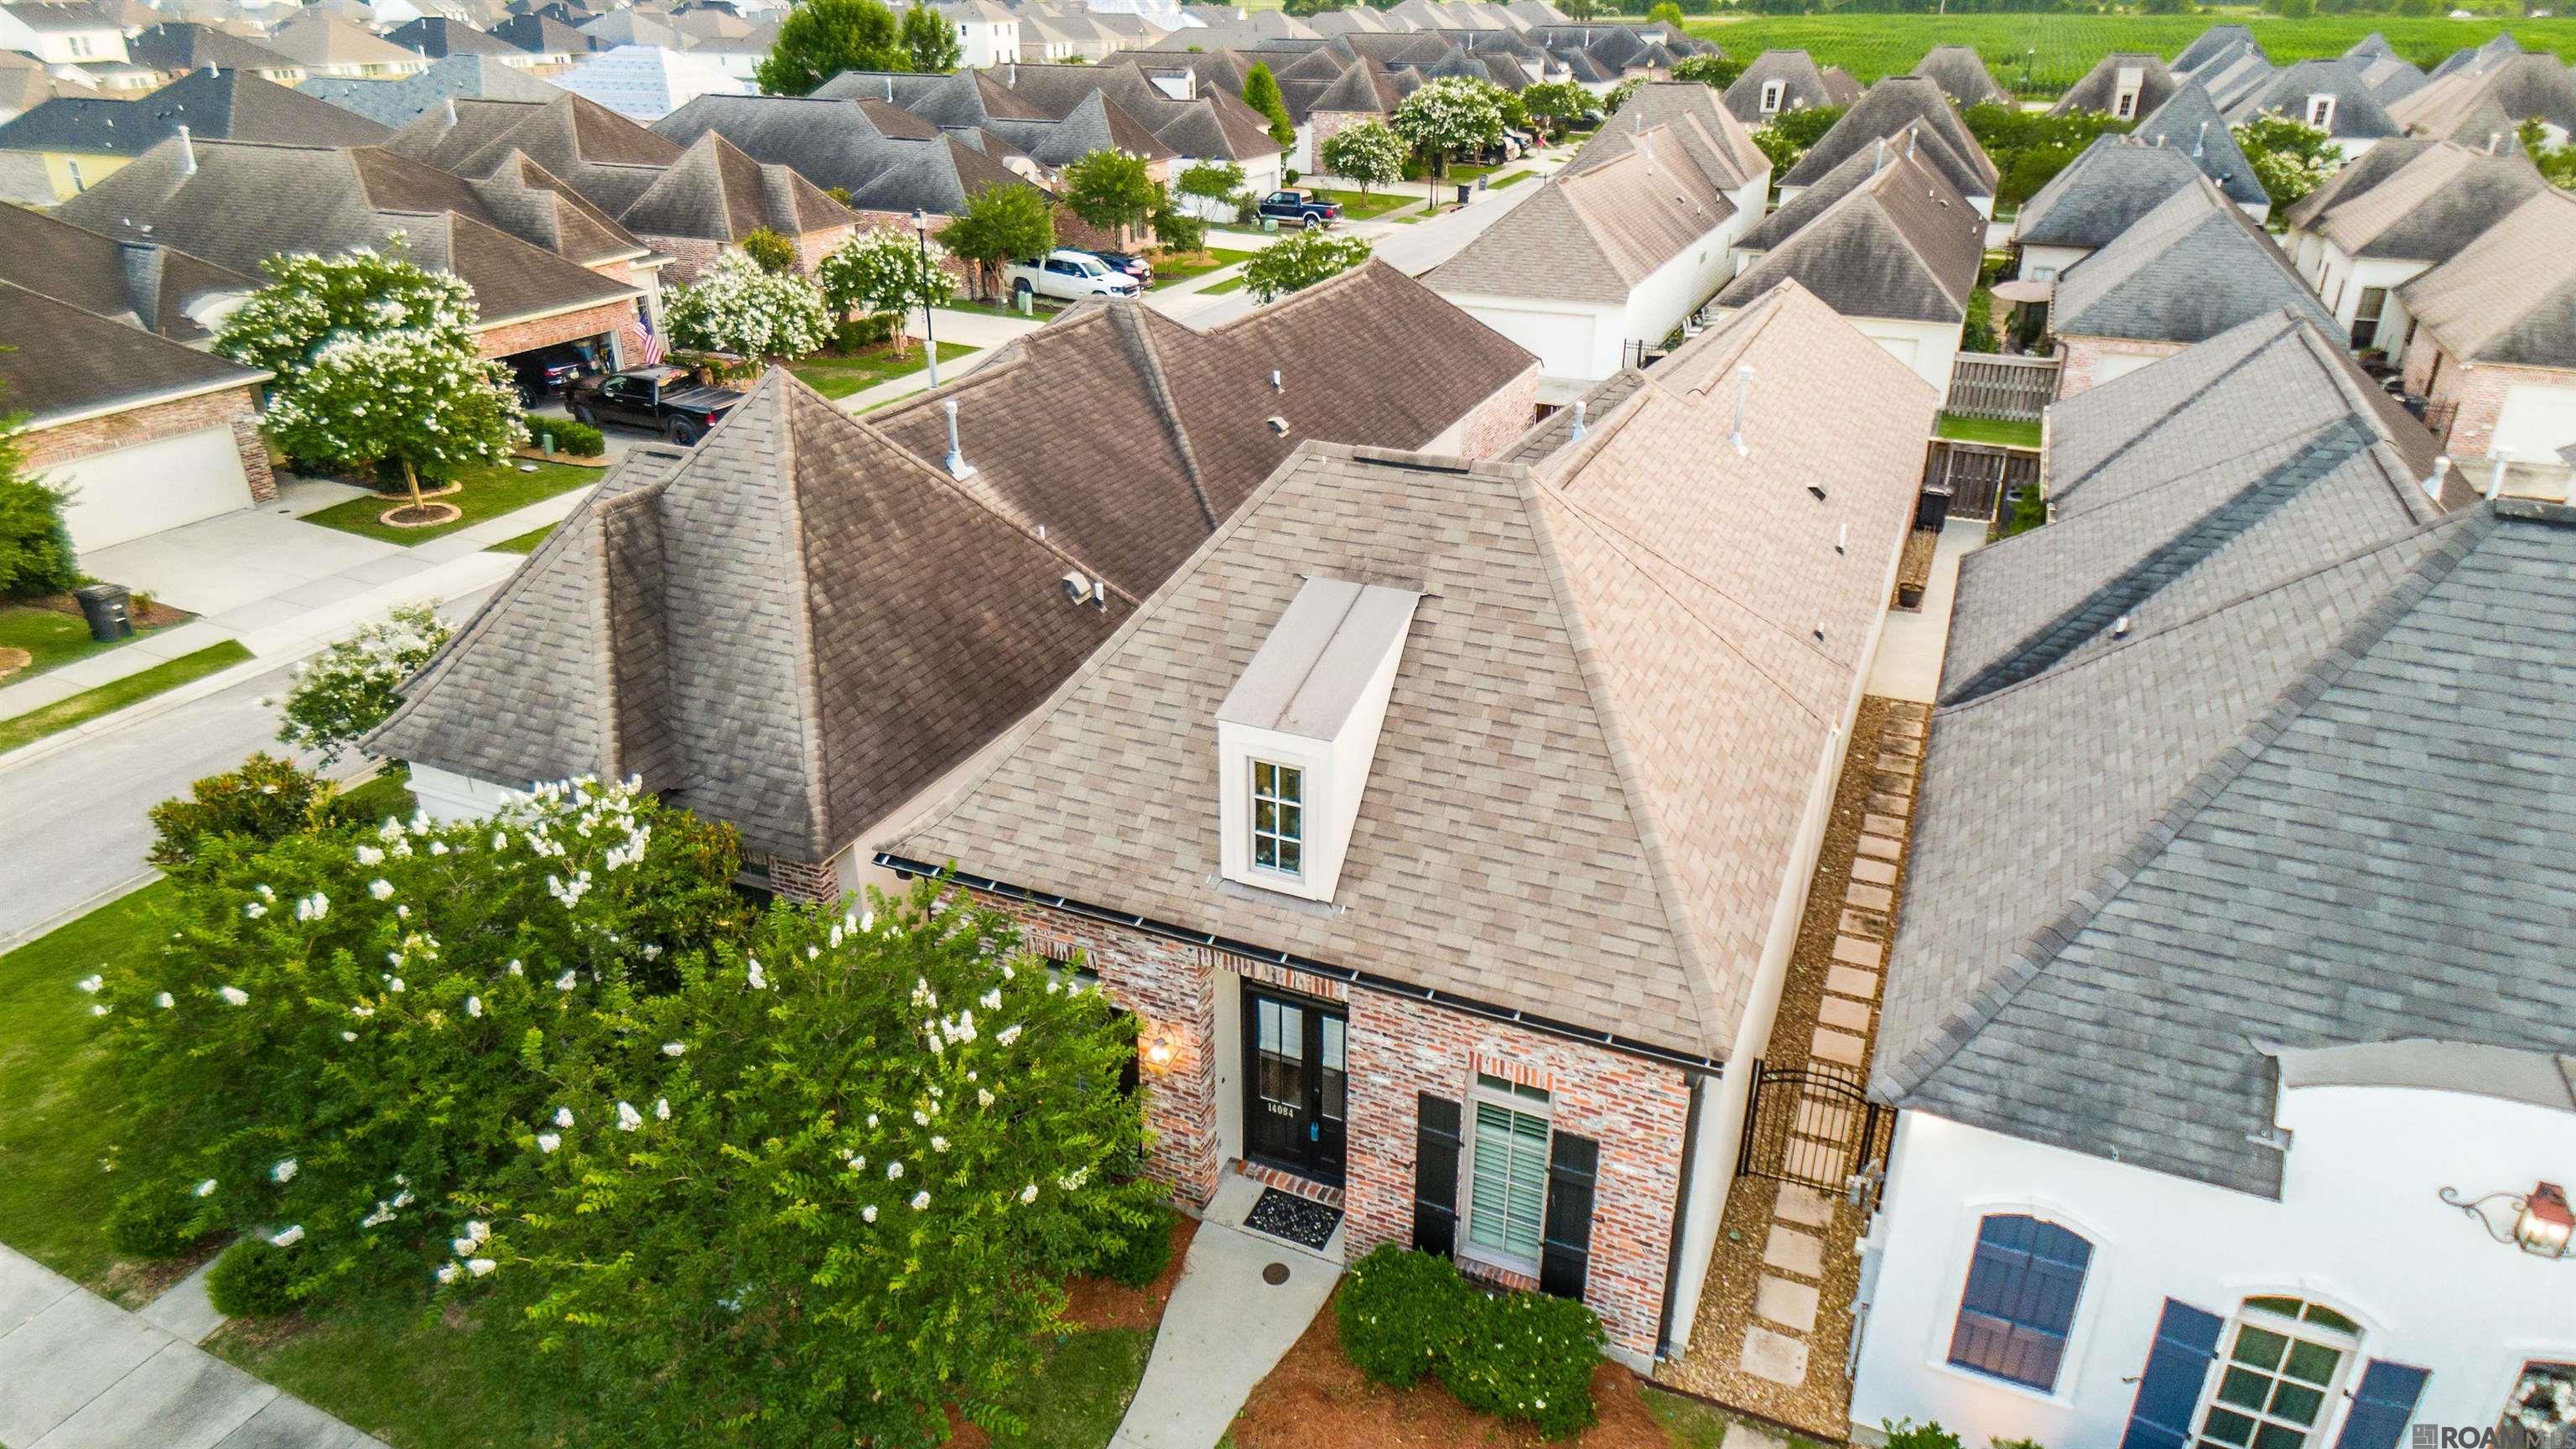
Active
$334,000
3
bds
|
2
ba
|
1,775
sqft
|
built
2017
14084 Wetherly Dr, Baton Rouge, LA 70810
$69
Cash flow
1.1%
Cash-on-Cash Return
5.9%
Cap rate
0.7%
Rent to Value Ratio
Active
$220,000
3
bds
|
2
ba
|
1,601
sqft
|
built
1978
16828 Bristoe Ave, Baton Rouge, LA 70816
$63
Cash flow
1.5%
Cash-on-Cash Return
6.0%
Cap rate
0.7%
Rent to Value Ratio
Active
$189,000
4
bds
|
3
ba
|
2,078
sqft
|
built
1990
6221 Lotus St, Baton Rouge, LA 70812
$348
Cash flow
9.6%
Cash-on-Cash Return
7.9%
Cap rate
1.0%
Rent to Value Ratio
Active
$624,900
3
bds
|
3
ba
|
2,351
sqft
|
built
1950
4112 Chatfield Ave, Baton Rouge, LA 70808
$-266
Cash flow
-2.2%
Cash-on-Cash Return
5.2%
Cap rate
0.6%
Rent to Value Ratio
Active
$423,899
bds
|
0
ba
|
4,000
sqft
|
built
1984
5407 Nicholson Dr, Baton Rouge, LA 70820
$-1,247
Cash flow
-15.3%
Cash-on-Cash Return
2.1%
Cap rate
0.3%
Rent to Value Ratio