Baton Rouge, LA Investment Properties for Sale
Browse homes for sale and investment properties in Baton Rouge, LA. Refine your search by price, property type, or more.
Best cash flowing properties in Baton Rouge, LA

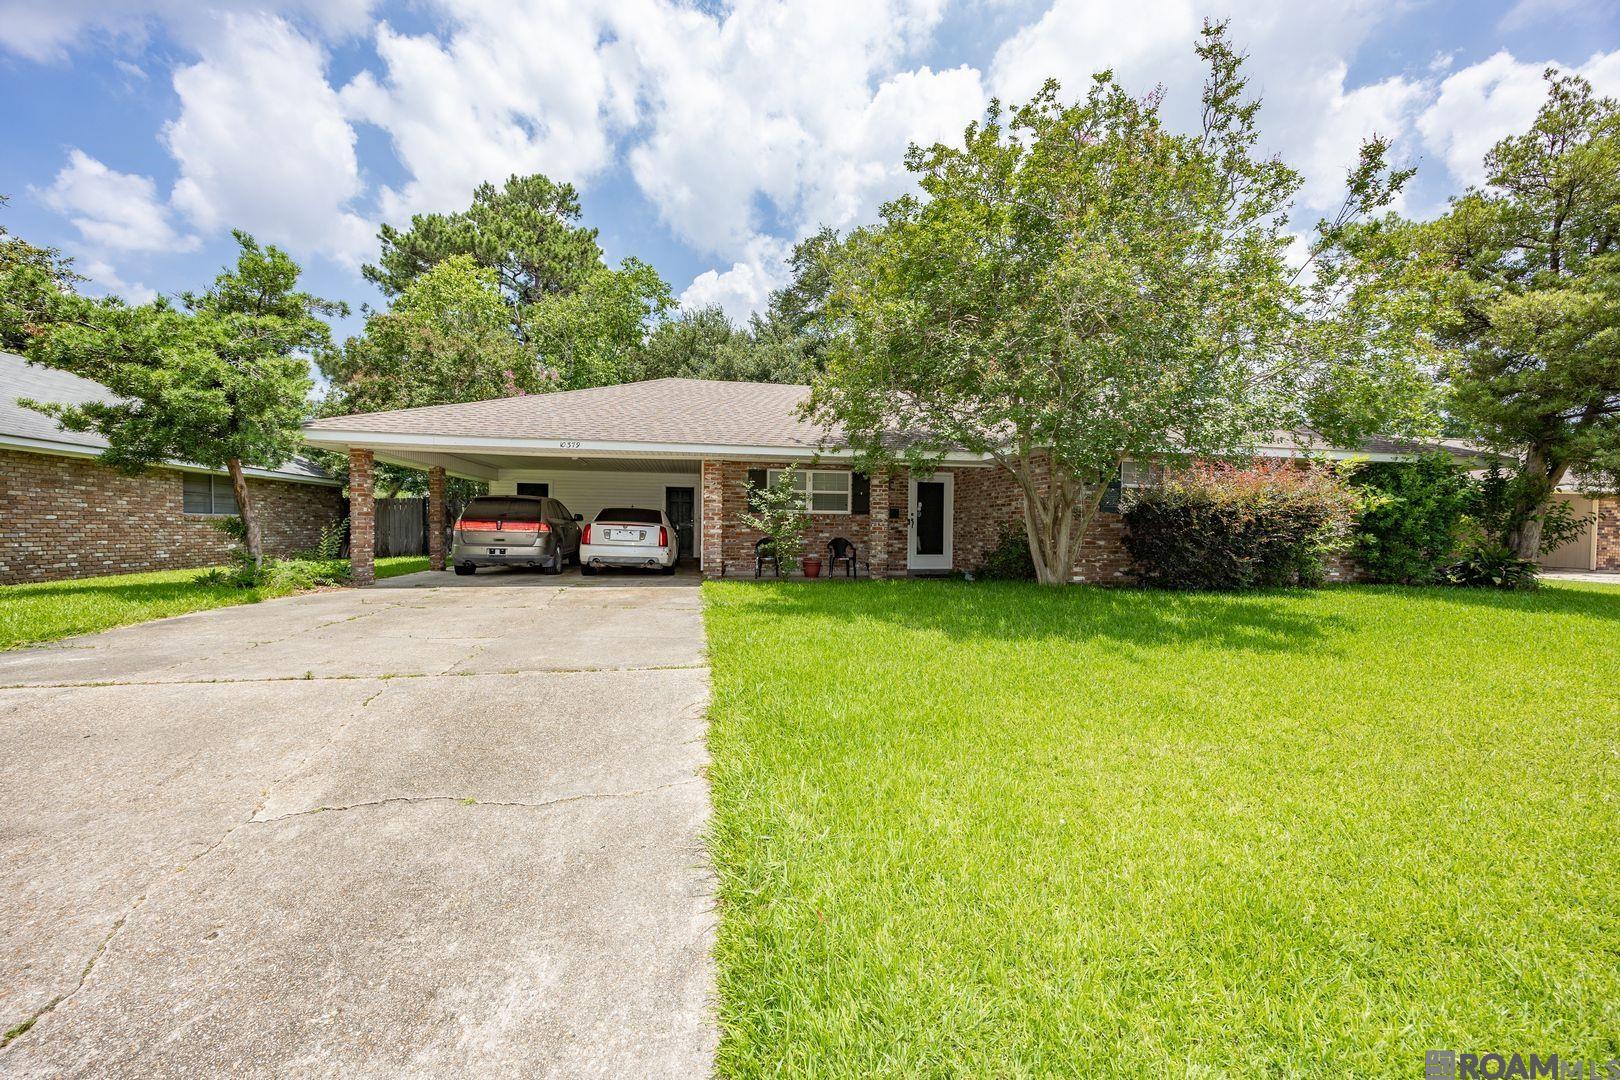
Active
$67,000
3
bds
|
1
ba
|
1,708
sqft
|
built
1975
3577 Greenway Dr, Baton Rouge, LA 70814
$1,242
Cash flow
21.6%
Cash-on-Cash Return
22.2%
Cap rate
2.7%
Rent to Value Ratio
Active
$64,900
3
bds
|
2
ba
|
1,676
sqft
|
built
1950
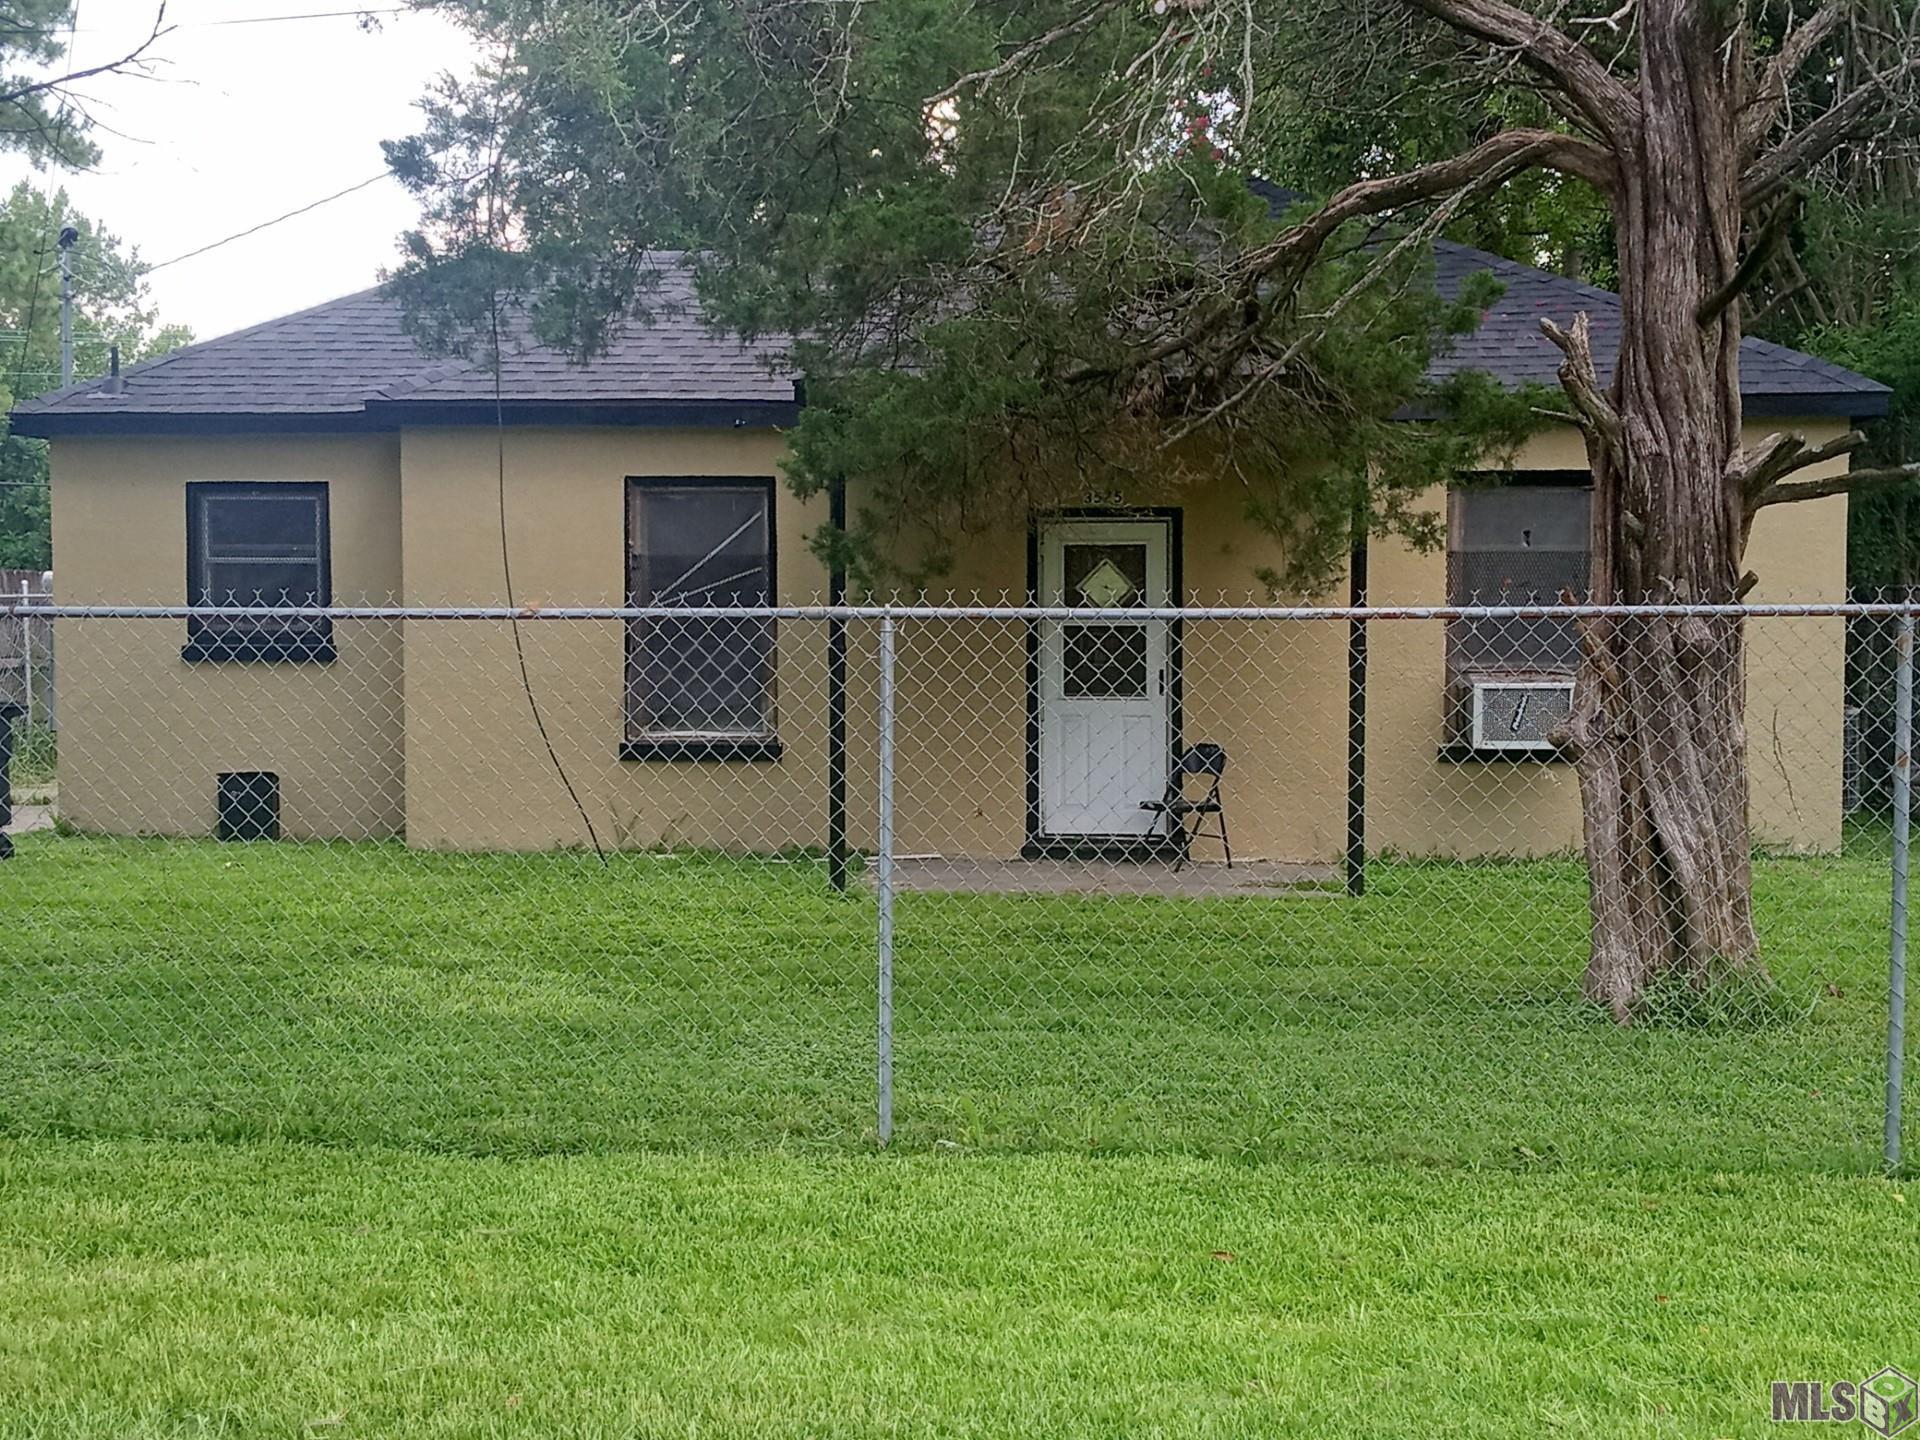
3525 Monroe Ave, Baton Rouge, LA 70802
$897
Cash flow
16.1%
Cash-on-Cash Return
16.6%
Cap rate
2.0%
Rent to Value Ratio
1,001 out of 1,290 properties for sale in Baton Rouge, LA
Limited Results Shown
Create a free account, or log in to reveal all property listings and enjoy the complete experience.
Active
$1,025,000
3
bds
|
3
ba
|
2,992
sqft
|
built
2023
11621 Willow Garden Ln, Baton Rouge, LA 70810
$-4,255
Cash flow
-21.7%
Cash-on-Cash Return
1.3%
Cap rate
0.2%
Rent to Value Ratio
Active
$239,000
3
bds
|
1
ba
|
1,378
sqft
|
built
1946
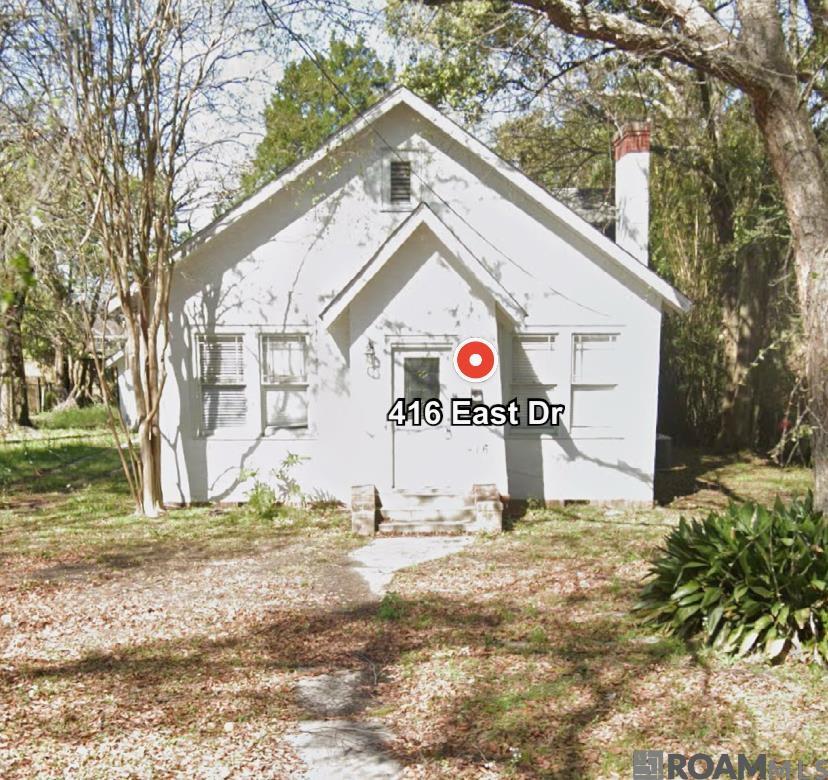
416 East Dr, Baton Rouge, LA 70806
$-148
Cash flow
-3.2%
Cash-on-Cash Return
5.5%
Cap rate
0.7%
Rent to Value Ratio
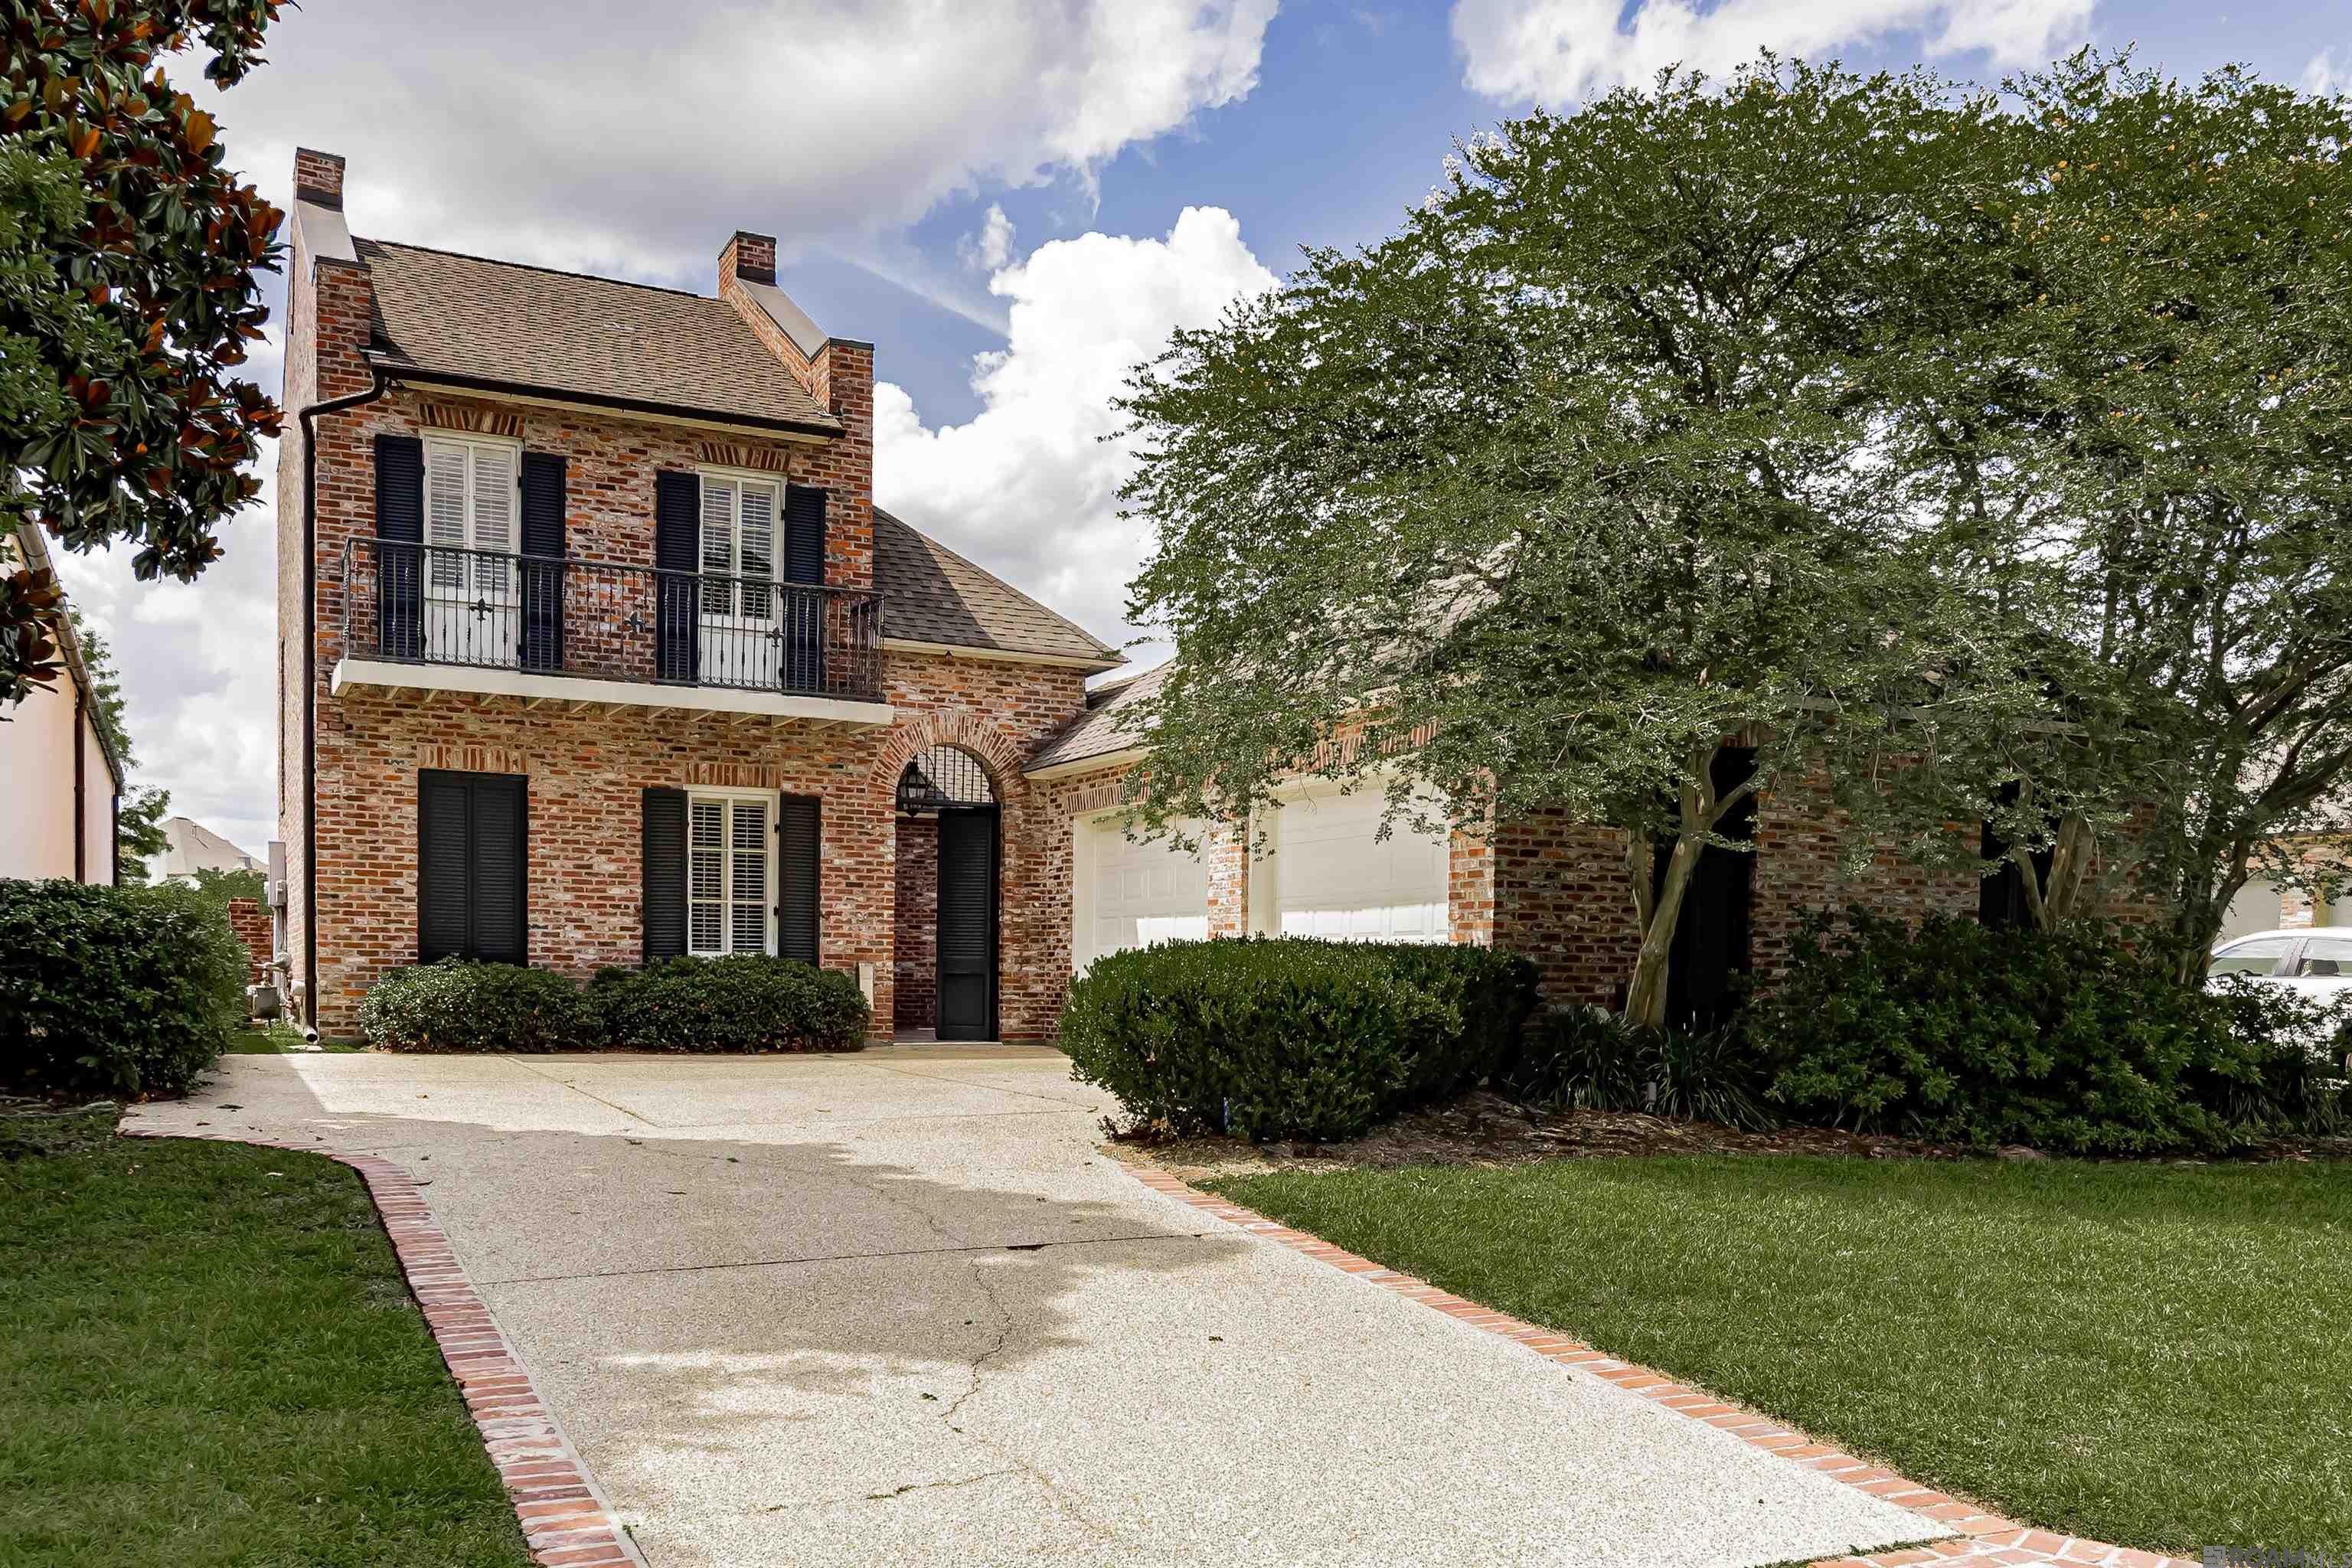
Active
$689,900
4
bds
|
3
ba
|
2,497
sqft
|
built
2021
9346 Inniswylde Dr, Baton Rouge, LA 70809
$-851
Cash flow
-6.4%
Cash-on-Cash Return
4.8%
Cap rate
0.6%
Rent to Value Ratio
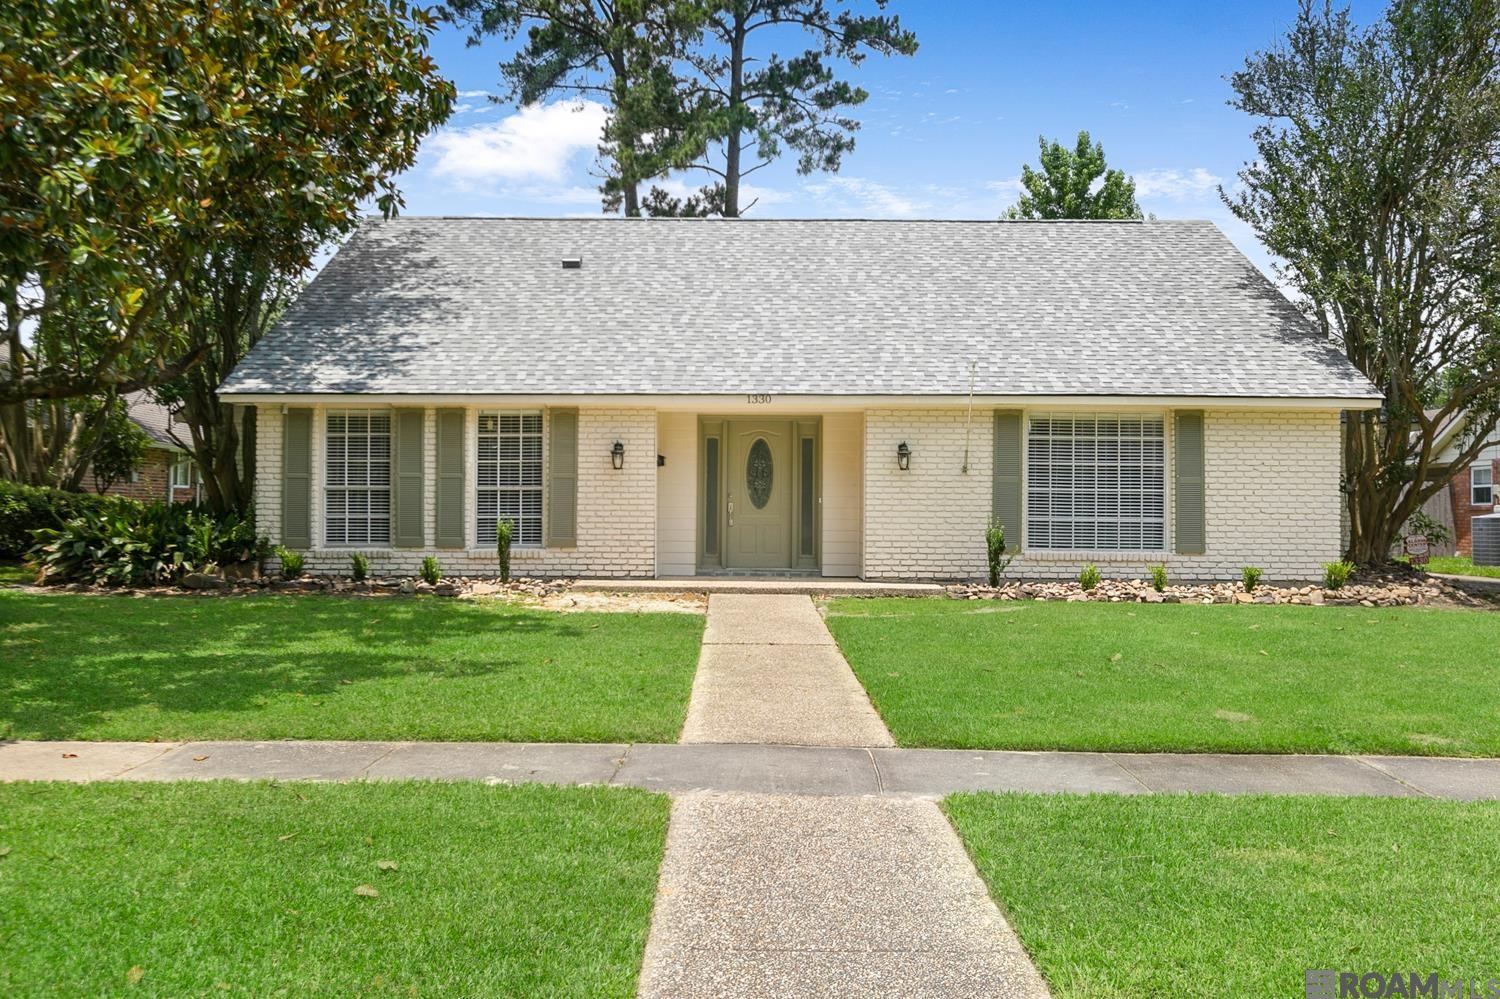
Active
$335,000
4
bds
|
3
ba
|
3,100
sqft
|
built
1971
1330 Woodcliff Dr, Baton Rouge, LA 70815
$40
Cash flow
0.6%
Cash-on-Cash Return
6.4%
Cap rate
0.8%
Rent to Value Ratio
Active
$530,000
3
bds
|
3
ba
|
2,600
sqft
|
built
1996
4613 Tupello St, Baton Rouge, LA 70808
$-843
Cash flow
-8.3%
Cash-on-Cash Return
4.4%
Cap rate
0.5%
Rent to Value Ratio

Active
$209,900
3
bds
|
2
ba
|
1,679
sqft
|
built
1968
343 Shadydale Dr, Baton Rouge, LA 70815
$5
Cash flow
0.1%
Cash-on-Cash Return
6.3%
Cap rate
0.8%
Rent to Value Ratio
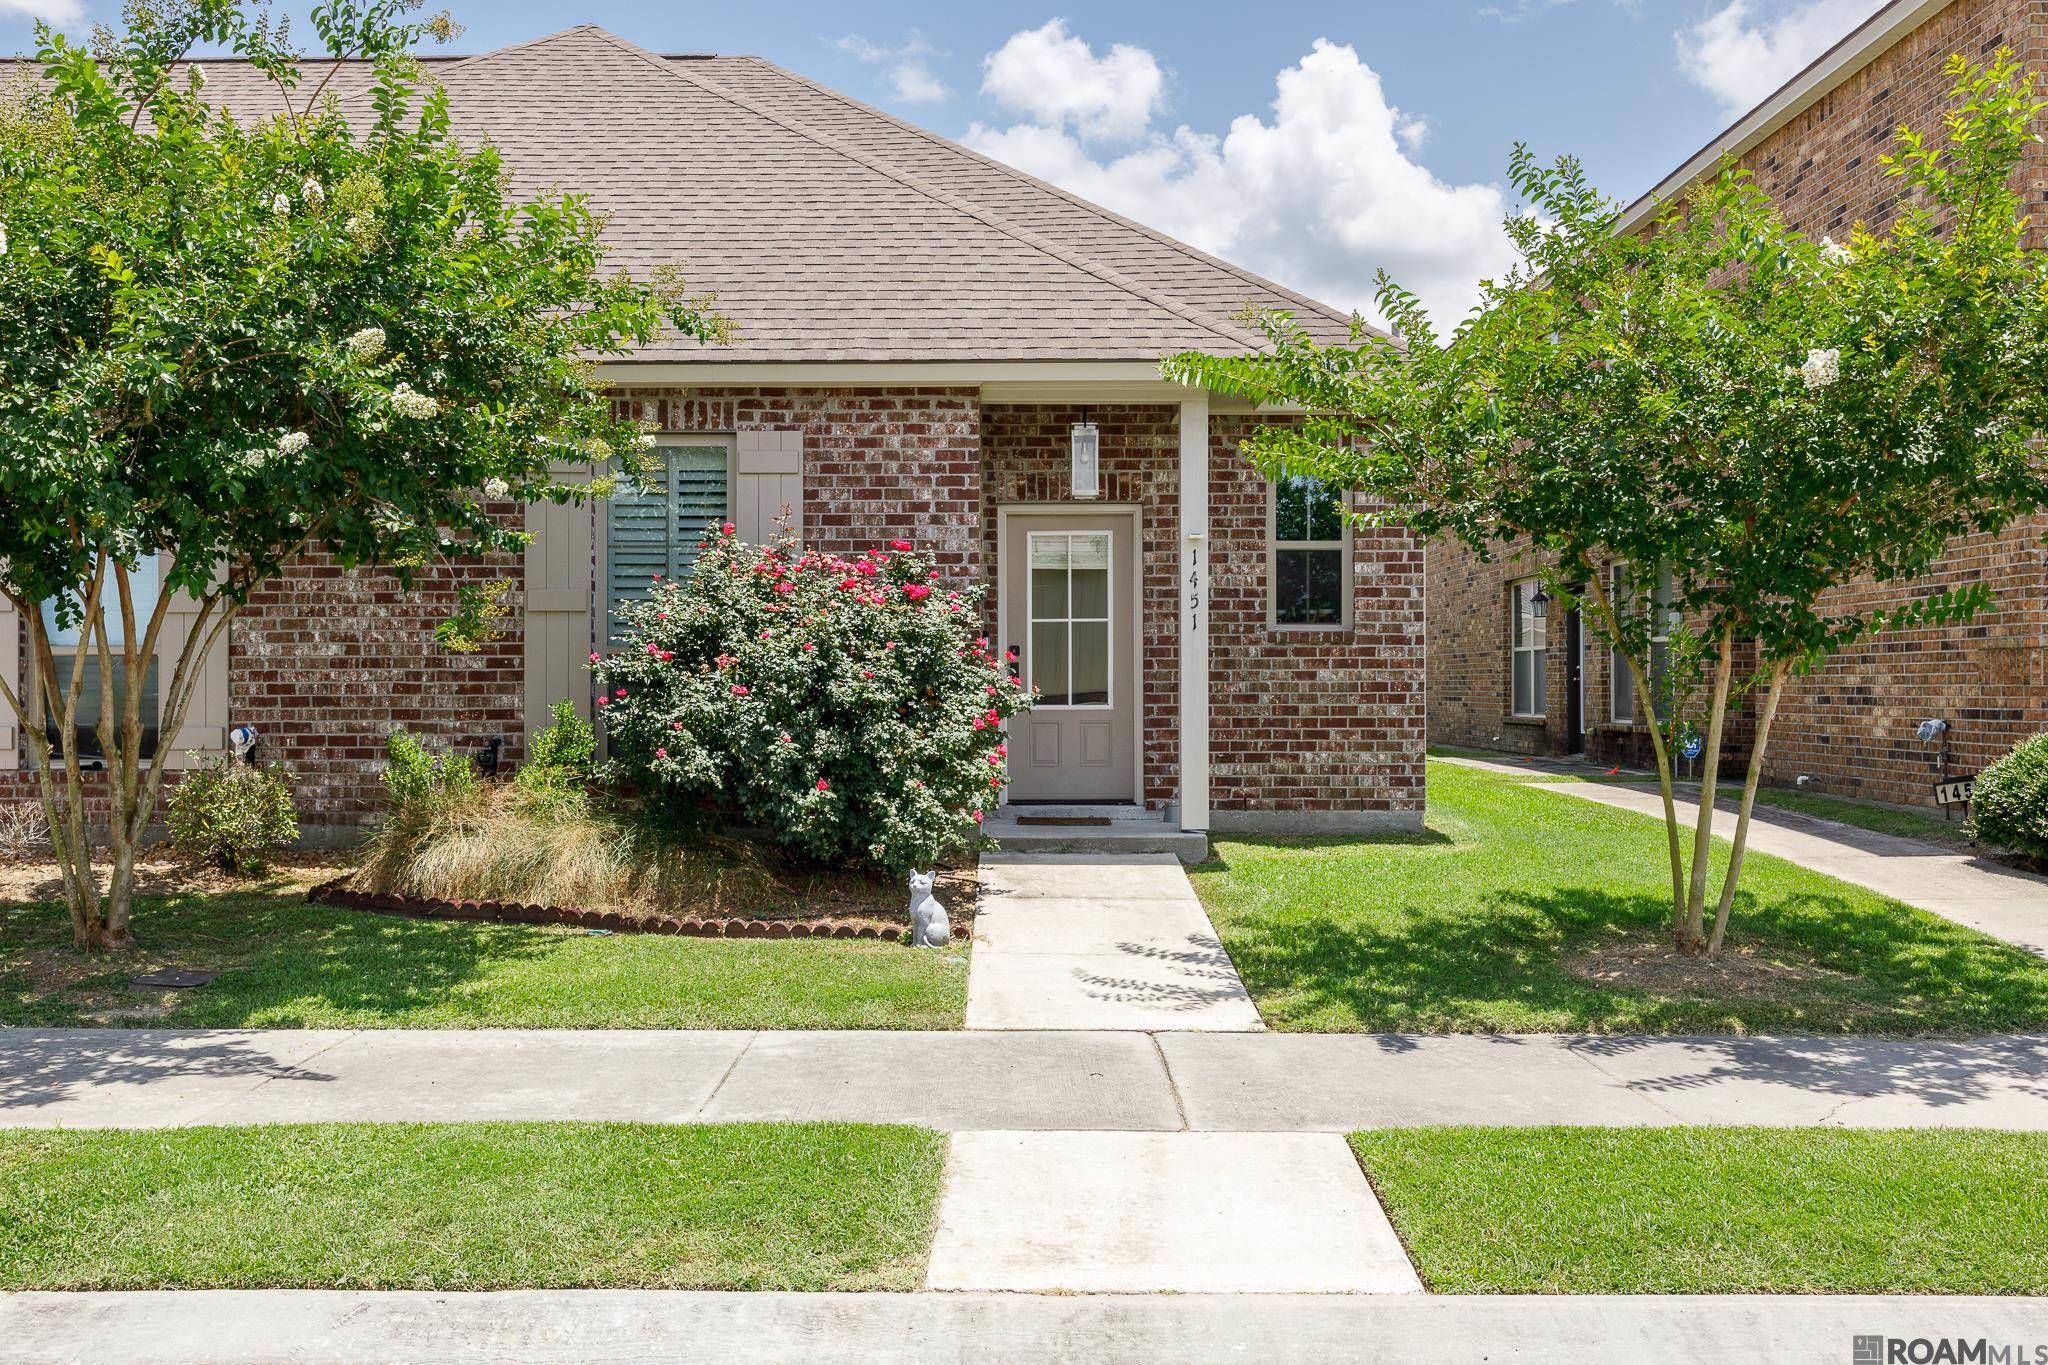
Active
$220,000
2
bds
|
2
ba
|
1,065
sqft
|
built
2019
1451 Pelican Club Dr, Baton Rouge, LA 70820
$-197
Cash flow
-4.7%
Cash-on-Cash Return
5.2%
Cap rate
0.7%
Rent to Value Ratio
Active
$1,575,000
5
bds
|
4
ba
|
4,412
sqft
|
built
1988
18321 N Mission Hills Ave, Baton Rouge, LA 70810
$-3,677
Cash flow
-12.2%
Cash-on-Cash Return
3.5%
Cap rate
0.4%
Rent to Value Ratio
Active
$255,000
2
bds
|
2
ba
|
1,225
sqft
|
built
1905
355 Napoleon St, Baton Rouge, LA 70802
$-24
Cash flow
-0.5%
Cash-on-Cash Return
6.2%
Cap rate
0.7%
Rent to Value Ratio
Active
$335,000
3
bds
|
3
ba
|
2,274
sqft
|
built
1981
8455 Thurman Dr, Baton Rouge, LA 70806
$-374
Cash flow
-5.8%
Cash-on-Cash Return
4.9%
Cap rate
0.6%
Rent to Value Ratio
Active
$660,000
3
bds
|
3
ba
|
2,288
sqft
|
built
2009
8144 Willow Grove Blvd, Baton Rouge, LA 70810
$-890
Cash flow
-7.0%
Cash-on-Cash Return
4.7%
Cap rate
0.6%
Rent to Value Ratio

Active
$225,000
3
bds
|
2
ba
|
1,560
sqft
|
built
1977
13623 Red River Ave, Baton Rouge, LA 70818
$64
Cash flow
1.5%
Cash-on-Cash Return
6.6%
Cap rate
0.8%
Rent to Value Ratio
Pending
$75,000
3
bds
|
2
ba
|
1,434
sqft
|
built
1978
3869 Greenway Dr, Baton Rouge, LA 70814
$366
Cash flow
25.5%
Cash-on-Cash Return
12.1%
Cap rate
1.5%
Rent to Value Ratio
Active
$90,000
3
bds
|
2
ba
|
1,300
sqft
|
built
1950
4837 Crown Ave, Baton Rouge, LA 70811
$495
Cash flow
28.7%
Cash-on-Cash Return
12.9%
Cap rate
1.6%
Rent to Value Ratio
Active
$243,000
3
bds
|
2
ba
|
1,530
sqft
|
built
1981
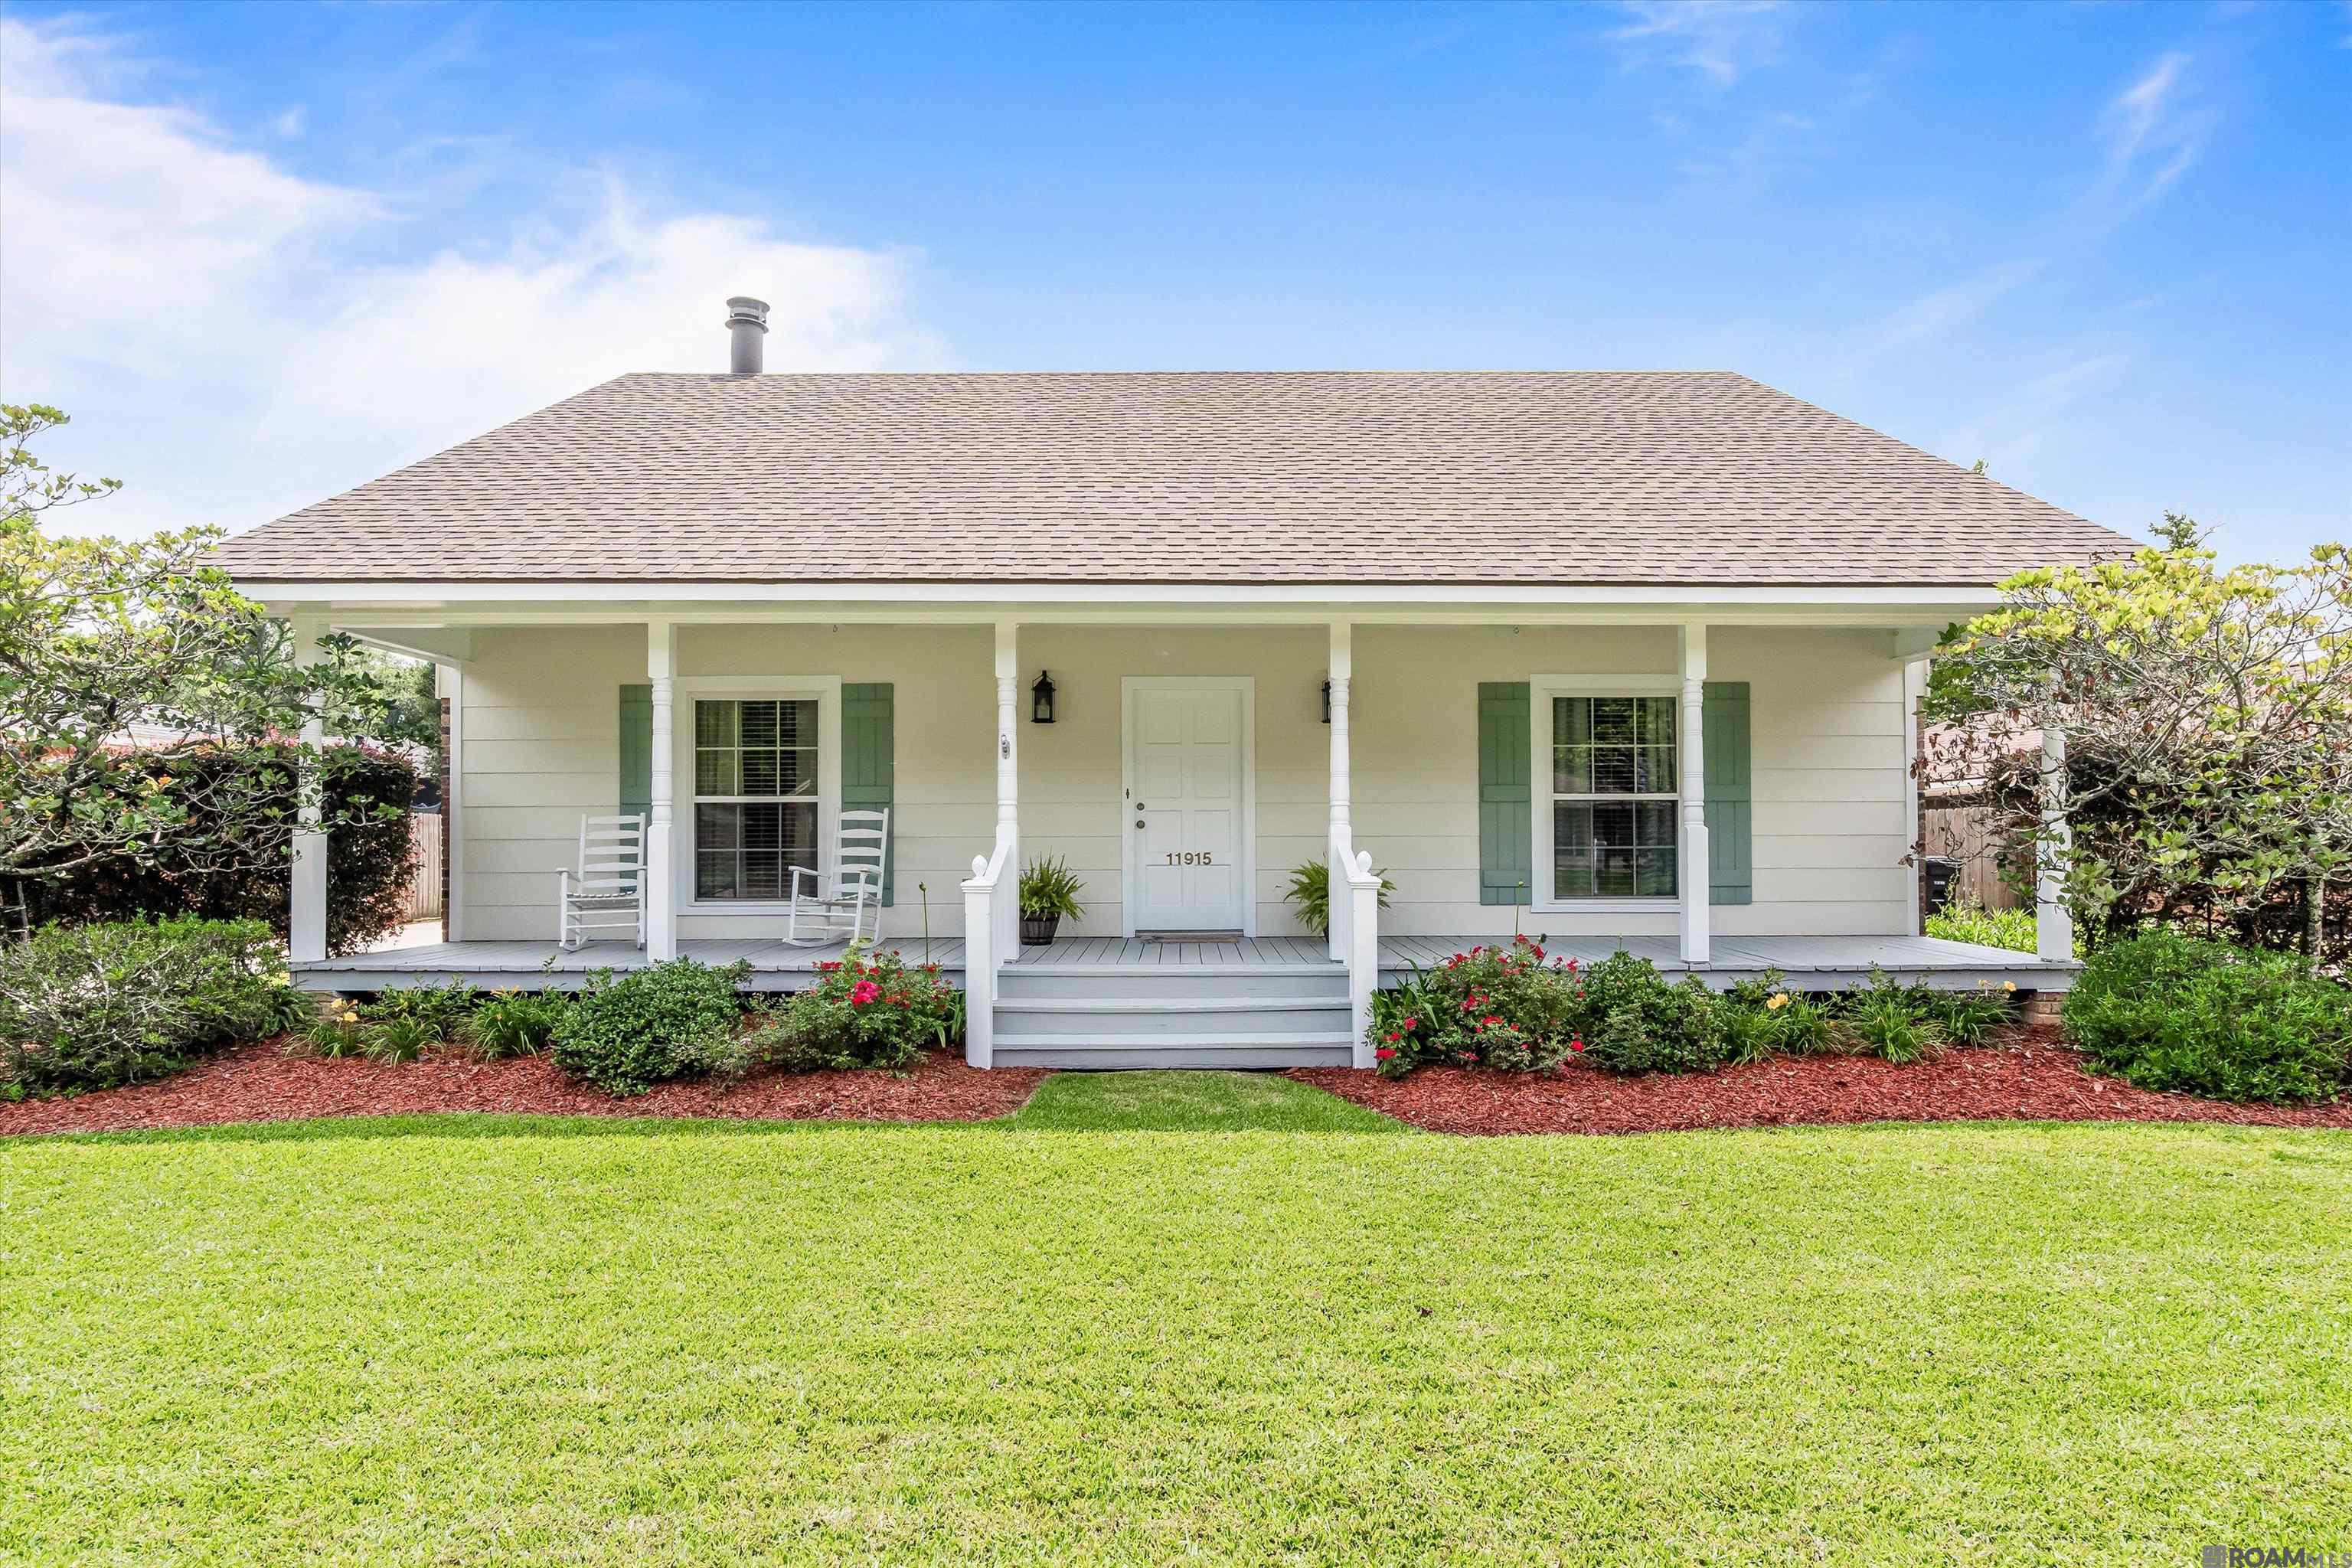
11915 Sage Dr, Baton Rouge, LA 70818
$-31
Cash flow
-0.7%
Cash-on-Cash Return
6.1%
Cap rate
0.7%
Rent to Value Ratio
Active
$225,000
3
bds
|
3
ba
|
1,558
sqft
|
built
2004
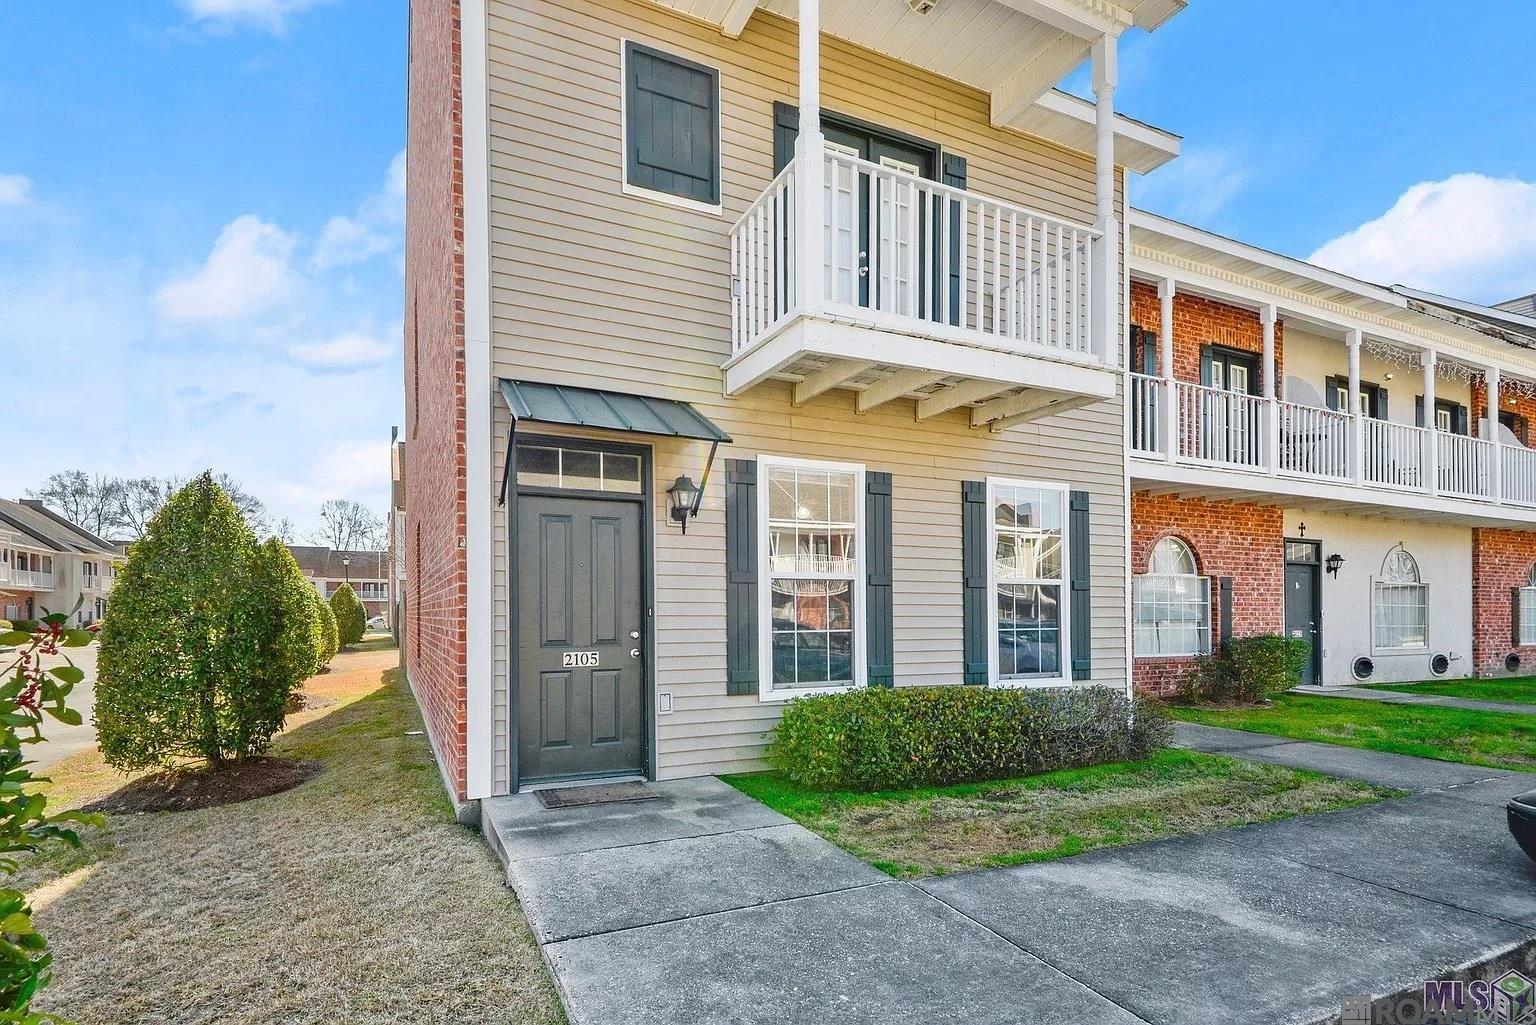
2105 Belle Point Aly, Baton Rouge, LA 70820
$-11
Cash flow
-0.3%
Cash-on-Cash Return
6.2%
Cap rate
0.8%
Rent to Value Ratio
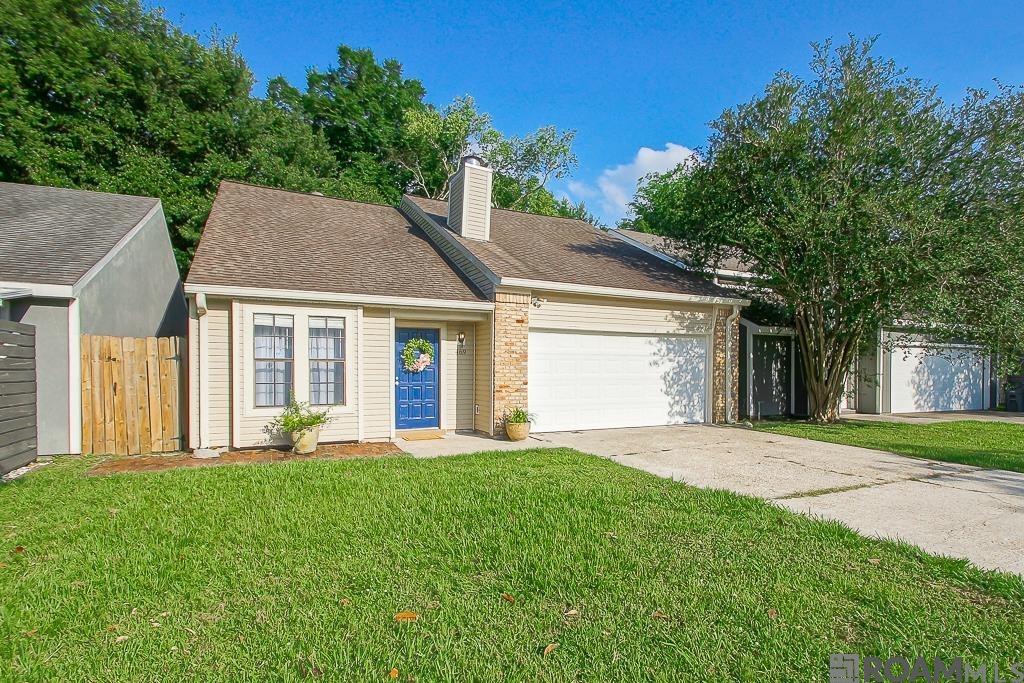
Active
$180,000
3
bds
|
2
ba
|
1,372
sqft
|
built
1957
10322 Lebanon St, Baton Rouge, LA 70816
$161
Cash flow
4.7%
Cash-on-Cash Return
7.4%
Cap rate
0.9%
Rent to Value Ratio
Active
$639,000
3
bds
|
3
ba
|
2,776
sqft
|
built
2006
2924 Rue D Orleans, Baton Rouge, LA 70810
$-734
Cash flow
-6.0%
Cash-on-Cash Return
4.9%
Cap rate
0.6%
Rent to Value Ratio
Active
$196,000
3
bds
|
2
ba
|
1,428
sqft
|
built
1980
469 Highland Creek Pkwy, Baton Rouge, LA 70808
$78
Cash flow
2.1%
Cash-on-Cash Return
6.8%
Cap rate
0.8%
Rent to Value Ratio
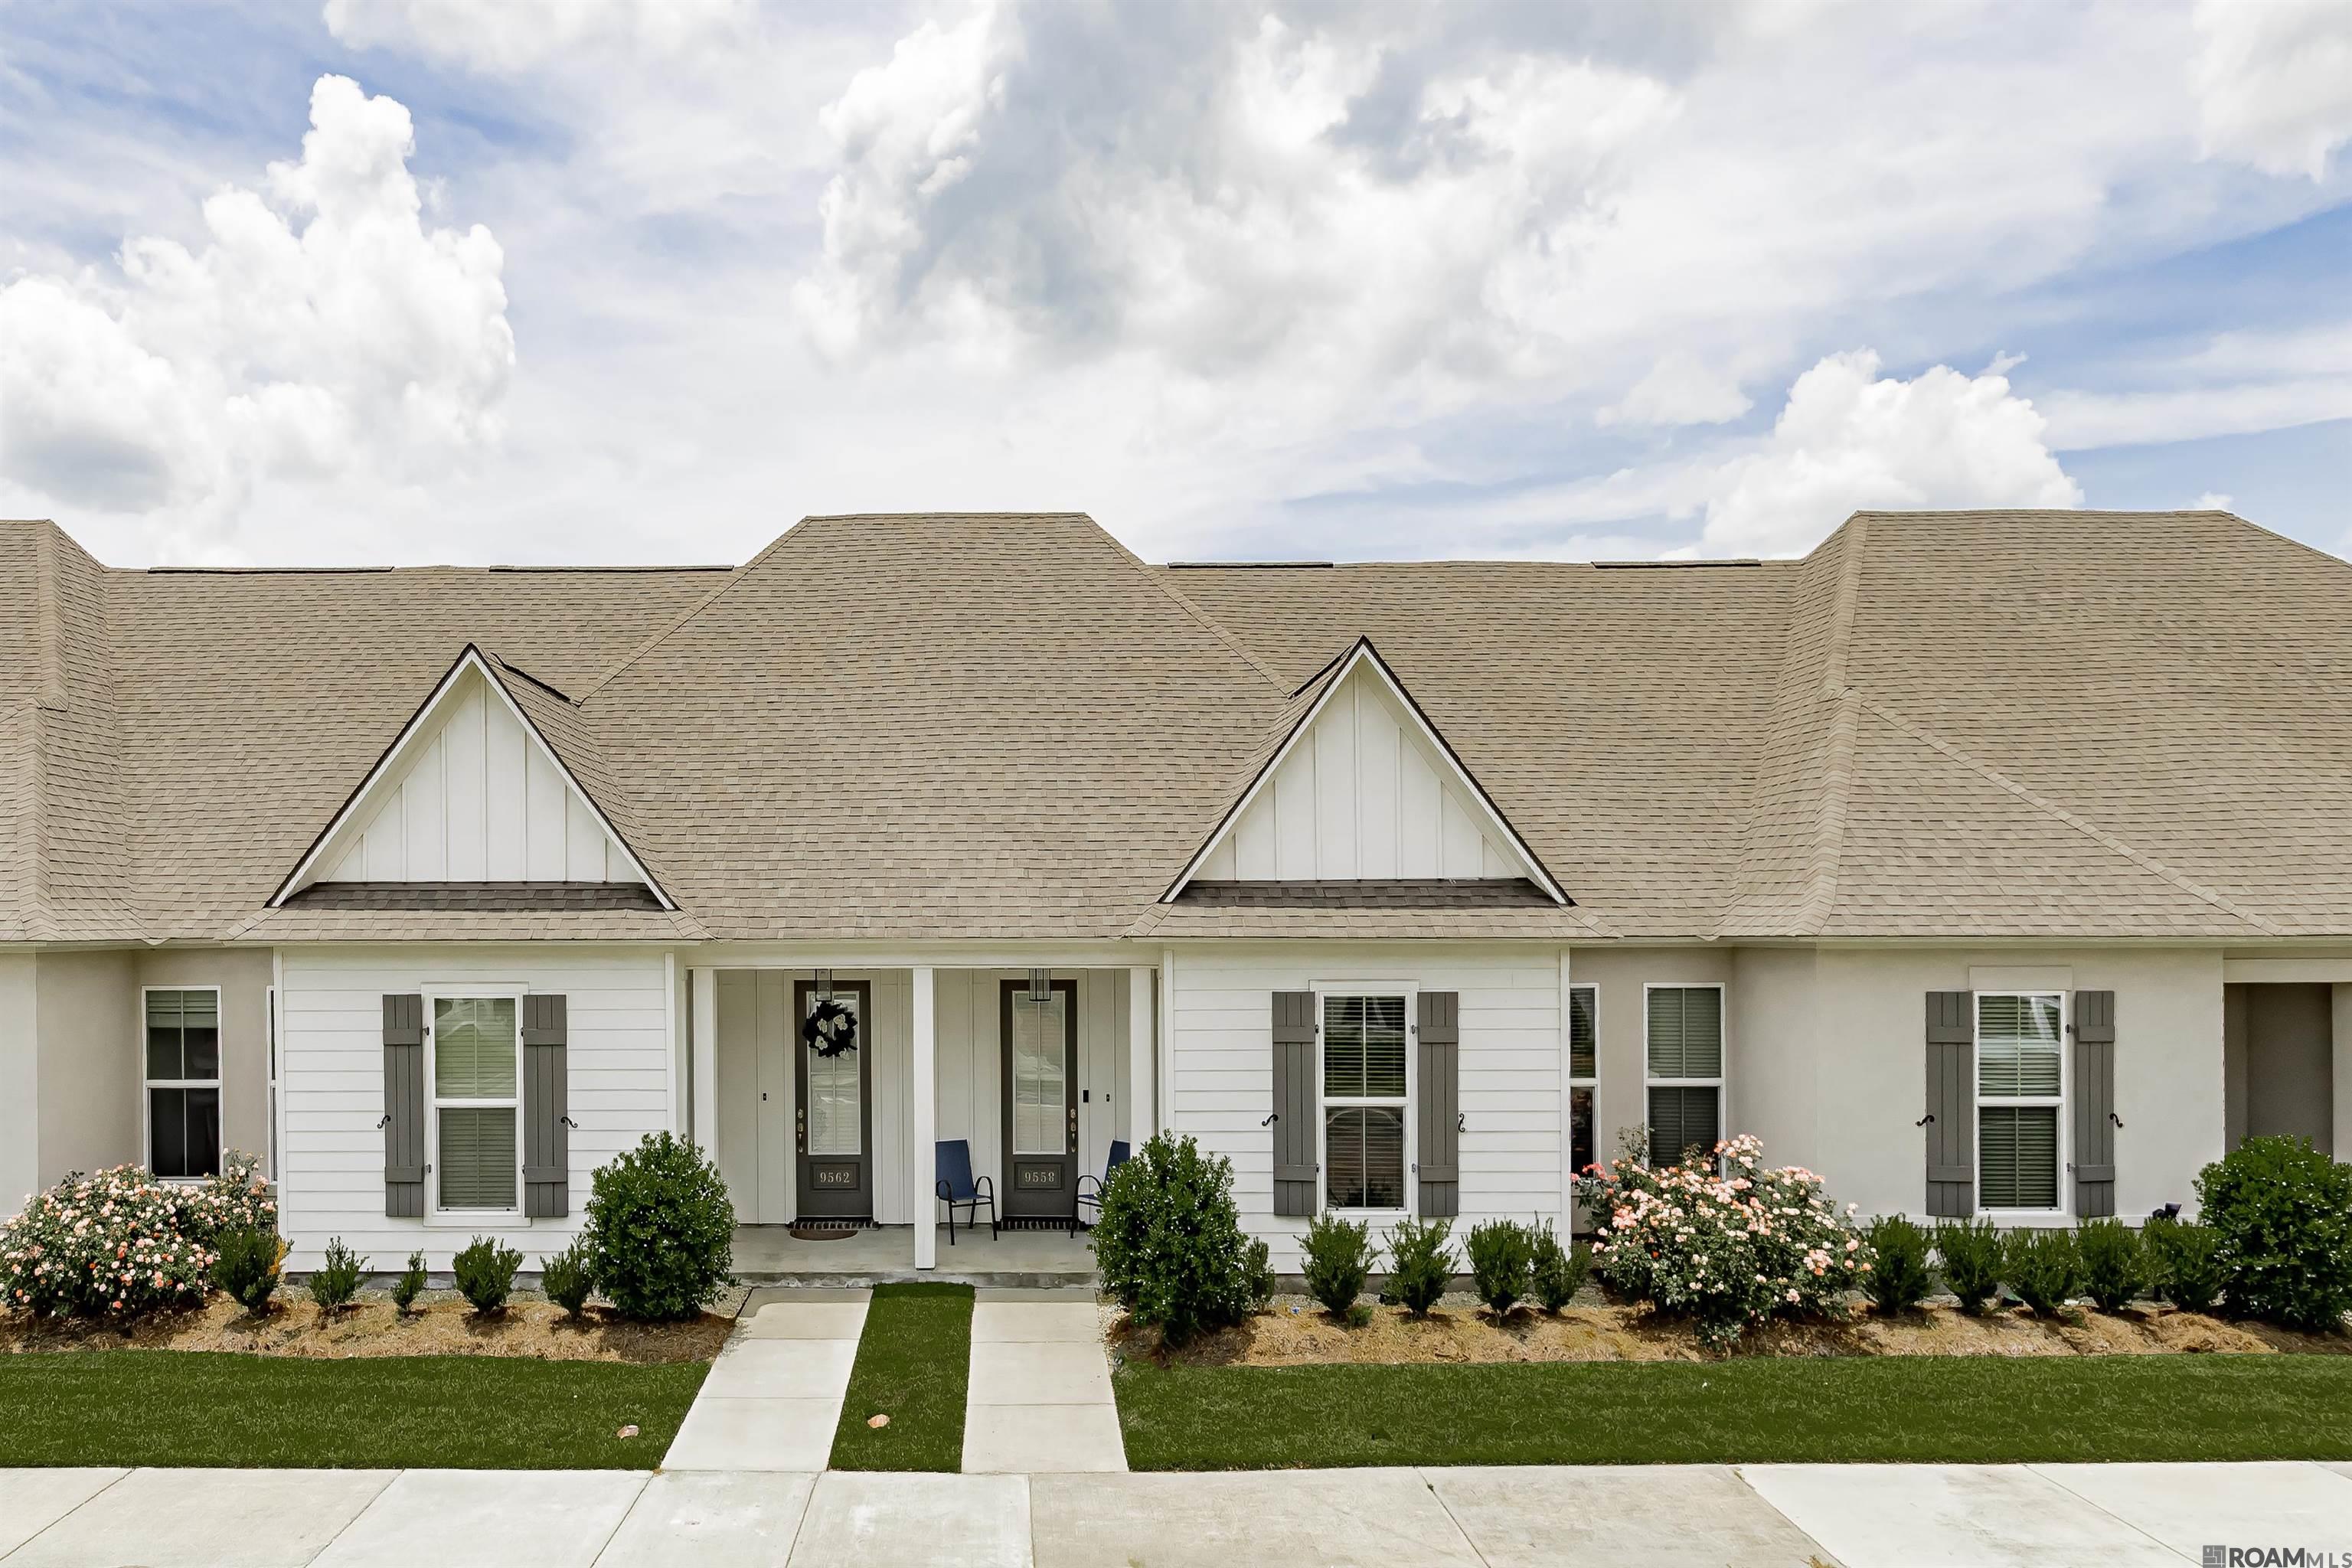
Active
$339,500
3
bds
|
2
ba
|
1,625
sqft
|
built
2022
9558 Creekview Dr, Baton Rouge, LA 70836
$-957
Cash flow
-14.7%
Cash-on-Cash Return
2.9%
Cap rate
0.4%
Rent to Value Ratio
Active
$675,000
4
bds
|
3
ba
|
3,279
sqft
|
built
1993
121 University Highlands Ct, Baton Rouge, LA 70808
$-527
Cash flow
-4.1%
Cash-on-Cash Return
5.3%
Cap rate
0.7%
Rent to Value Ratio
Active
$250,000
4
bds
|
2
ba
|
2,054
sqft
|
built
1978
10379 Cinquefoil Ave, Baton Rouge, LA 70816
$-67
Cash flow
-1.4%
Cash-on-Cash Return
6.0%
Cap rate
0.7%
Rent to Value Ratio
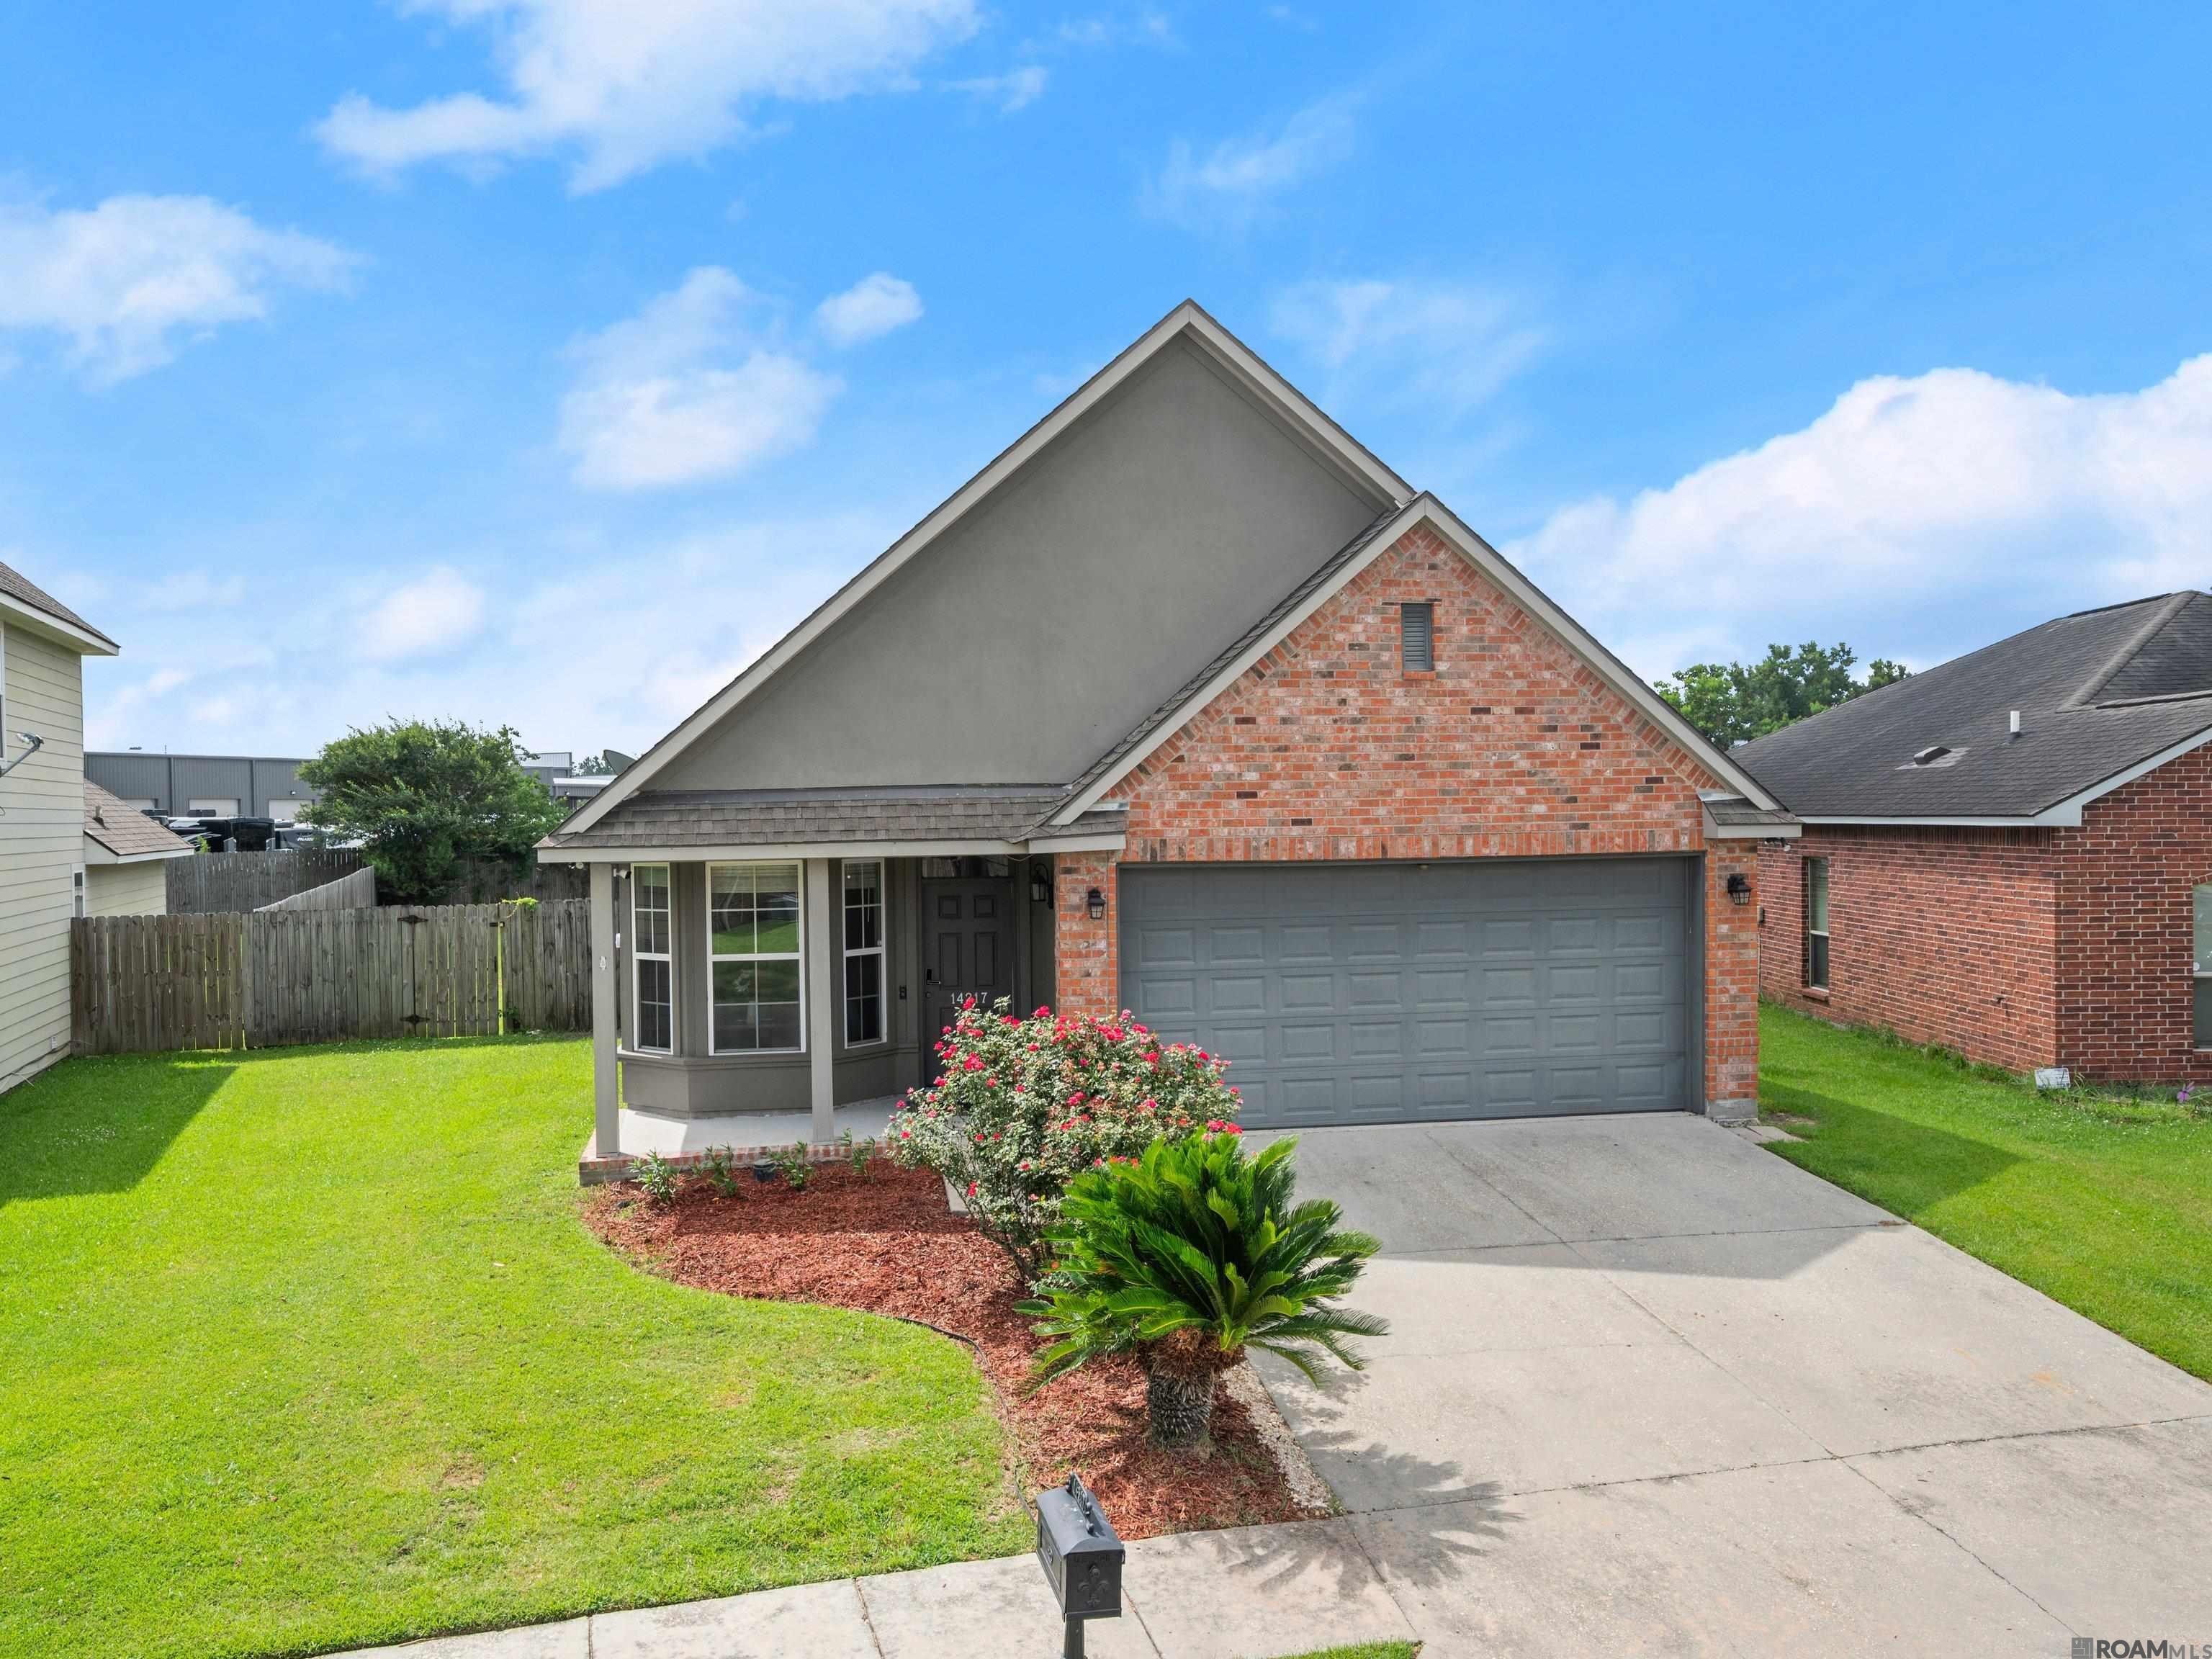
Active
$295,000
4
bds
|
2
ba
|
1,996
sqft
|
built
2008
14217 Stone Gate Dr, Baton Rouge, LA 70816
$-129
Cash flow
-2.3%
Cash-on-Cash Return
5.8%
Cap rate
0.7%
Rent to Value Ratio
Active
$67,000
3
bds
|
1
ba
|
1,708
sqft
|
built
1975
3577 Greenway Dr, Baton Rouge, LA 70814
$1,242
Cash flow
21.6%
Cash-on-Cash Return
22.2%
Cap rate
2.7%
Rent to Value Ratio
Active
$64,900
3
bds
|
2
ba
|
1,676
sqft
|
built
1950
3525 Monroe Ave, Baton Rouge, LA 70802
$897
Cash flow
16.1%
Cash-on-Cash Return
16.6%
Cap rate
2.0%
Rent to Value Ratio
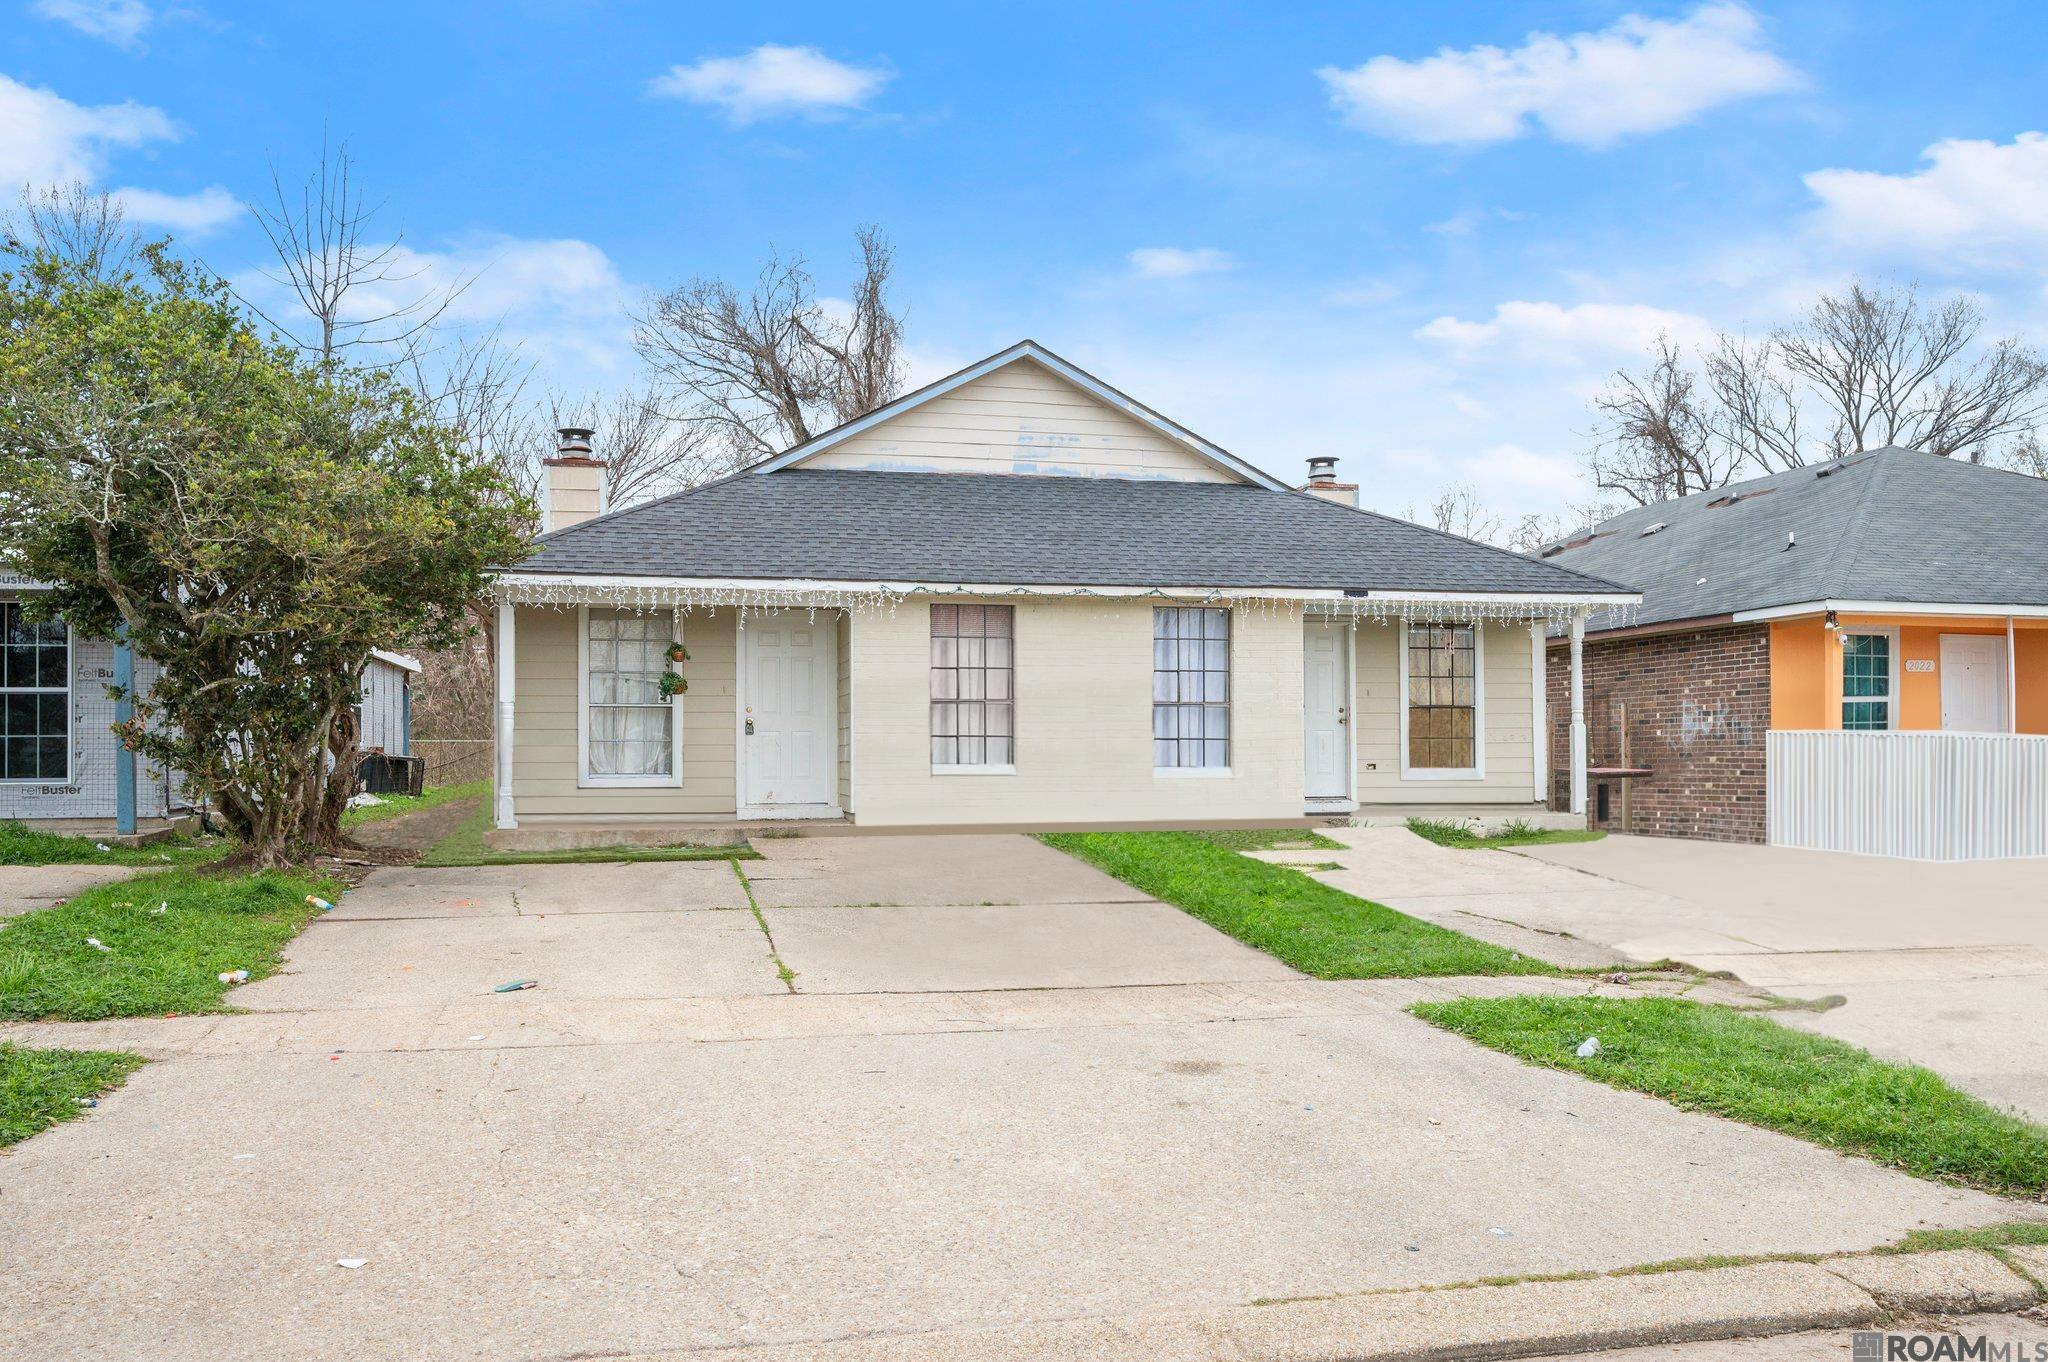
Active
$155,000
bds
|
0
ba
|
2,304
sqft
|
built
1984
2030-2032 Helm Dr, Baton Rouge, LA 70820
$568
Cash flow
19.1%
Cash-on-Cash Return
10.7%
Cap rate
1.3%
Rent to Value Ratio
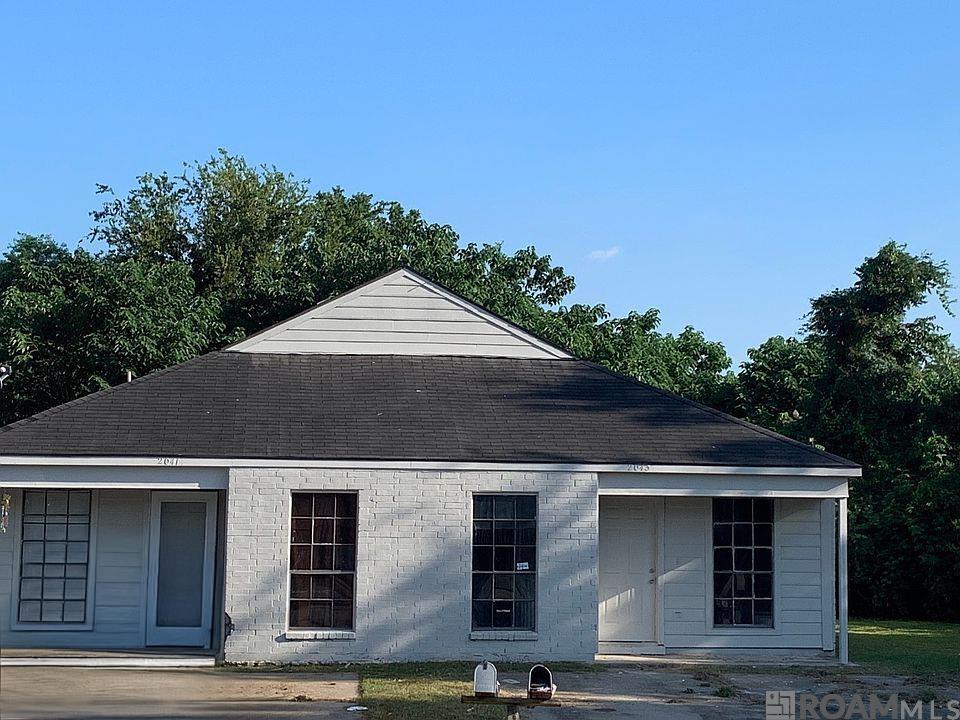
Active
$155,000
bds
|
0
ba
|
2,304
sqft
|
built
1984
2041-2043 Helm Dr, Baton Rouge, LA 70820
$568
Cash flow
19.1%
Cash-on-Cash Return
10.7%
Cap rate
1.3%
Rent to Value Ratio
Active
$85,000
3
bds
|
1
ba
|
1,561
sqft
|
built
1960
2878 Sherwood St, Baton Rouge, LA 70805
$452
Cash flow
27.7%
Cash-on-Cash Return
12.7%
Cap rate
1.5%
Rent to Value Ratio

Active
$22,000
2
bds
|
1
ba
|
920
sqft
|
built
1975
1354 N 38th St, Baton Rouge, LA 70802
$552
Cash flow
29.2%
Cash-on-Cash Return
30.1%
Cap rate
3.6%
Rent to Value Ratio
Active
$88,900
4
bds
|
2
ba
|
1,677
sqft
|
built
1976
1438 N 43rd St, Baton Rouge, LA 70802
$362
Cash flow
21.2%
Cash-on-Cash Return
11.2%
Cap rate
1.3%
Rent to Value Ratio

Active
$130,000
2
bds
|
2
ba
|
1,299
sqft
|
built
1977
4902 Alvin Dark Ave, Baton Rouge, LA 70820
$423
Cash flow
17.0%
Cash-on-Cash Return
10.2%
Cap rate
1.2%
Rent to Value Ratio
Active
$116,000
2
bds
|
1
ba
|
1,100
sqft
|
built
1970
2034 N 15th St, Baton Rouge, LA 70802
$359
Cash flow
16.1%
Cash-on-Cash Return
10.0%
Cap rate
1.2%
Rent to Value Ratio

Pending
$80,000
3
bds
|
1
ba
|
926
sqft
|
built
1955
6824 Autumn Ave, Baton Rouge, LA 70812
$340
Cash flow
22.2%
Cash-on-Cash Return
11.4%
Cap rate
1.4%
Rent to Value Ratio
Active
$279,000
4
bds
|
3
ba
|
2,087
sqft
|
built
1973
13243 Avants Ave, Baton Rouge, LA 70815
$126
Cash flow
2.4%
Cash-on-Cash Return
6.8%
Cap rate
0.8%
Rent to Value Ratio
Pending
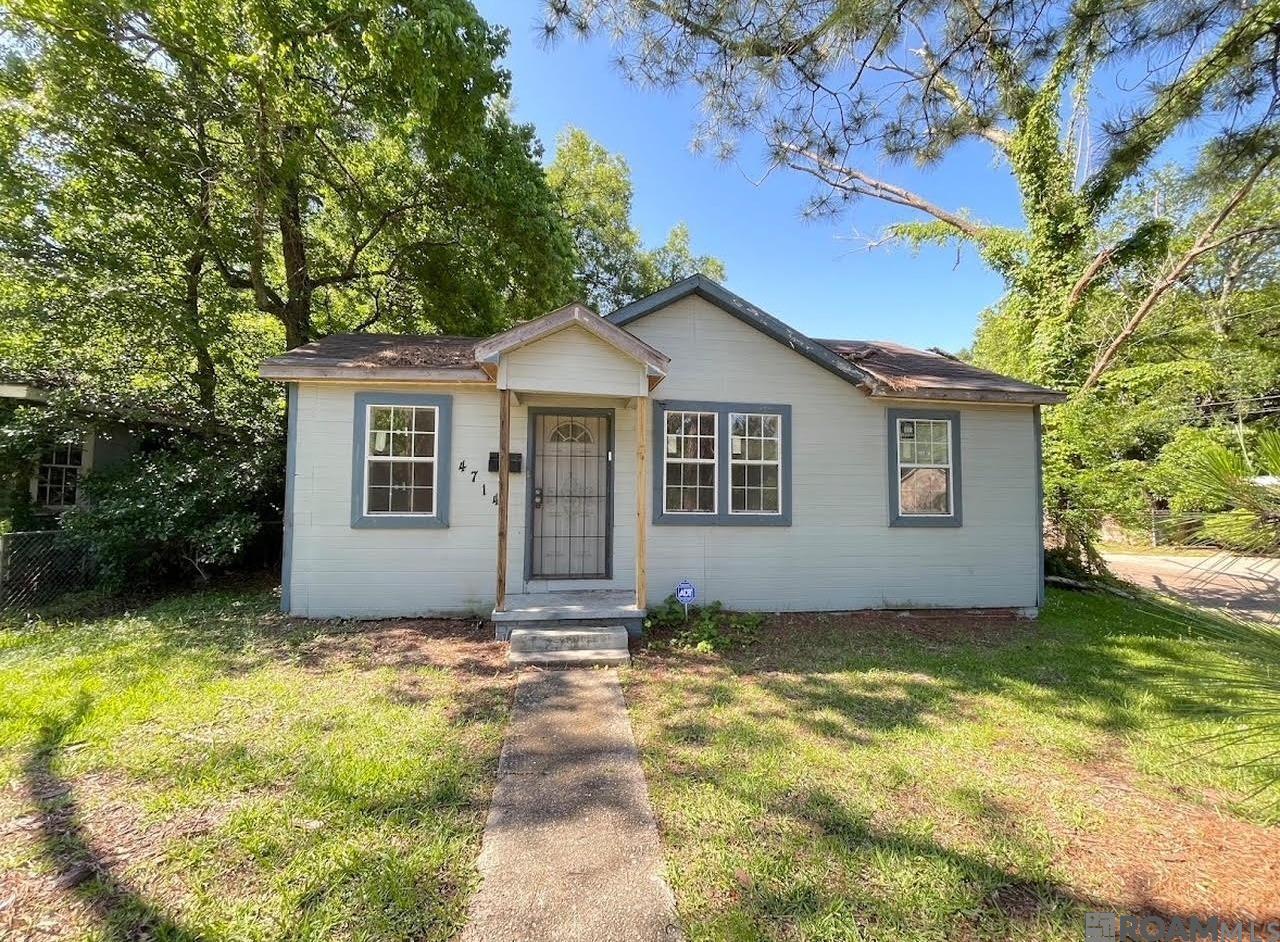
$39,000
2
bds
|
1
ba
|
1,100
sqft
|
built
1978
4714 Fairfields Ave, Baton Rouge, LA 70802
$759
Cash flow
22.7%
Cash-on-Cash Return
23.4%
Cap rate
2.8%
Rent to Value Ratio
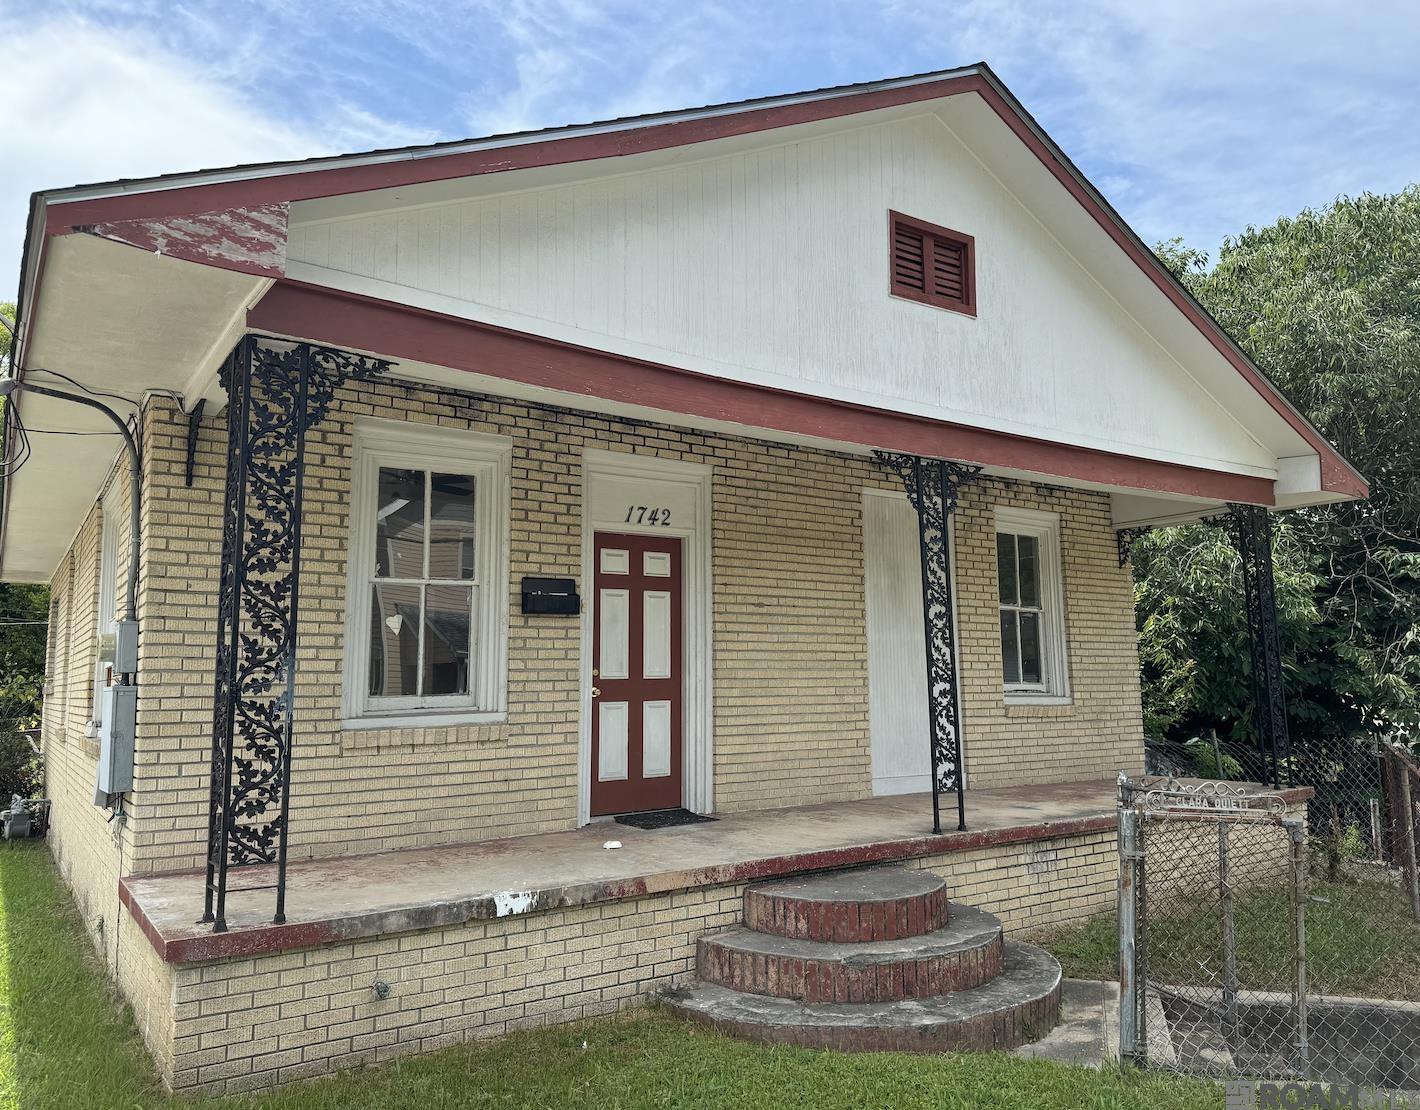
Active
$80,000
3
bds
|
1
ba
|
1,071
sqft
|
built
1946
1742 Napoleon St, Baton Rouge, LA 70802
$271
Cash flow
17.7%
Cash-on-Cash Return
10.4%
Cap rate
1.3%
Rent to Value Ratio
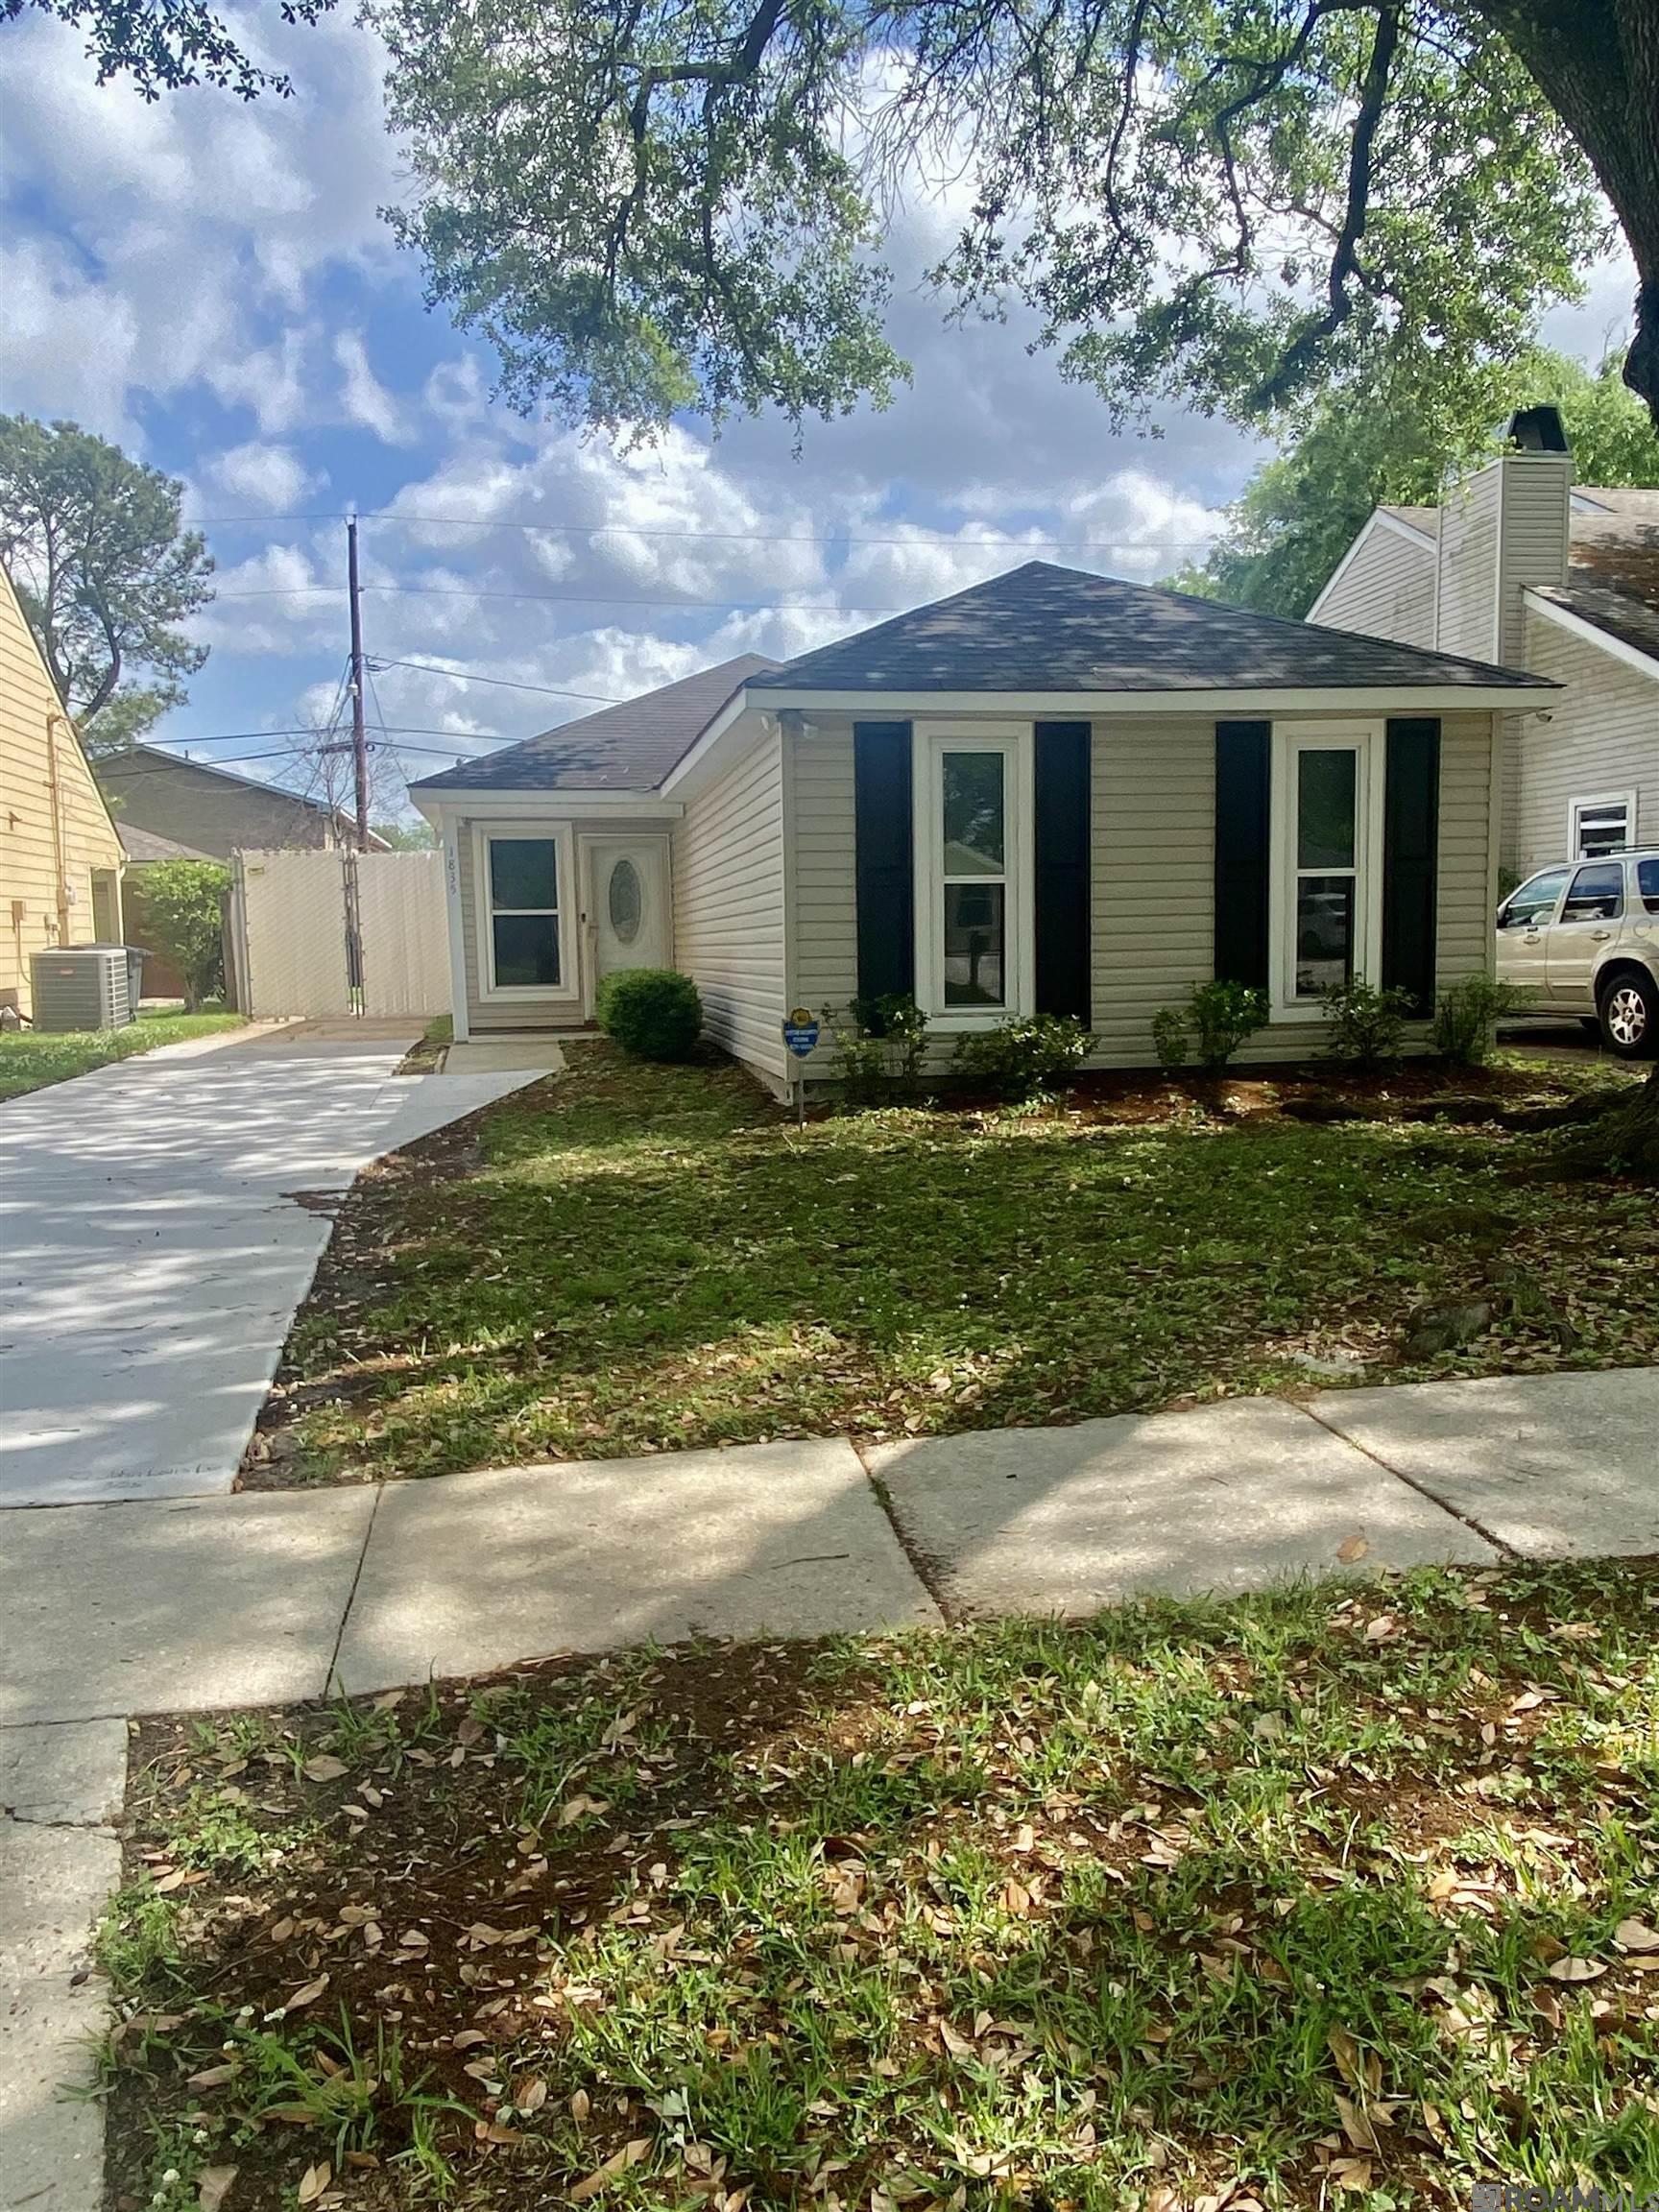
Active
$169,900
2
bds
|
2
ba
|
1,150
sqft
|
built
1980
1835 Fountain Ave, Baton Rouge, LA 70810
$76
Cash flow
2.3%
Cash-on-Cash Return
6.8%
Cap rate
0.8%
Rent to Value Ratio
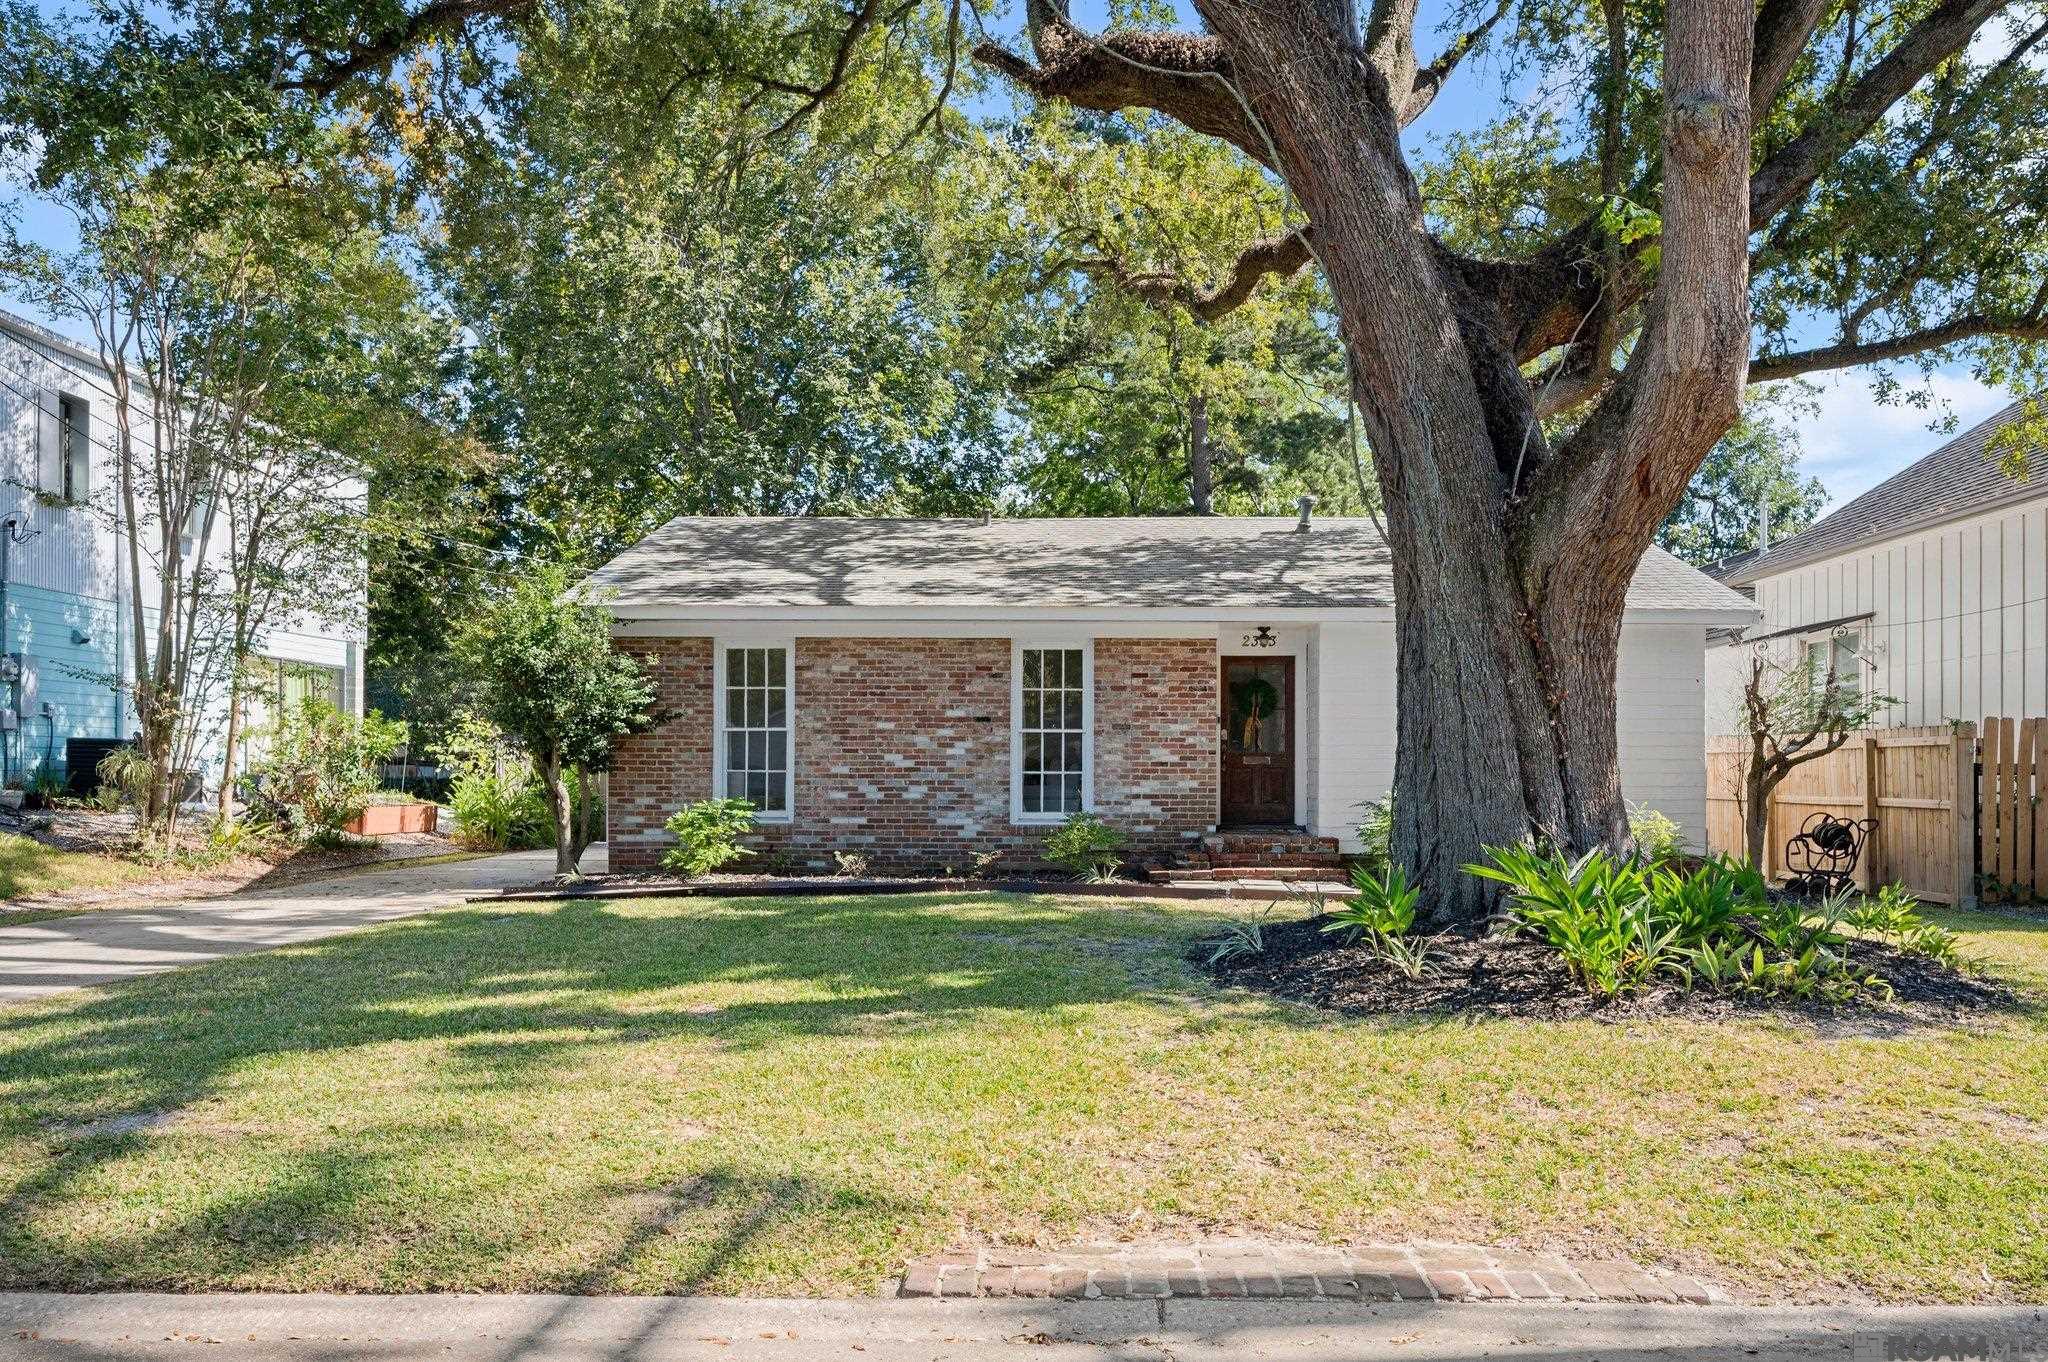
Active
$335,000
3
bds
|
2
ba
|
1,620
sqft
|
built
1960
2333 Orpine Ave, Baton Rouge, LA 70808
$-29
Cash flow
-0.5%
Cash-on-Cash Return
6.2%
Cap rate
0.7%
Rent to Value Ratio
Active
$219,900
4
bds
|
2
ba
|
1,754
sqft
|
built
2003
330 Edgehaven Dr, Baton Rouge, LA 70810
$82
Cash flow
1.9%
Cash-on-Cash Return
6.7%
Cap rate
0.8%
Rent to Value Ratio
Active
$565,000
4
bds
|
3
ba
|
2,856
sqft
|
built
1989
626 Shadow Oak Dr, Baton Rouge, LA 70810
$-281
Cash flow
-2.6%
Cash-on-Cash Return
5.7%
Cap rate
0.7%
Rent to Value Ratio