Baton Rouge, LA Investment Properties for Sale
Browse homes for sale and investment properties in Baton Rouge, LA. Refine your search by price, property type, or more.
Best cash flowing properties in Baton Rouge, LA
Active
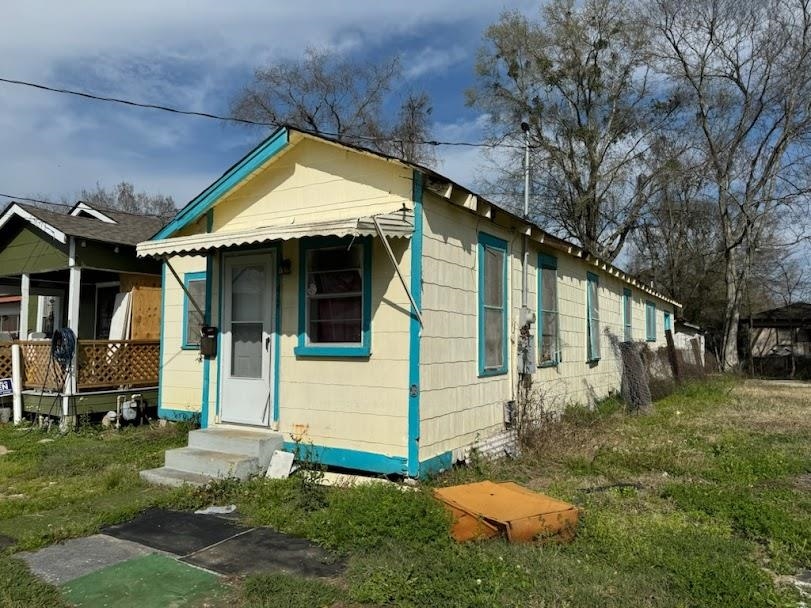
$39,900
4
bds
|
1
ba
|
1,000
sqft
|
built
1973
432 Roselawn Ave, Baton Rouge, LA 70806
$621
Cash flow
18.1%
Cash-on-Cash Return
18.7%
Cap rate
2.3%
Rent to Value Ratio
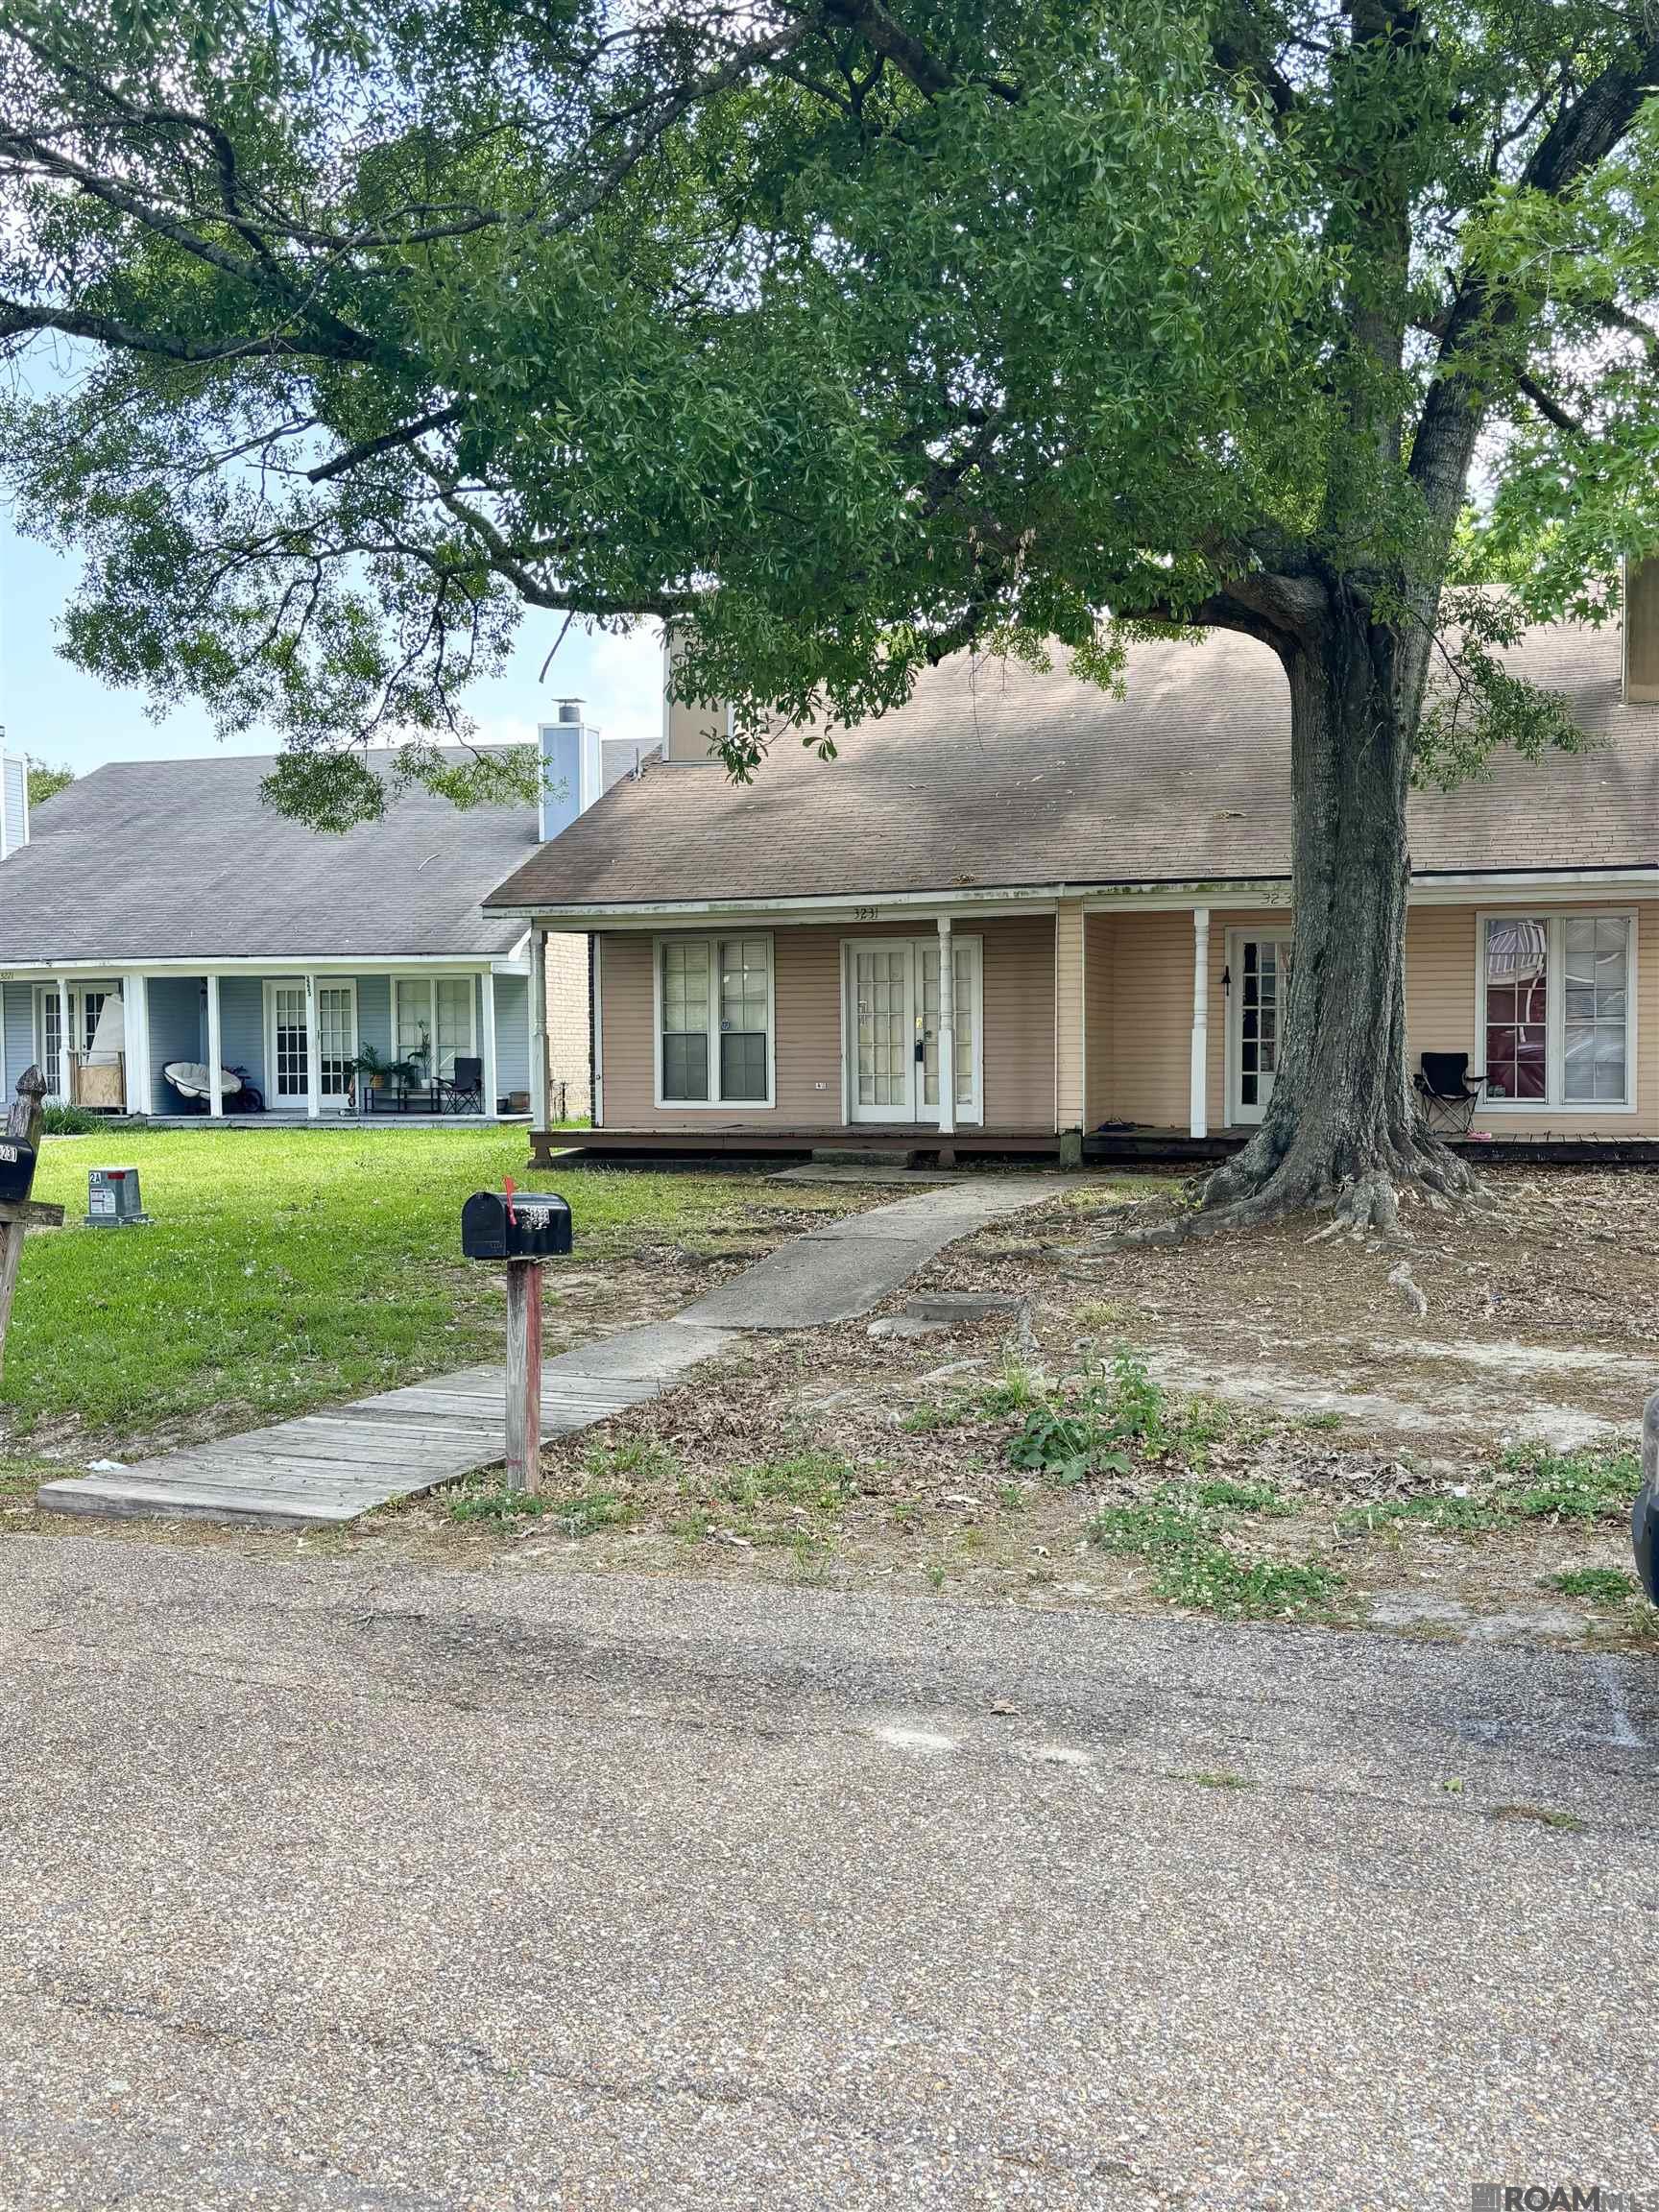
Active
$125,000
3
bds
|
2
ba
|
1,401
sqft
|
built
1983
3231 King Bradford Dr, Baton Rouge, LA 70816
$311
Cash flow
13.0%
Cash-on-Cash Return
9.3%
Cap rate
1.1%
Rent to Value Ratio
1,001 out of 1,290 properties for sale in Baton Rouge, LA
Limited Results Shown
Create a free account, or log in to reveal all property listings and enjoy the complete experience.
Active
$669,000
4
bds
|
4
ba
|
3,843
sqft
|
built
1993
5802 Highland Rd, Baton Rouge, LA 70808
$-743
Cash flow
-5.8%
Cash-on-Cash Return
5.0%
Cap rate
0.6%
Rent to Value Ratio
Active
$230,000
2
bds
|
2
ba
|
1,569
sqft
|
built
1967
256 Kenwood Ave, Baton Rouge, LA 70806
$-31
Cash flow
-0.7%
Cash-on-Cash Return
6.1%
Cap rate
0.7%
Rent to Value Ratio
Pending
$160,000
3
bds
|
2
ba
|
1,081
sqft
|
built
1970
5621 Lanier Dr, Baton Rouge, LA 70812
$-10
Cash flow
-0.3%
Cash-on-Cash Return
6.2%
Cap rate
0.8%
Rent to Value Ratio
Active
$585,000
3
bds
|
2
ba
|
1,948
sqft
|
built
1940
1501 Letitia St, Baton Rouge, LA 70808
$-1,683
Cash flow
-15.0%
Cash-on-Cash Return
2.8%
Cap rate
0.3%
Rent to Value Ratio

Active
$263,000
2
bds
|
2
ba
|
1,275
sqft
|
built
2022
18320 Tranquil Dr, Baton Rouge, LA 70817
$-381
Cash flow
-7.6%
Cash-on-Cash Return
4.5%
Cap rate
0.6%
Rent to Value Ratio
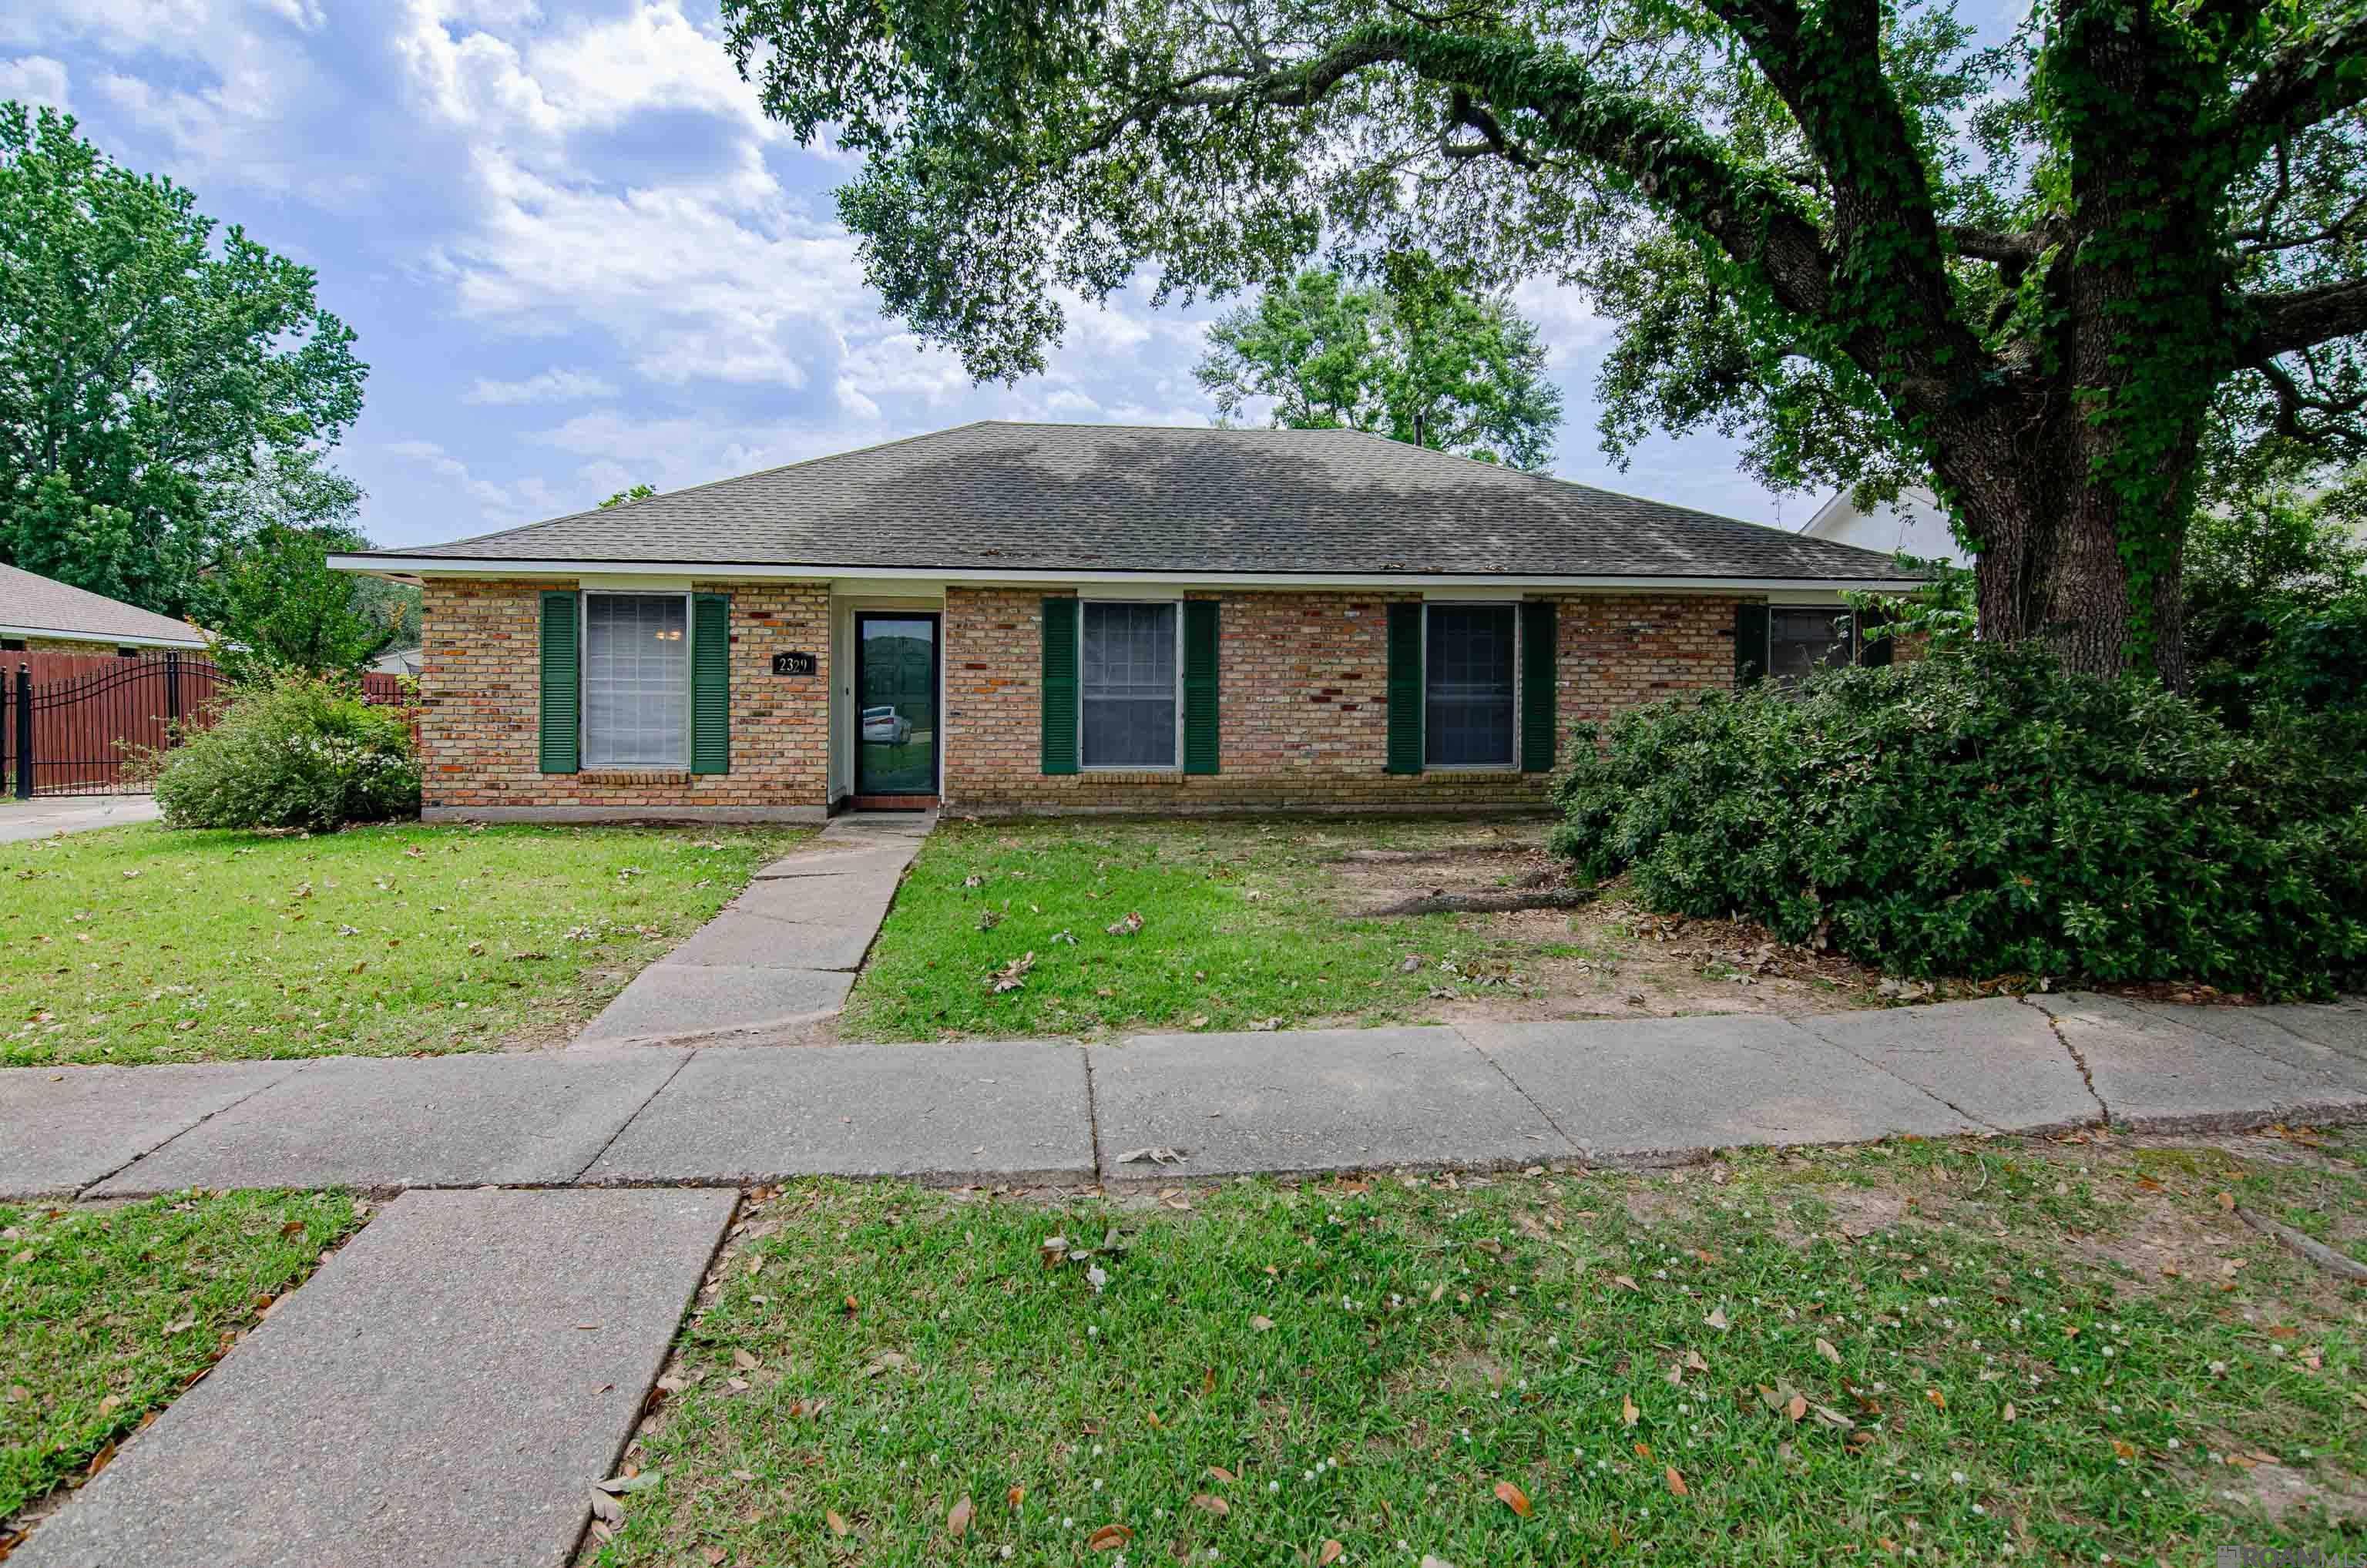
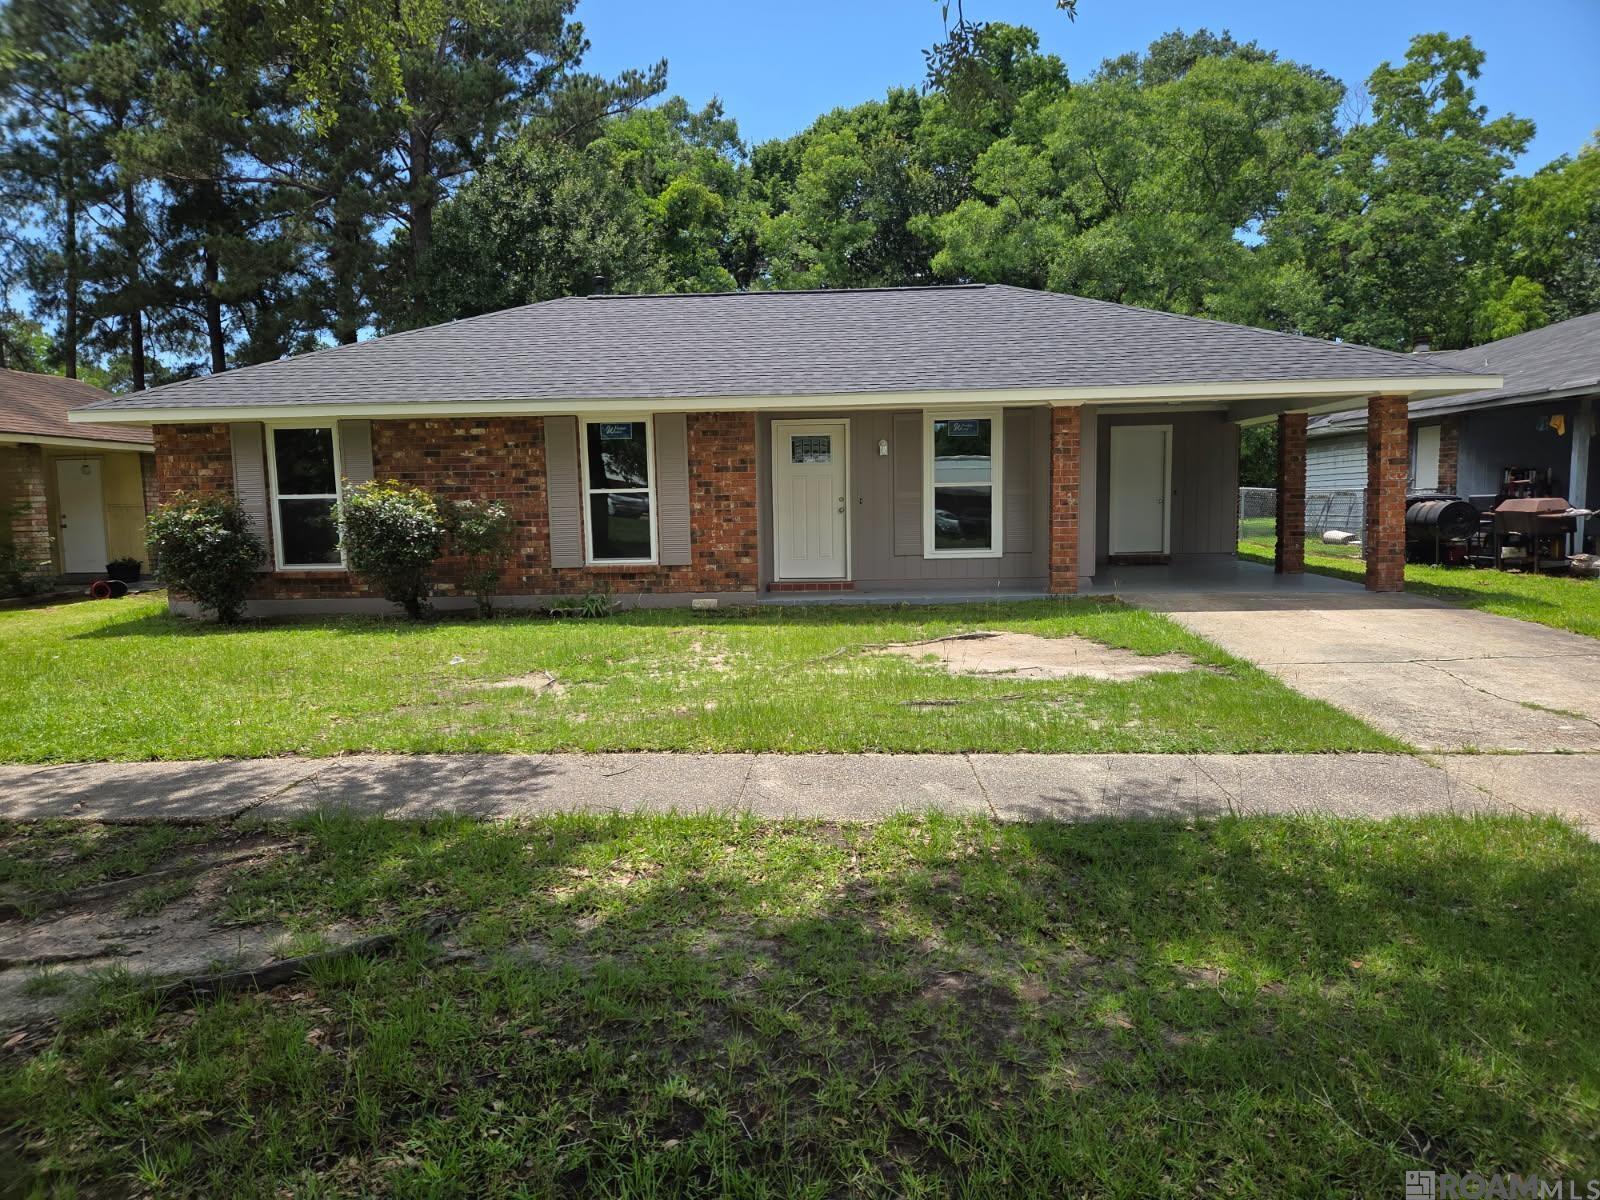
Active
$275,000
4
bds
|
2
ba
|
1,994
sqft
|
built
1980
2329 Aspenwood Dr, Baton Rouge, LA 70816
$-198
Cash flow
-3.8%
Cash-on-Cash Return
5.4%
Cap rate
0.7%
Rent to Value Ratio

Active
$1,230,000
4
bds
|
3
ba
|
4,467
sqft
|
built
1936
3027 E Lakeshore Dr, Baton Rouge, LA 70808
$-4,233
Cash flow
-18.0%
Cash-on-Cash Return
2.2%
Cap rate
0.3%
Rent to Value Ratio
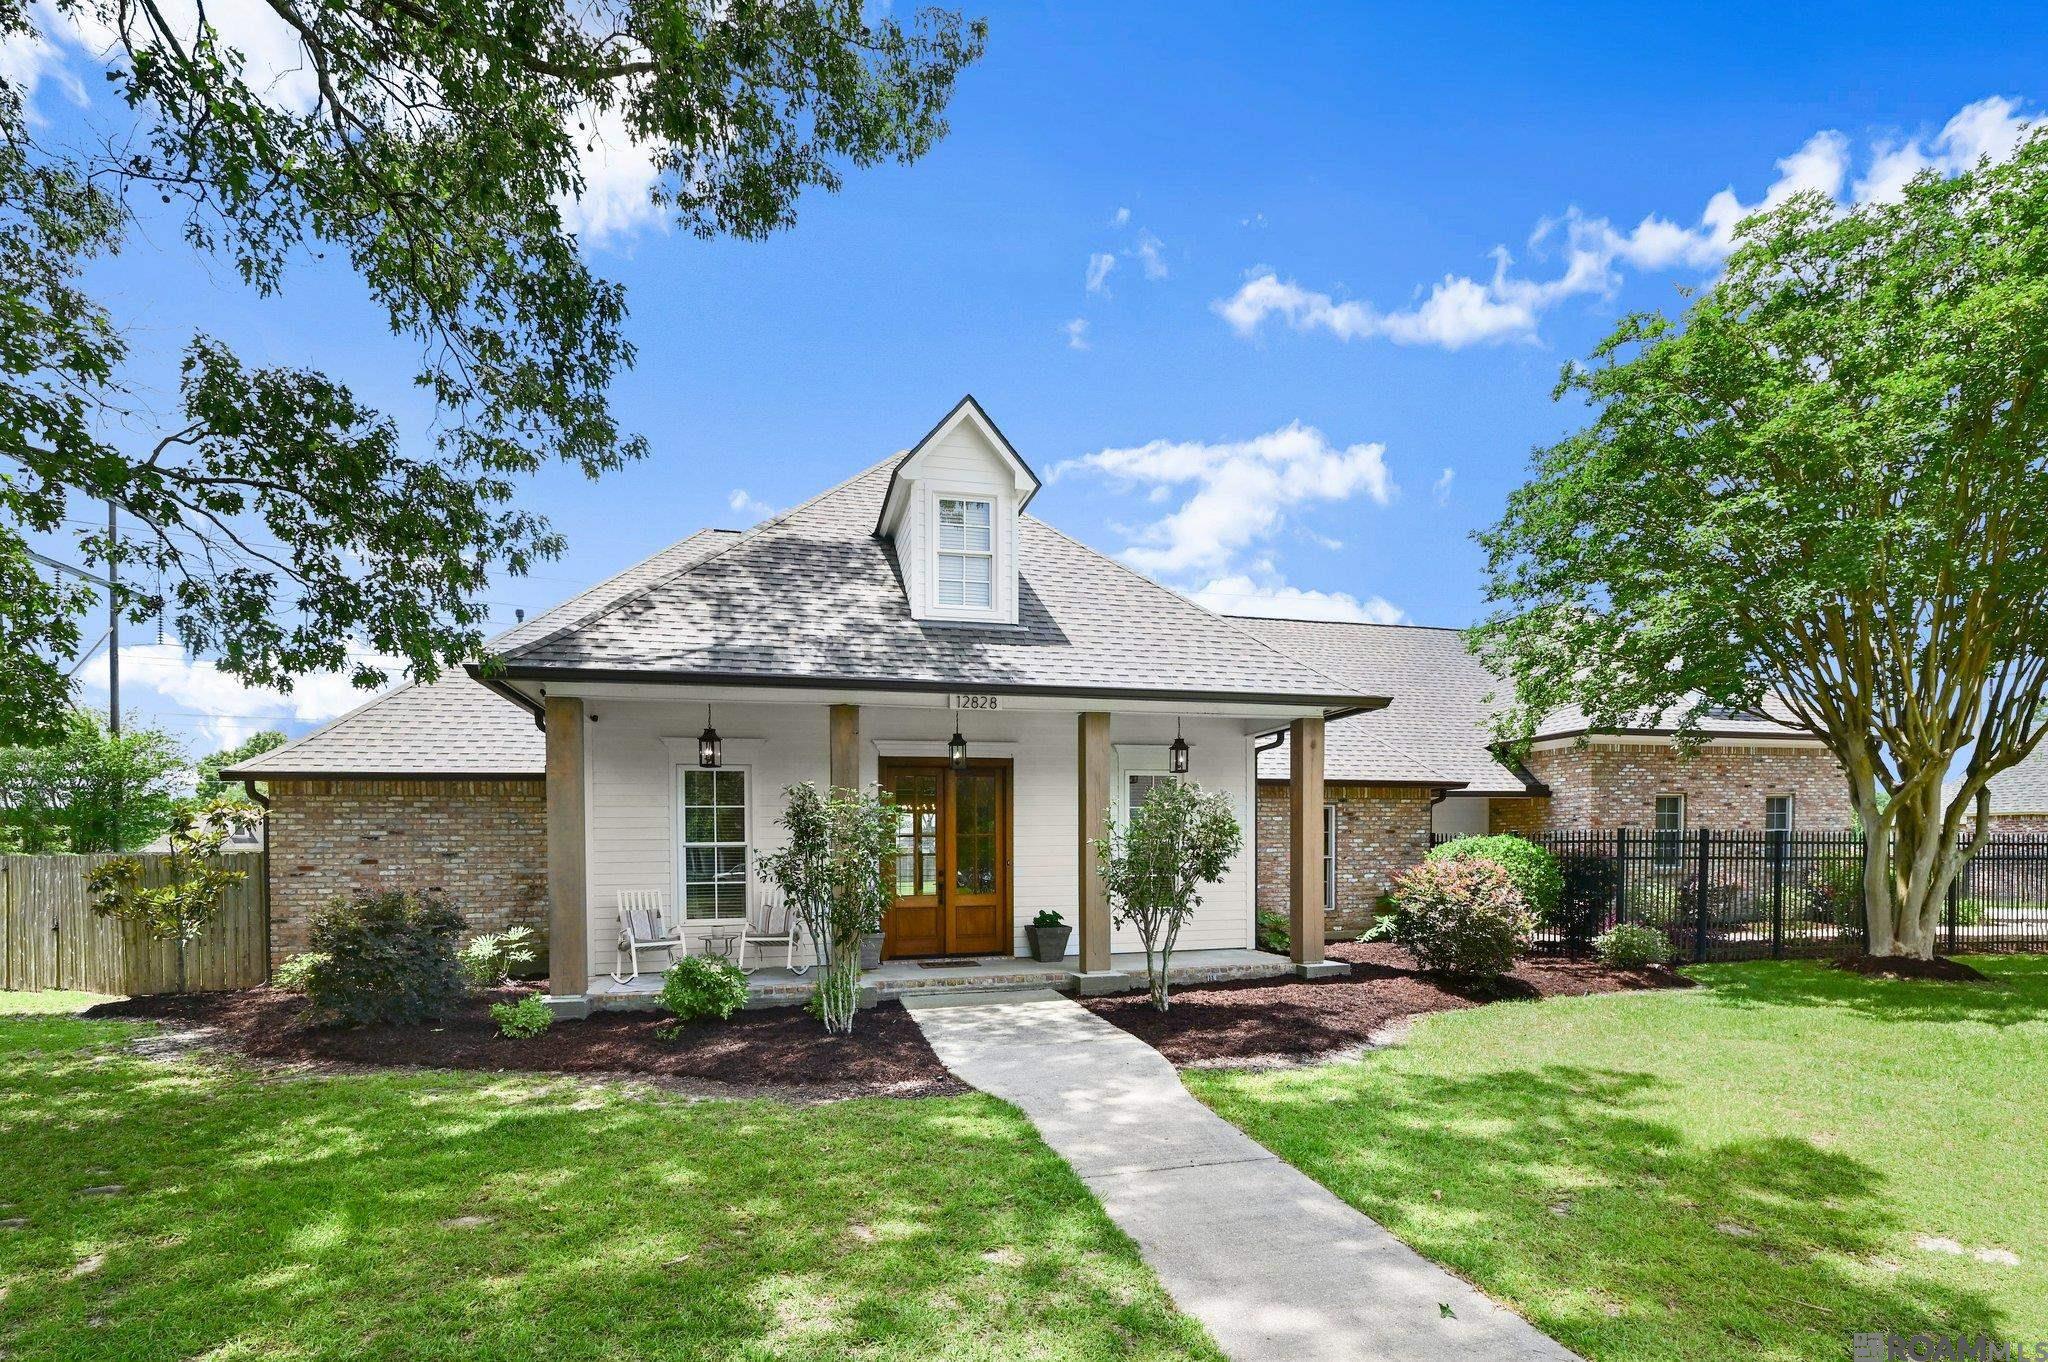
Pending
$594,900
4
bds
|
4
ba
|
3,262
sqft
|
built
1998
12828 Oxley Dr, Baton Rouge, LA 70816
$-989
Cash flow
-8.7%
Cash-on-Cash Return
4.3%
Cap rate
0.5%
Rent to Value Ratio
Active
$670,000
5
bds
|
3
ba
|
3,854
sqft
|
built
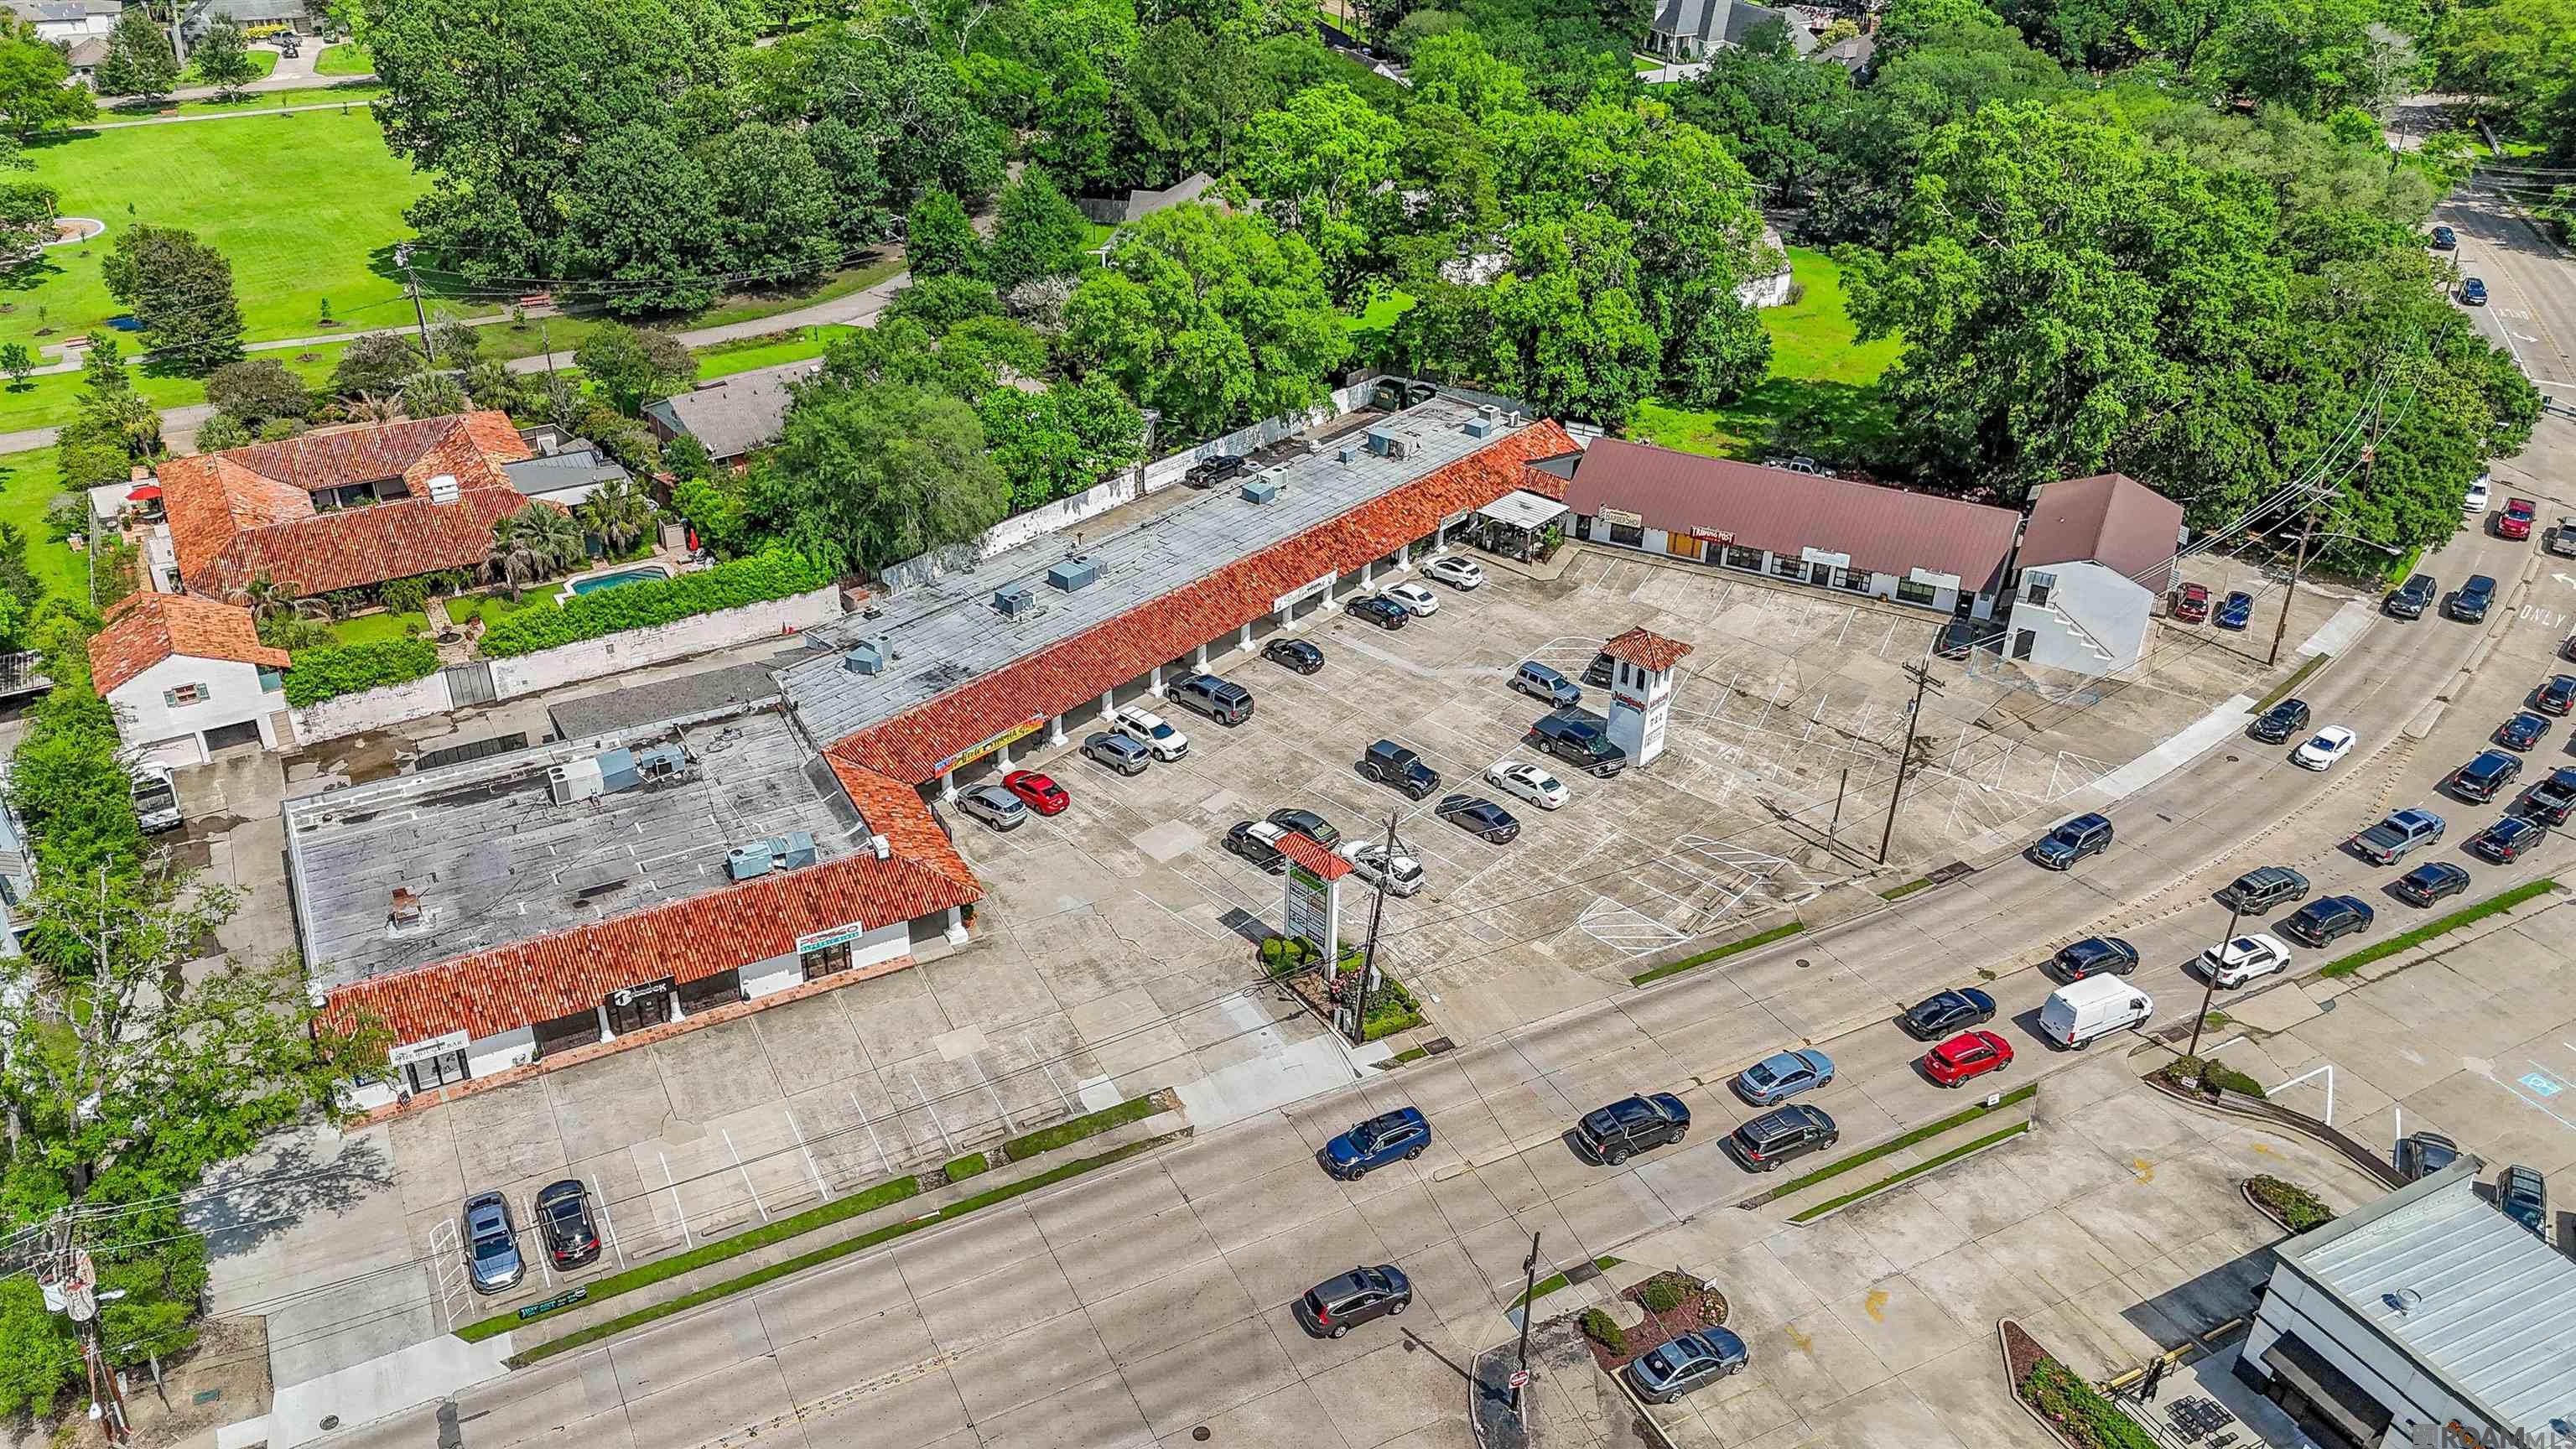
6947 Government St, Baton Rouge, LA 70806
$-473
Cash flow
-3.7%
Cash-on-Cash Return
5.4%
Cap rate
0.7%
Rent to Value Ratio
Active
$290,000
3
bds
|
2
ba
|
1,688
sqft
|
built
2019
1208 Foxtail Dr, Baton Rouge, LA 70820
$295
Cash flow
5.3%
Cash-on-Cash Return
7.5%
Cap rate
0.9%
Rent to Value Ratio
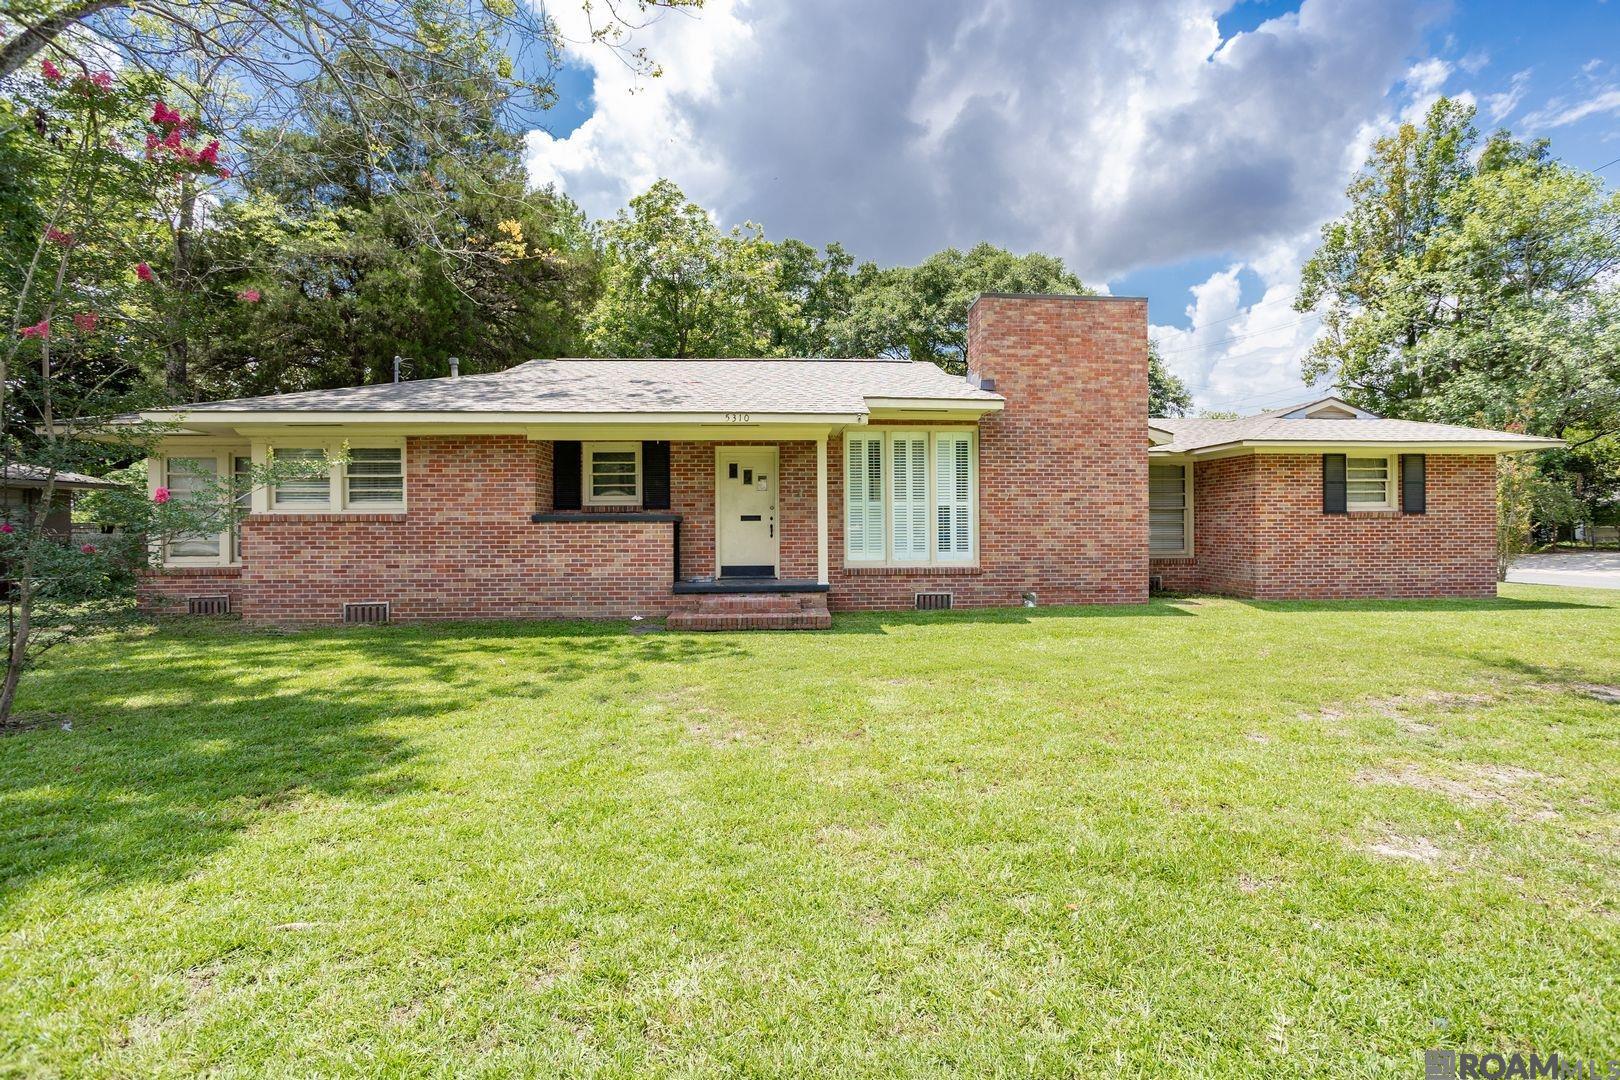
Pending
$175,000
3
bds
|
2
ba
|
1,861
sqft
|
built
1950
5310 N Afton Pkwy, Baton Rouge, LA 70806
$119
Cash flow
3.5%
Cash-on-Cash Return
7.1%
Cap rate
0.9%
Rent to Value Ratio
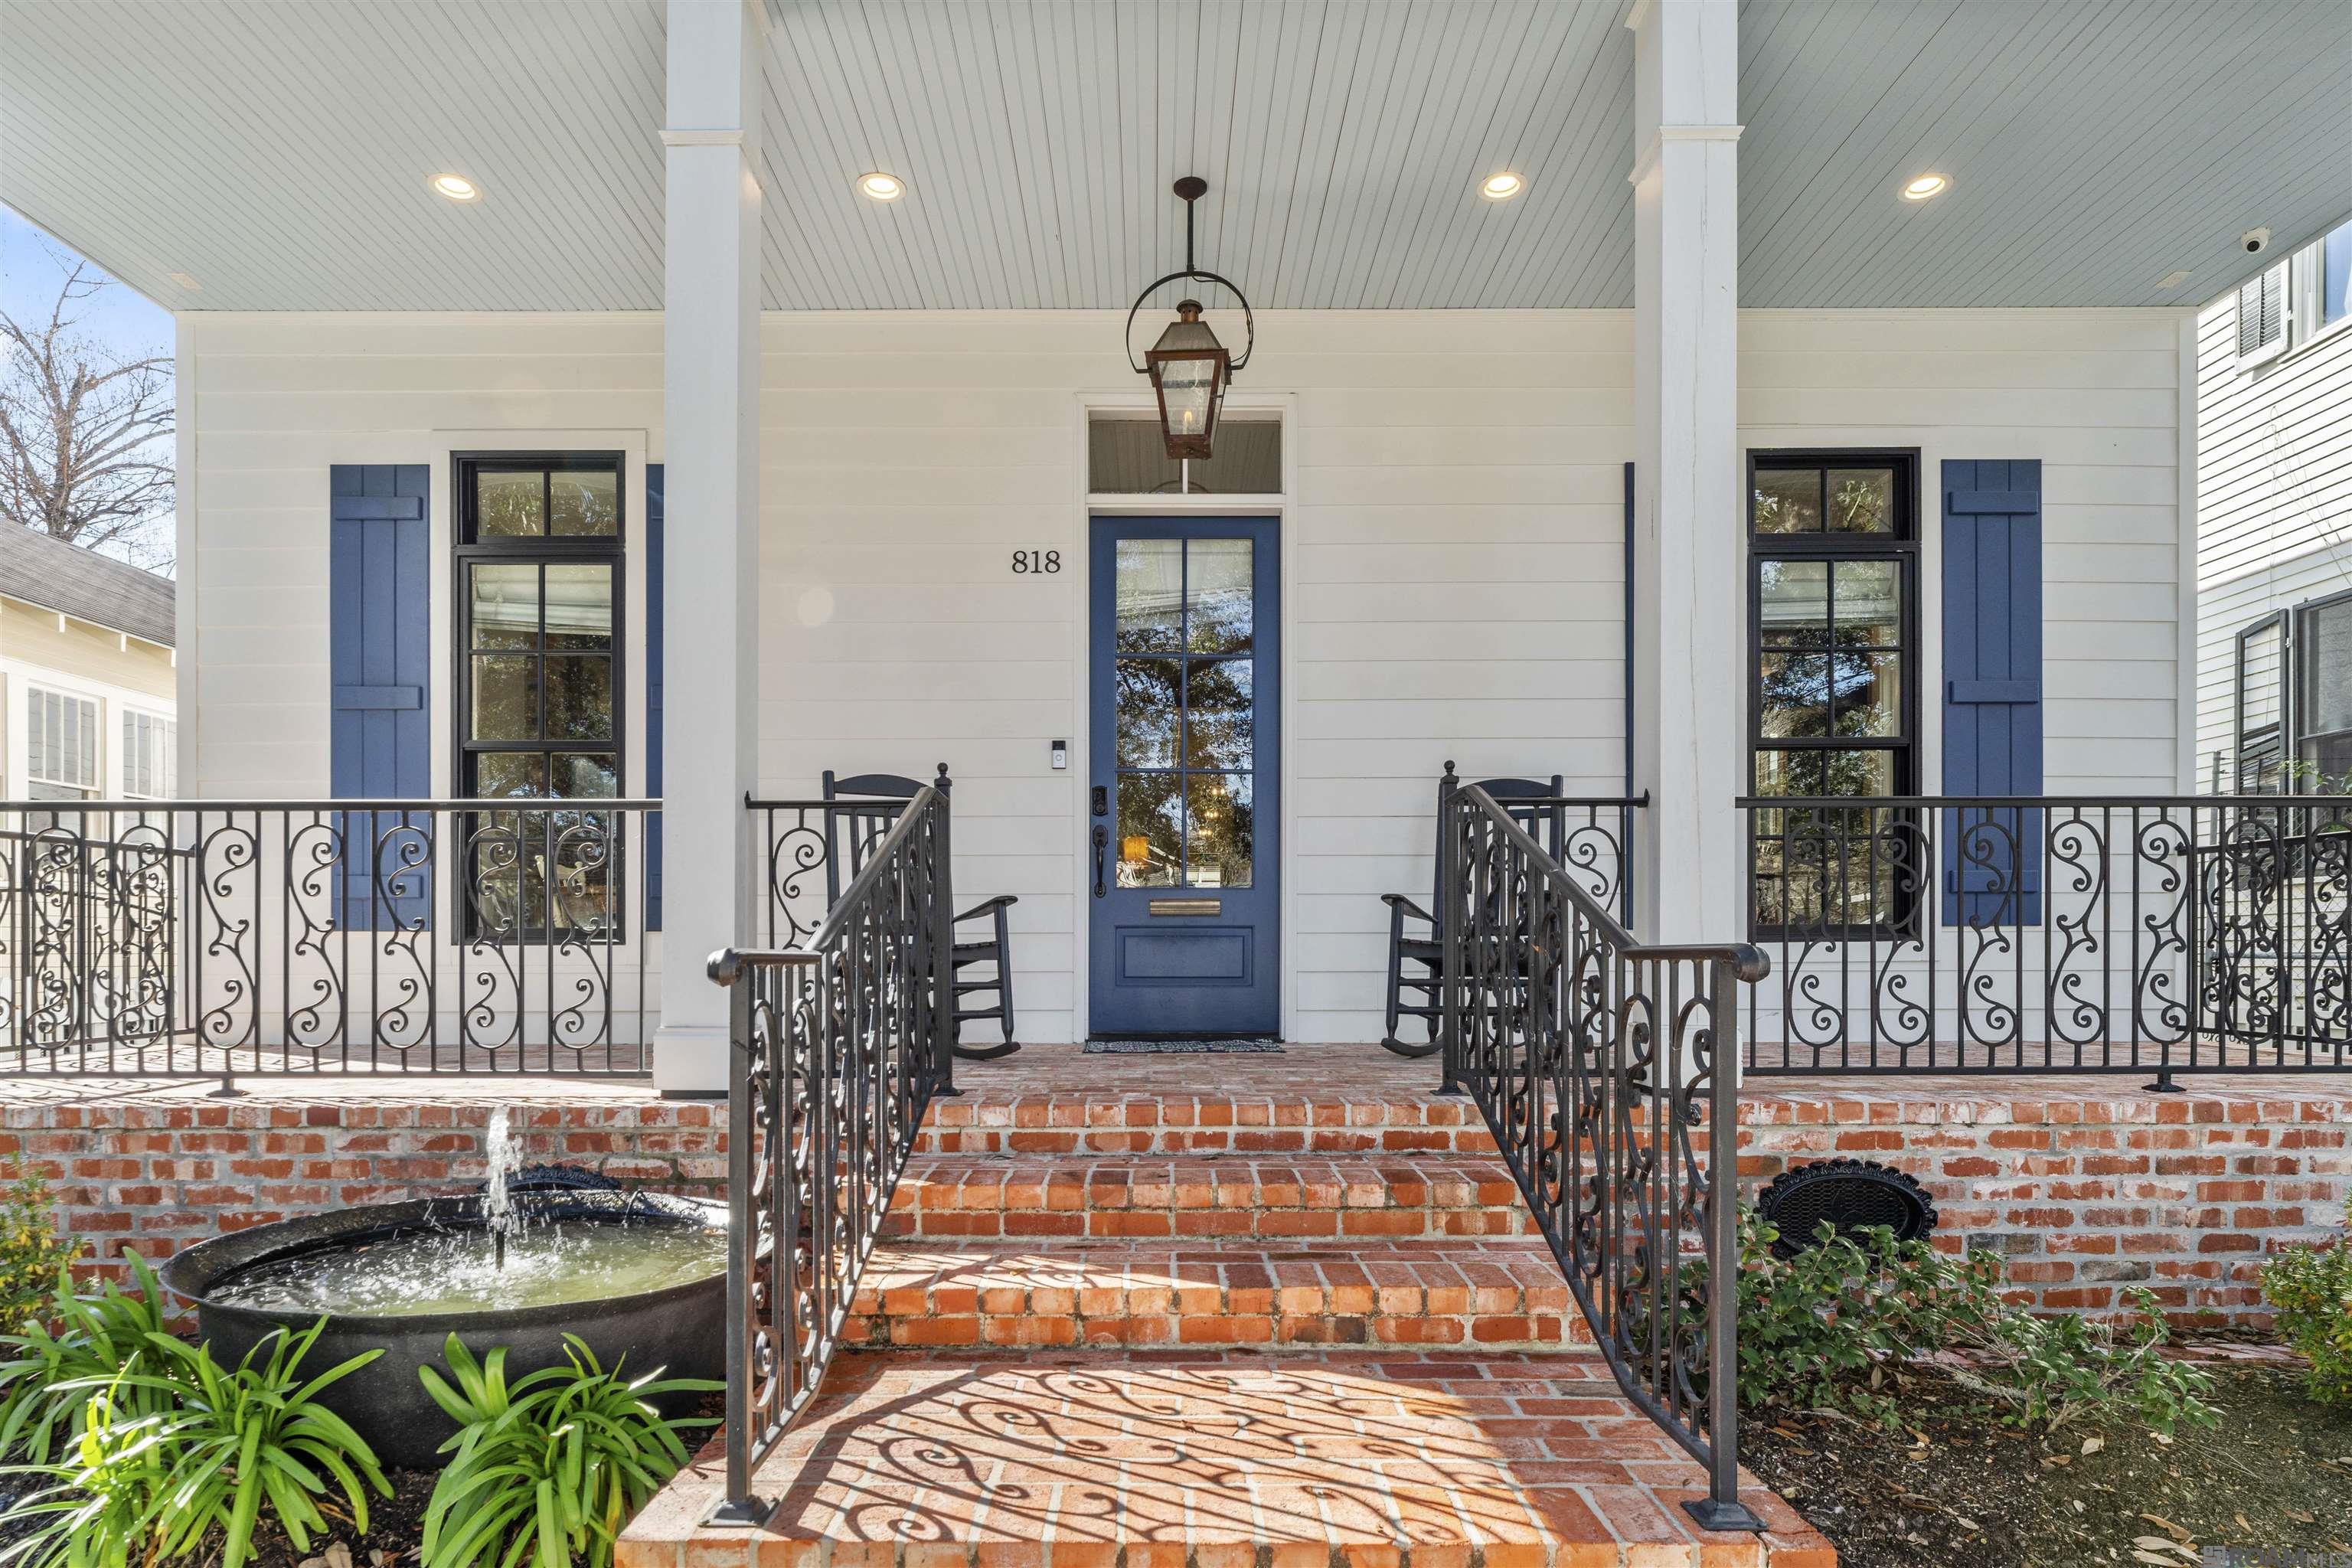
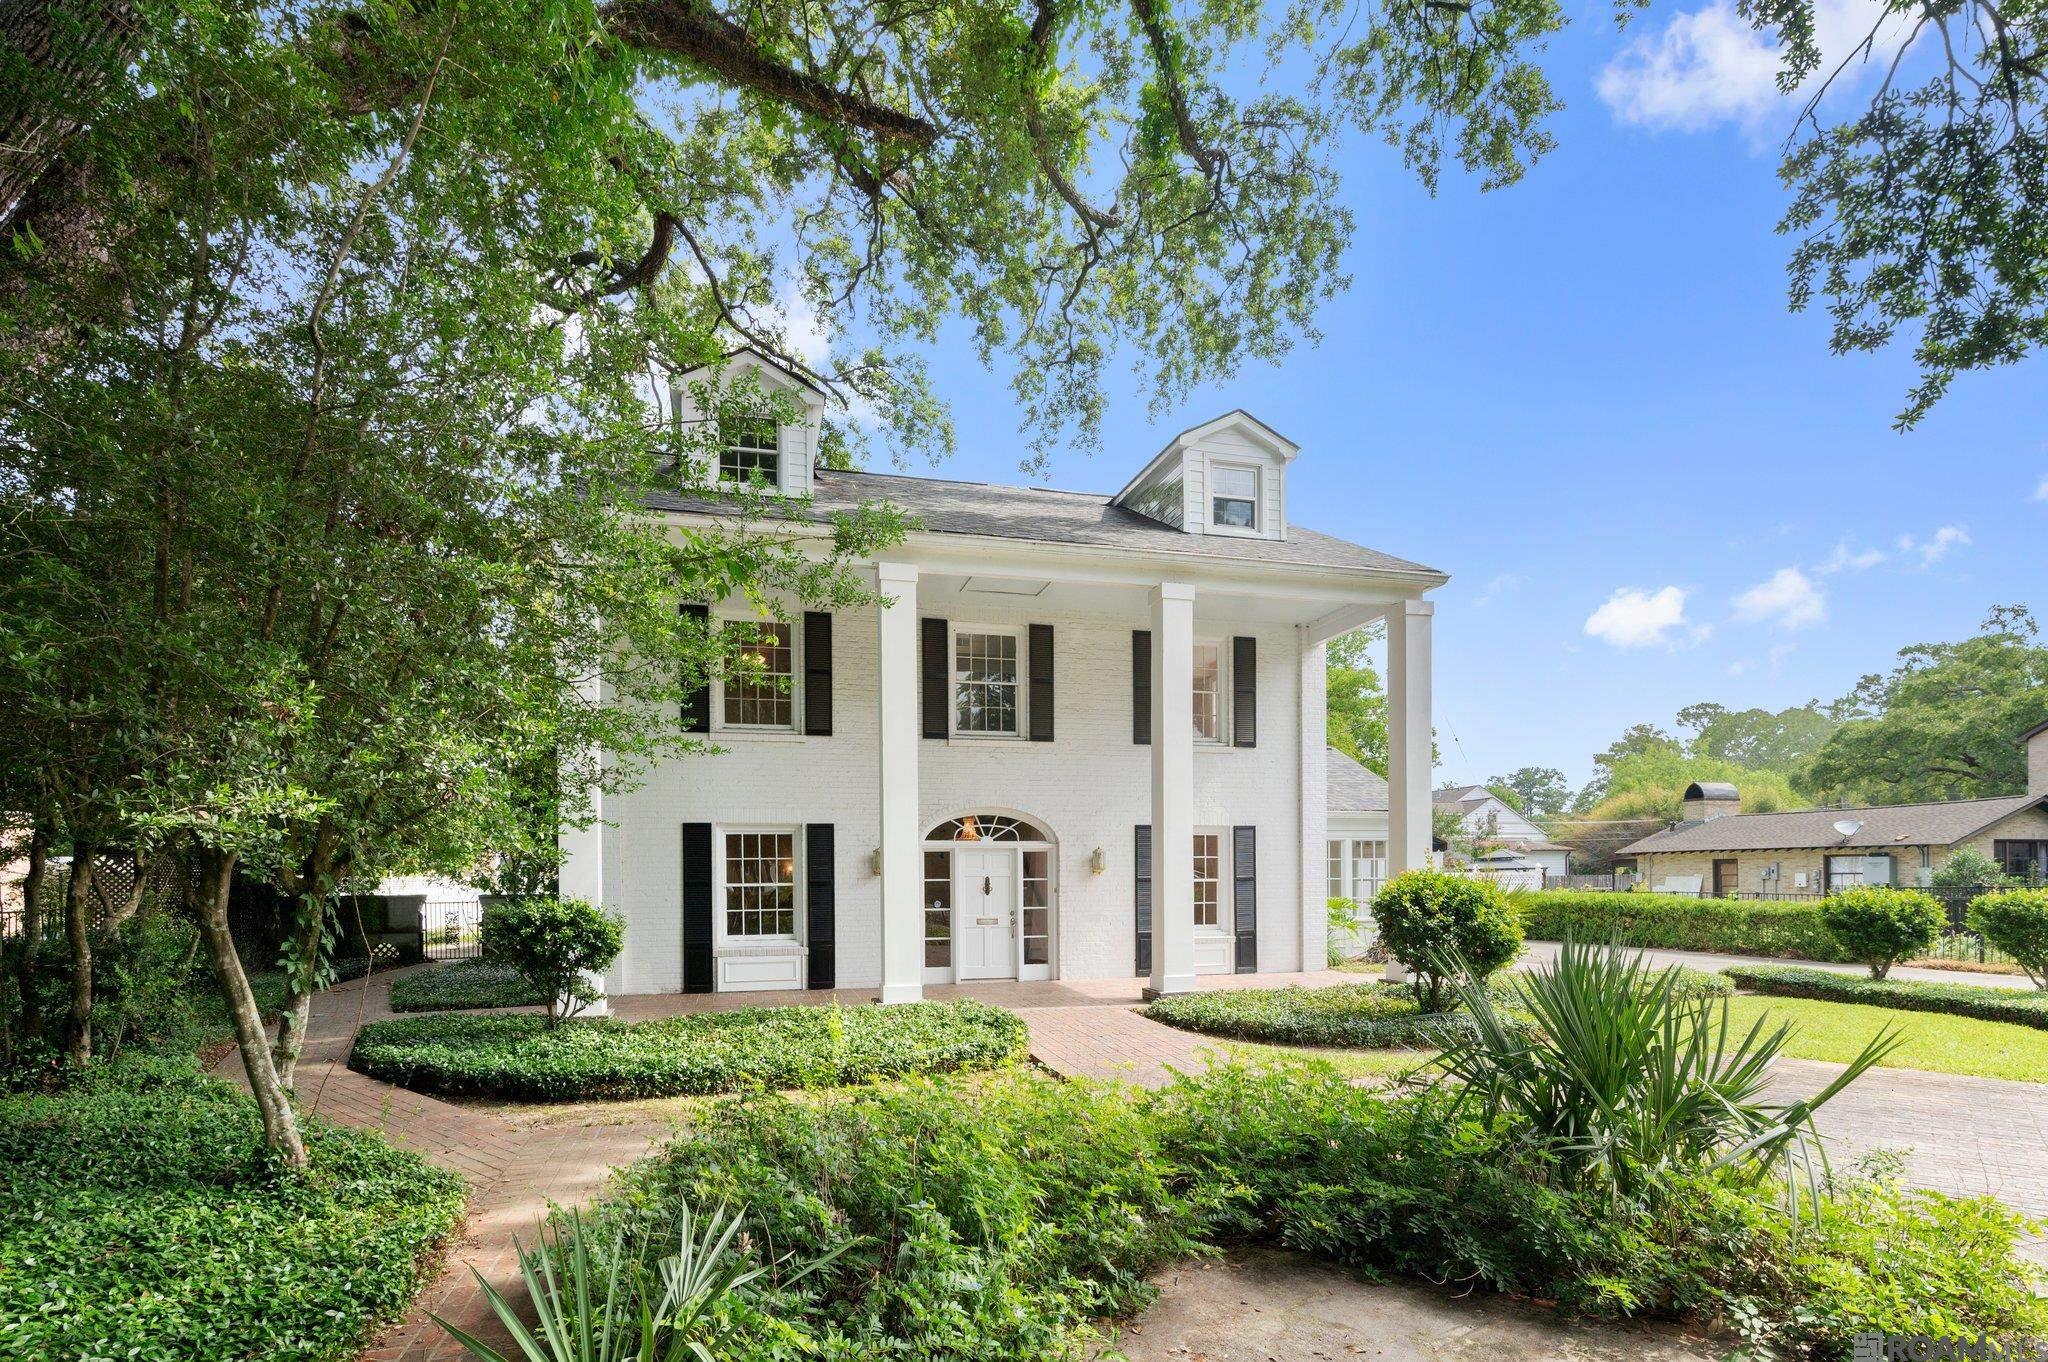
Active
$955,000
4
bds
|
4
ba
|
4,267
sqft
|
built
2022
818 Park Blvd, Baton Rouge, LA 70806
$-654
Cash flow
-3.6%
Cash-on-Cash Return
5.5%
Cap rate
0.7%
Rent to Value Ratio
Active
$450,000
4
bds
|
3
ba
|
2,391
sqft
|
built
1984
19081 Hoo Shoo Too Rd, Baton Rouge, LA 70817
$-356
Cash flow
-4.1%
Cash-on-Cash Return
5.3%
Cap rate
0.6%
Rent to Value Ratio
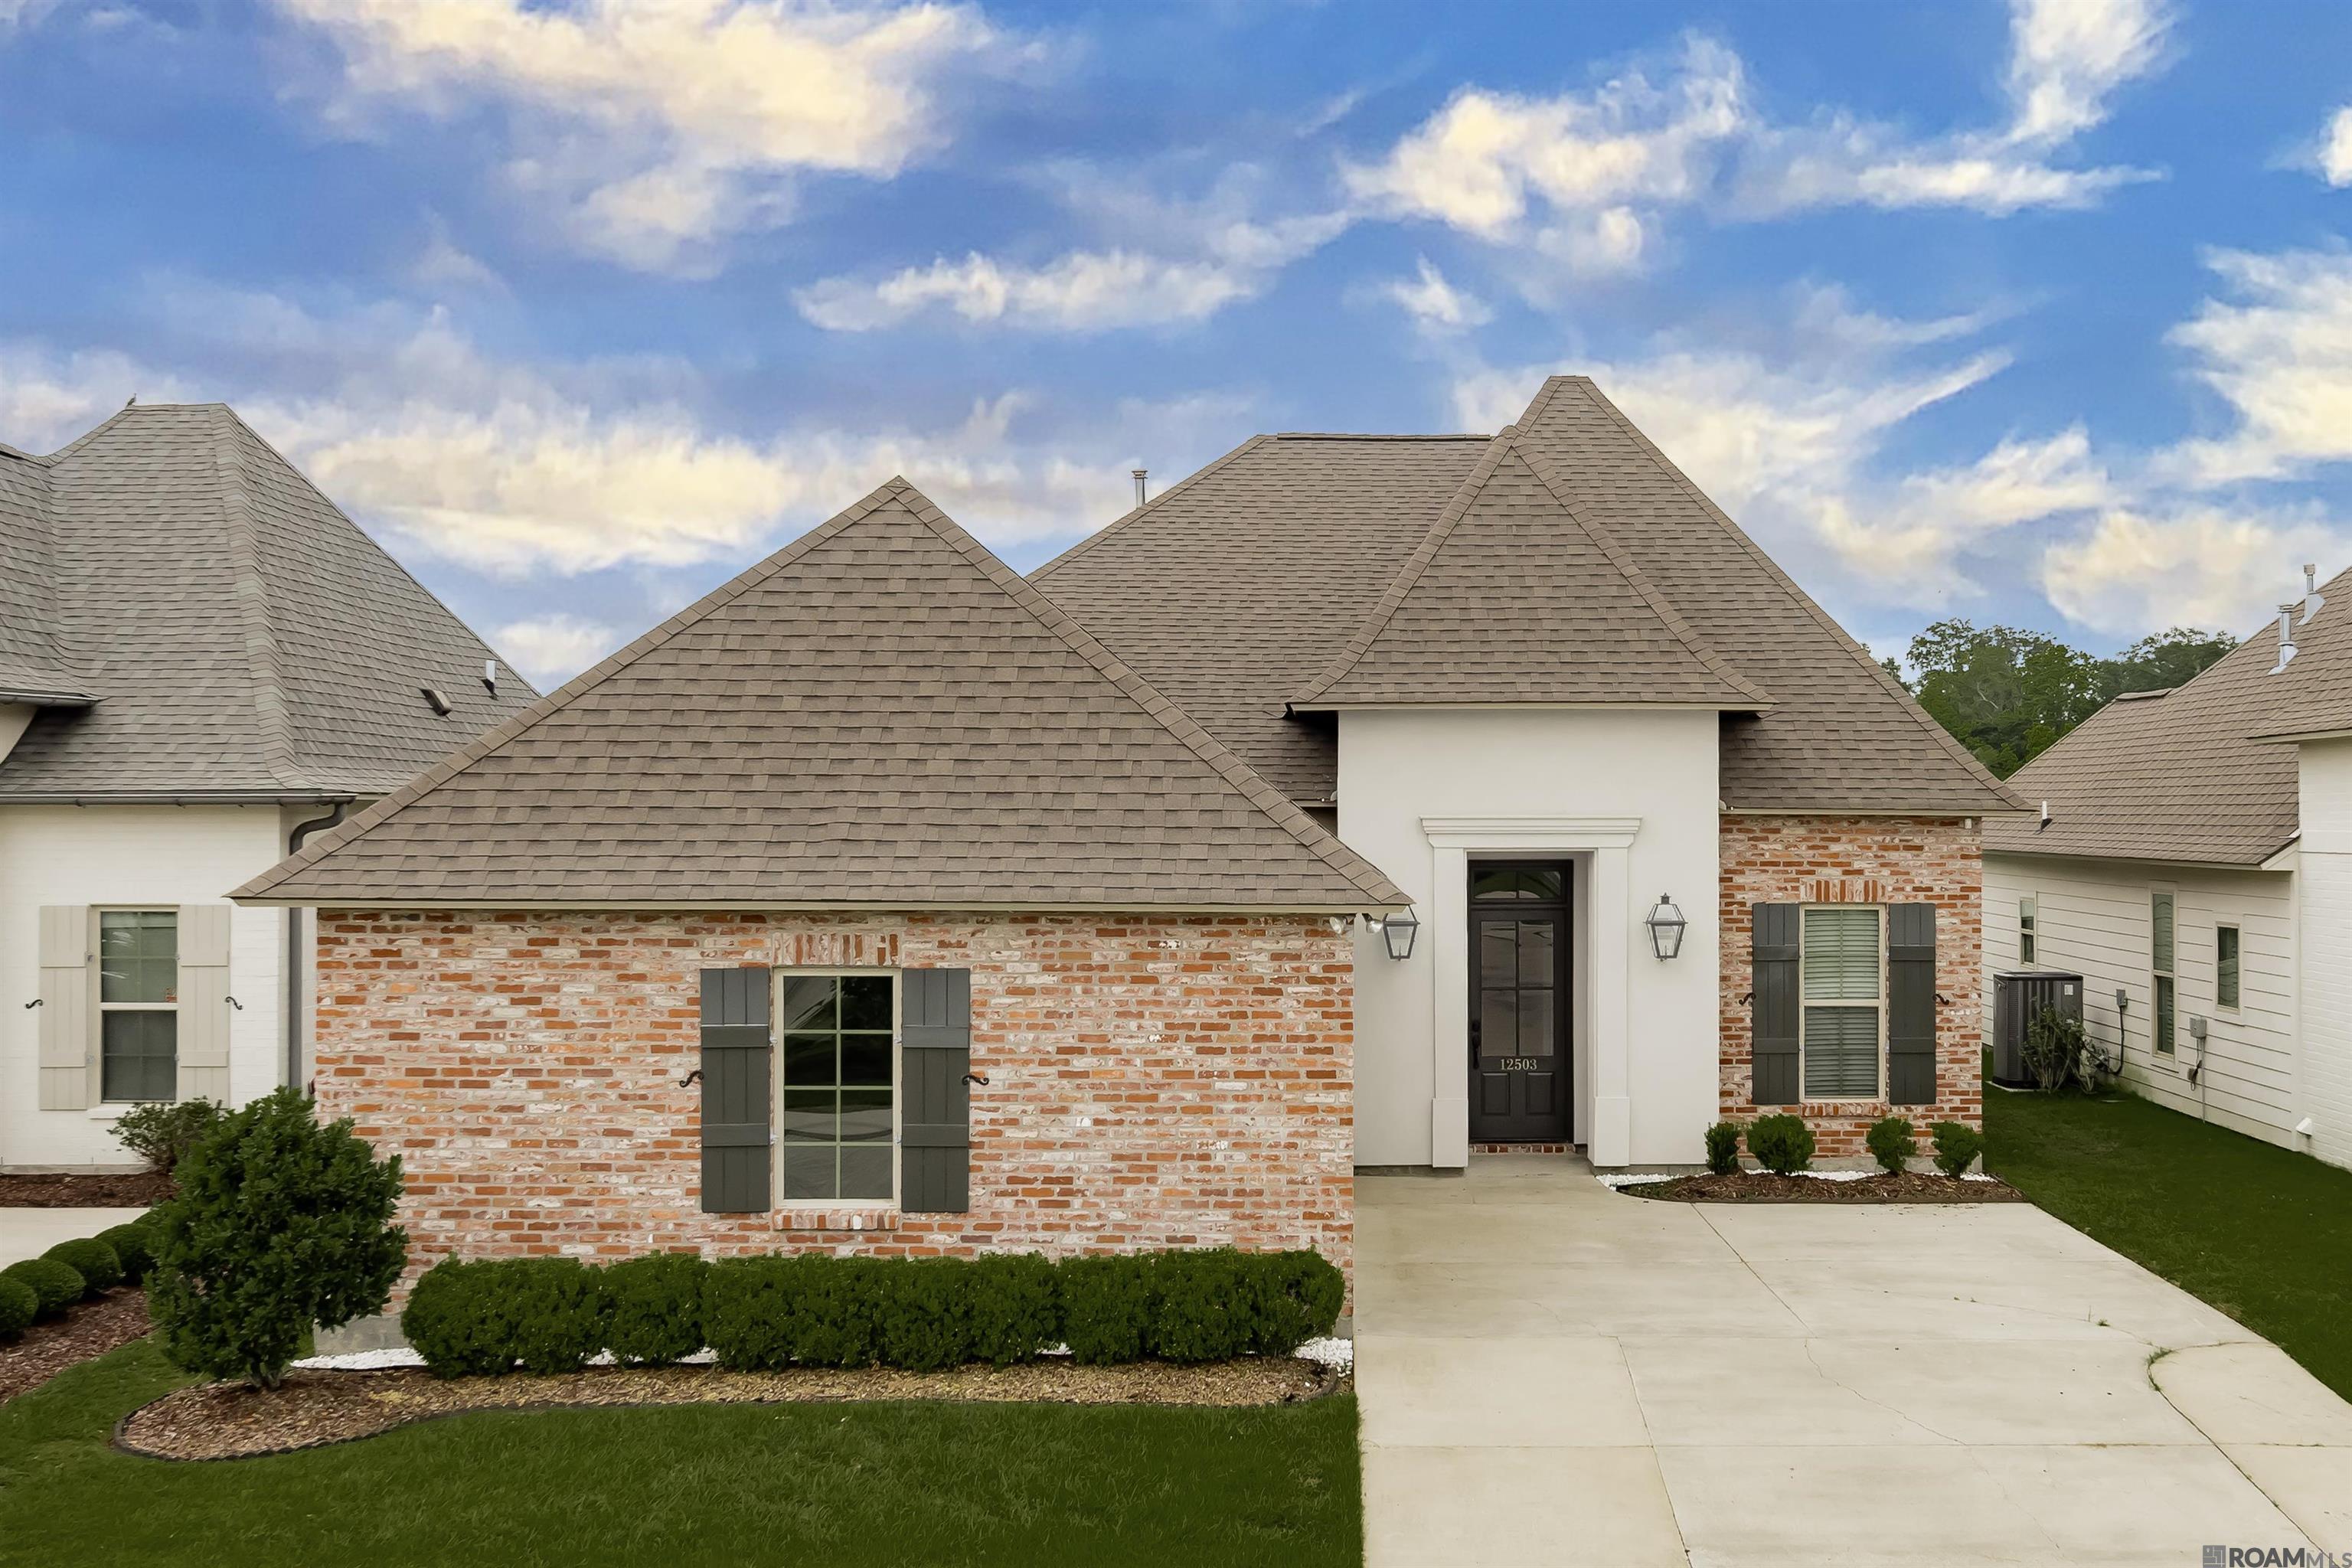
Active
$399,999
4
bds
|
3
ba
|
2,038
sqft
|
built
2018
12503 Great Tern Ave, Baton Rouge, LA 70810
$-196
Cash flow
-2.6%
Cash-on-Cash Return
5.7%
Cap rate
0.7%
Rent to Value Ratio
Active
$697,000
4
bds
|
4
ba
|
2,659
sqft
|
built
2020
5341 Mimosa St, Baton Rouge, LA 70808
$-391
Cash flow
-2.9%
Cash-on-Cash Return
5.6%
Cap rate
0.7%
Rent to Value Ratio
Active
$210,000
2
bds
|
2
ba
|
1,218
sqft
|
built
1981
15474 Springwood Ave, Baton Rouge, LA 70817
$-68
Cash flow
-1.7%
Cash-on-Cash Return
5.9%
Cap rate
0.7%
Rent to Value Ratio
Active
$215,000
3
bds
|
2
ba
|
1,316
sqft
|
built
1977
10734 Big Sur Dr, Baton Rouge, LA 70818
$-22
Cash flow
-0.5%
Cash-on-Cash Return
6.2%
Cap rate
0.7%
Rent to Value Ratio
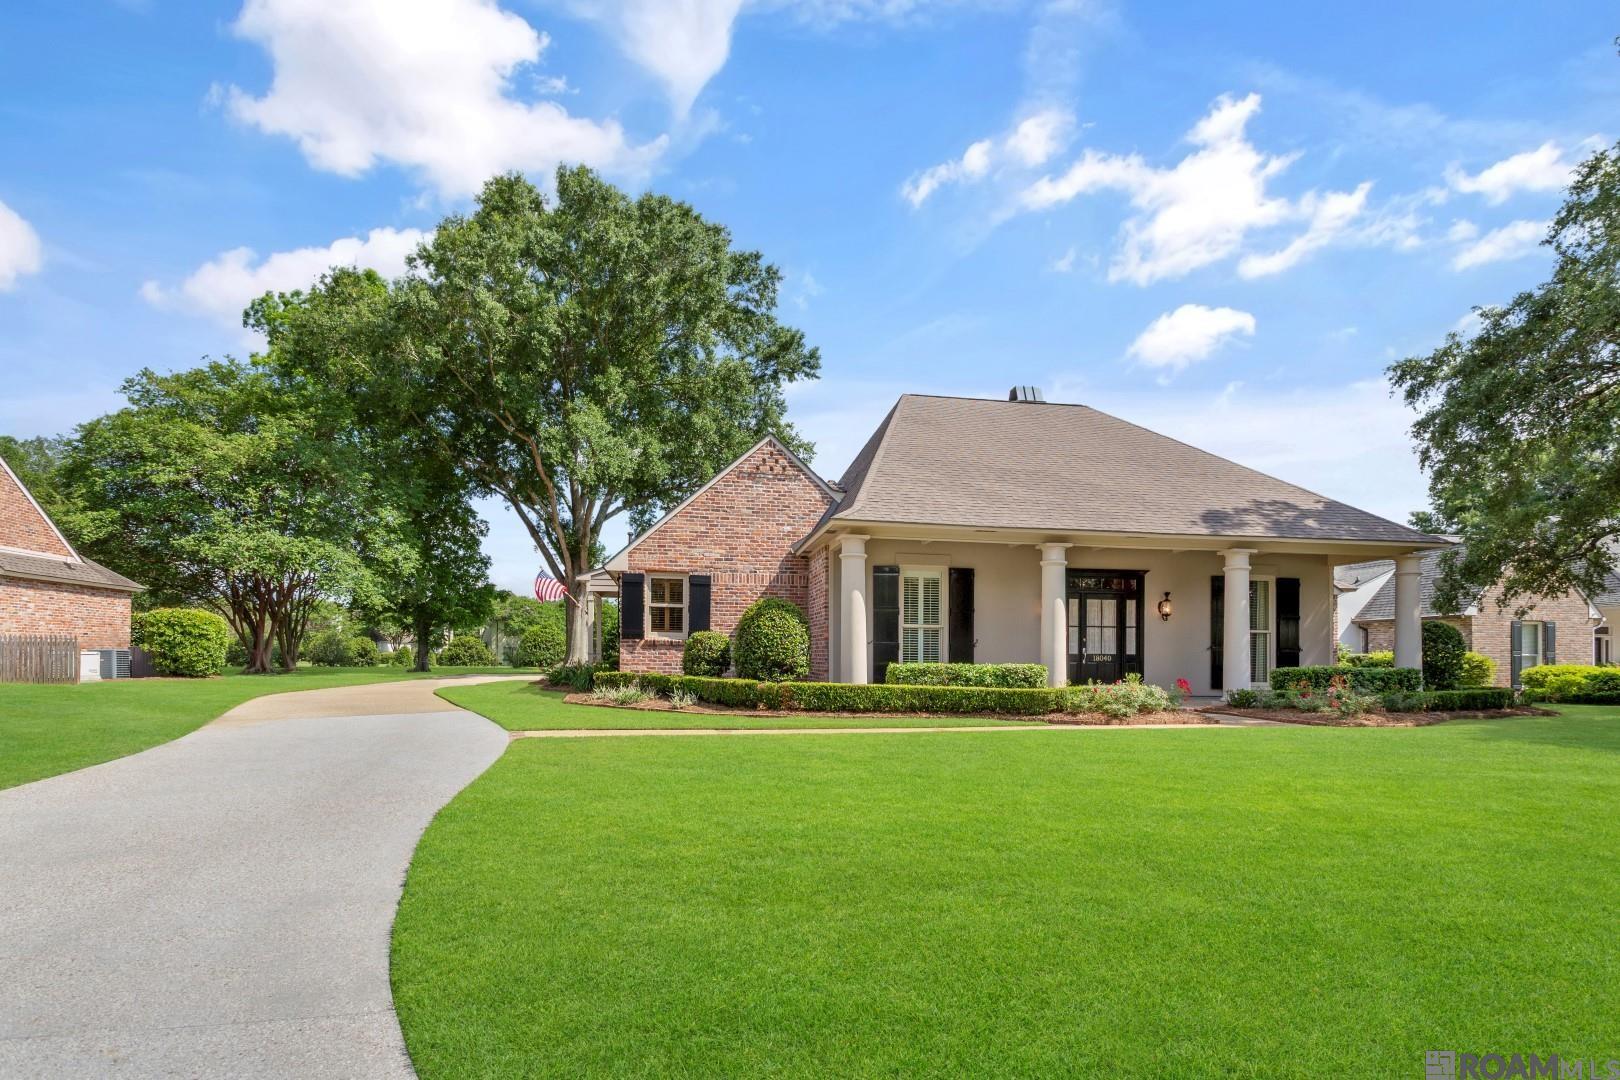
Active
$824,900
4
bds
|
3
ba
|
3,500
sqft
|
built
1990
18040 Cascades Ave, Baton Rouge, LA 70810
$-2,111
Cash flow
-13.4%
Cash-on-Cash Return
3.2%
Cap rate
0.4%
Rent to Value Ratio
Active
$125,000
3
bds
|
2
ba
|
1,401
sqft
|
built
1983
3231 King Bradford Dr, Baton Rouge, LA 70816
$311
Cash flow
13.0%
Cash-on-Cash Return
9.3%
Cap rate
1.1%
Rent to Value Ratio
Active
$529,000
4
bds
|
3
ba
|
3,329
sqft
|
built
1975
745 Kenilworth Pkwy, Baton Rouge, LA 70808
$-1,045
Cash flow
-10.3%
Cash-on-Cash Return
3.9%
Cap rate
0.5%
Rent to Value Ratio

Active
$387,500
3
bds
|
3
ba
|
2,632
sqft
|
built
1972
11358 Lazy Lake Dr, Baton Rouge, LA 70818
$-442
Cash flow
-6.0%
Cash-on-Cash Return
4.9%
Cap rate
0.6%
Rent to Value Ratio

Active
$187,000
2
bds
|
1
ba
|
1,031
sqft
|
built
1957
2412 Horace St, Baton Rouge, LA 70808
$-82
Cash flow
-2.3%
Cash-on-Cash Return
5.8%
Cap rate
0.7%
Rent to Value Ratio
Active
$825,000
4
bds
|
4
ba
|
3,281
sqft
|
built
1940
1155 Richland Ave, Baton Rouge, LA 70806
$-1,146
Cash flow
-7.2%
Cash-on-Cash Return
4.6%
Cap rate
0.6%
Rent to Value Ratio

Active
$589,000
4
bds
|
3
ba
|
2,503
sqft
|
built
1991
7530 Old Sturbridge Ln, Baton Rouge, LA 70806
$-1,888
Cash flow
-16.7%
Cash-on-Cash Return
2.4%
Cap rate
0.3%
Rent to Value Ratio

Active
$315,000
3
bds
|
3
ba
|
2,625
sqft
|
built
2009
2009 Lac Cache Ct, Baton Rouge, LA 70816
$-378
Cash flow
-6.3%
Cash-on-Cash Return
4.8%
Cap rate
0.6%
Rent to Value Ratio
Active
$229,000
3
bds
|
2
ba
|
1,375
sqft
|
built
1976
1884 Mullen Dr, Baton Rouge, LA 70810
$-233
Cash flow
-5.3%
Cash-on-Cash Return
5.1%
Cap rate
0.6%
Rent to Value Ratio
Active
$39,900
4
bds
|
1
ba
|
1,000
sqft
|
built
1973
432 Roselawn Ave, Baton Rouge, LA 70806
$621
Cash flow
18.1%
Cash-on-Cash Return
18.7%
Cap rate
2.3%
Rent to Value Ratio
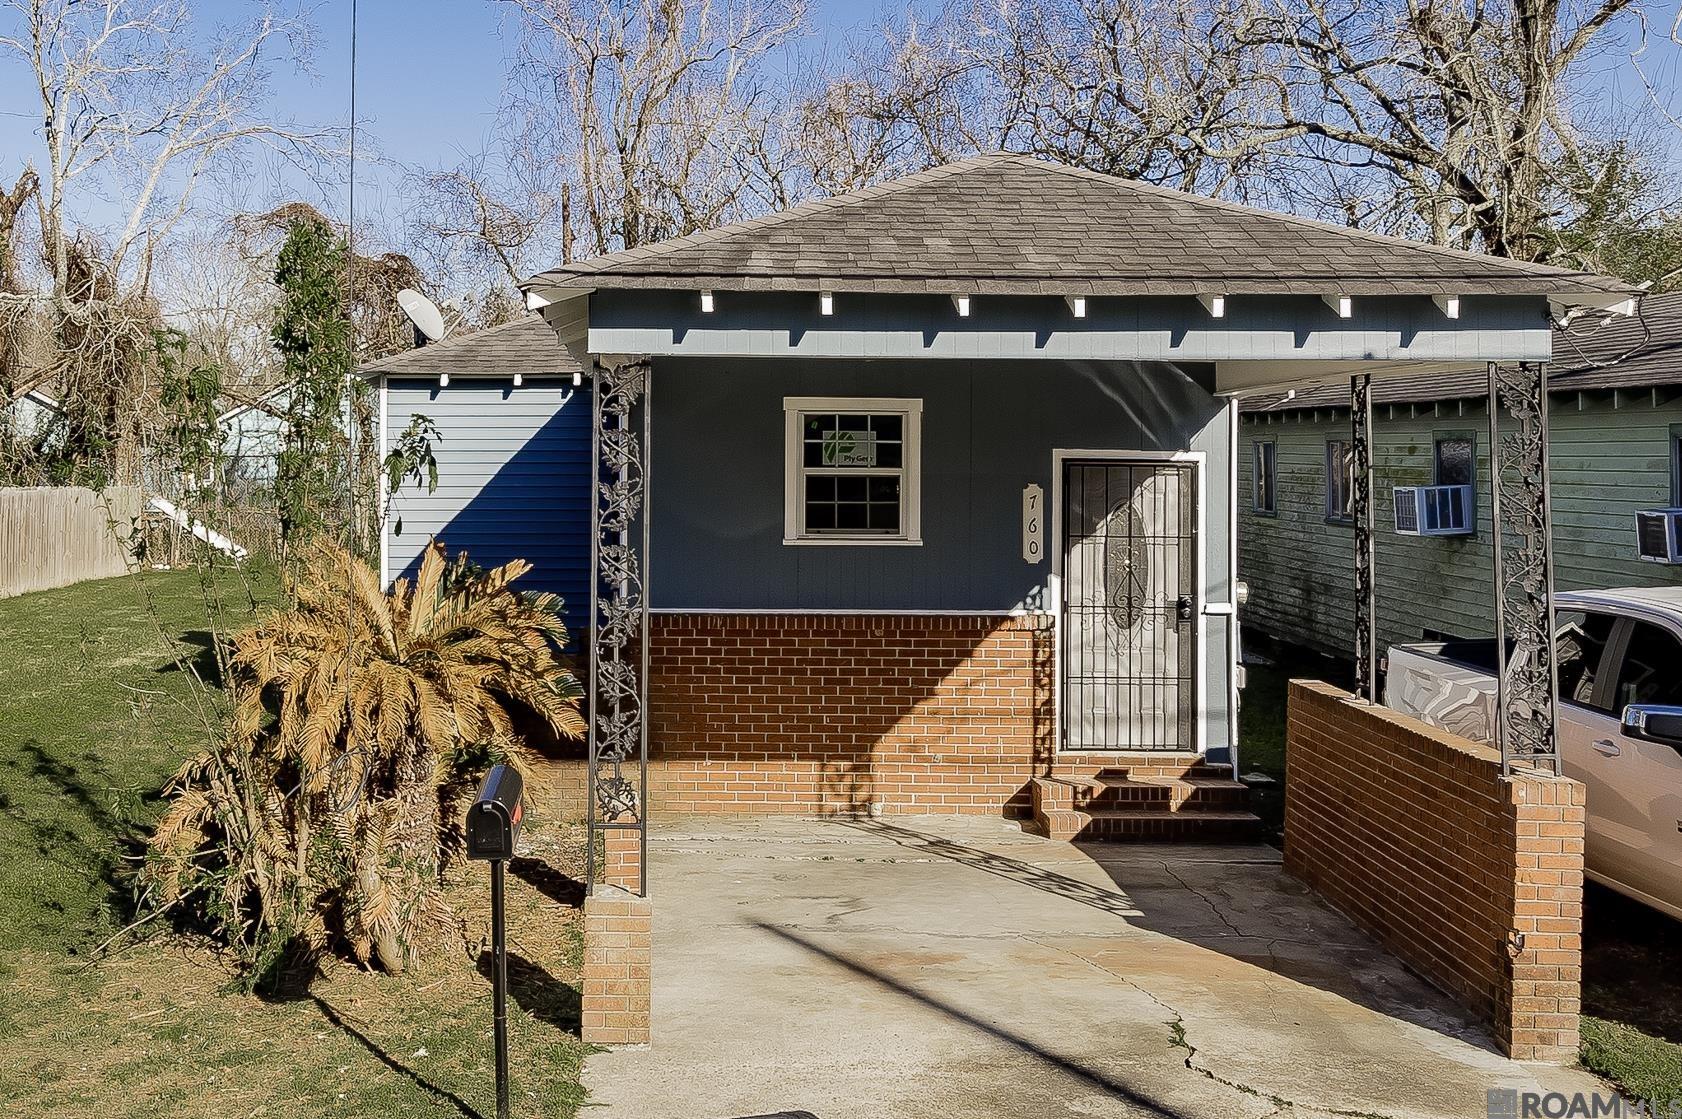
Active
$130,000
2
bds
|
2
ba
|
1,135
sqft
|
built
1964
760 N 29th St, Baton Rouge, LA 70802
$9
Cash flow
0.4%
Cash-on-Cash Return
6.4%
Cap rate
0.8%
Rent to Value Ratio

Active
$490,000
3
bds
|
2
ba
|
2,638
sqft
|
built
1916
2122 Government St, Baton Rouge, LA 70806
$-427
Cash flow
-4.5%
Cash-on-Cash Return
5.2%
Cap rate
0.6%
Rent to Value Ratio
Active
$400,000
4
bds
|
3
ba
|
2,331
sqft
|
built
1968
327 Marion Dr, Baton Rouge, LA 70806
$-163
Cash flow
-2.1%
Cash-on-Cash Return
5.8%
Cap rate
0.7%
Rent to Value Ratio
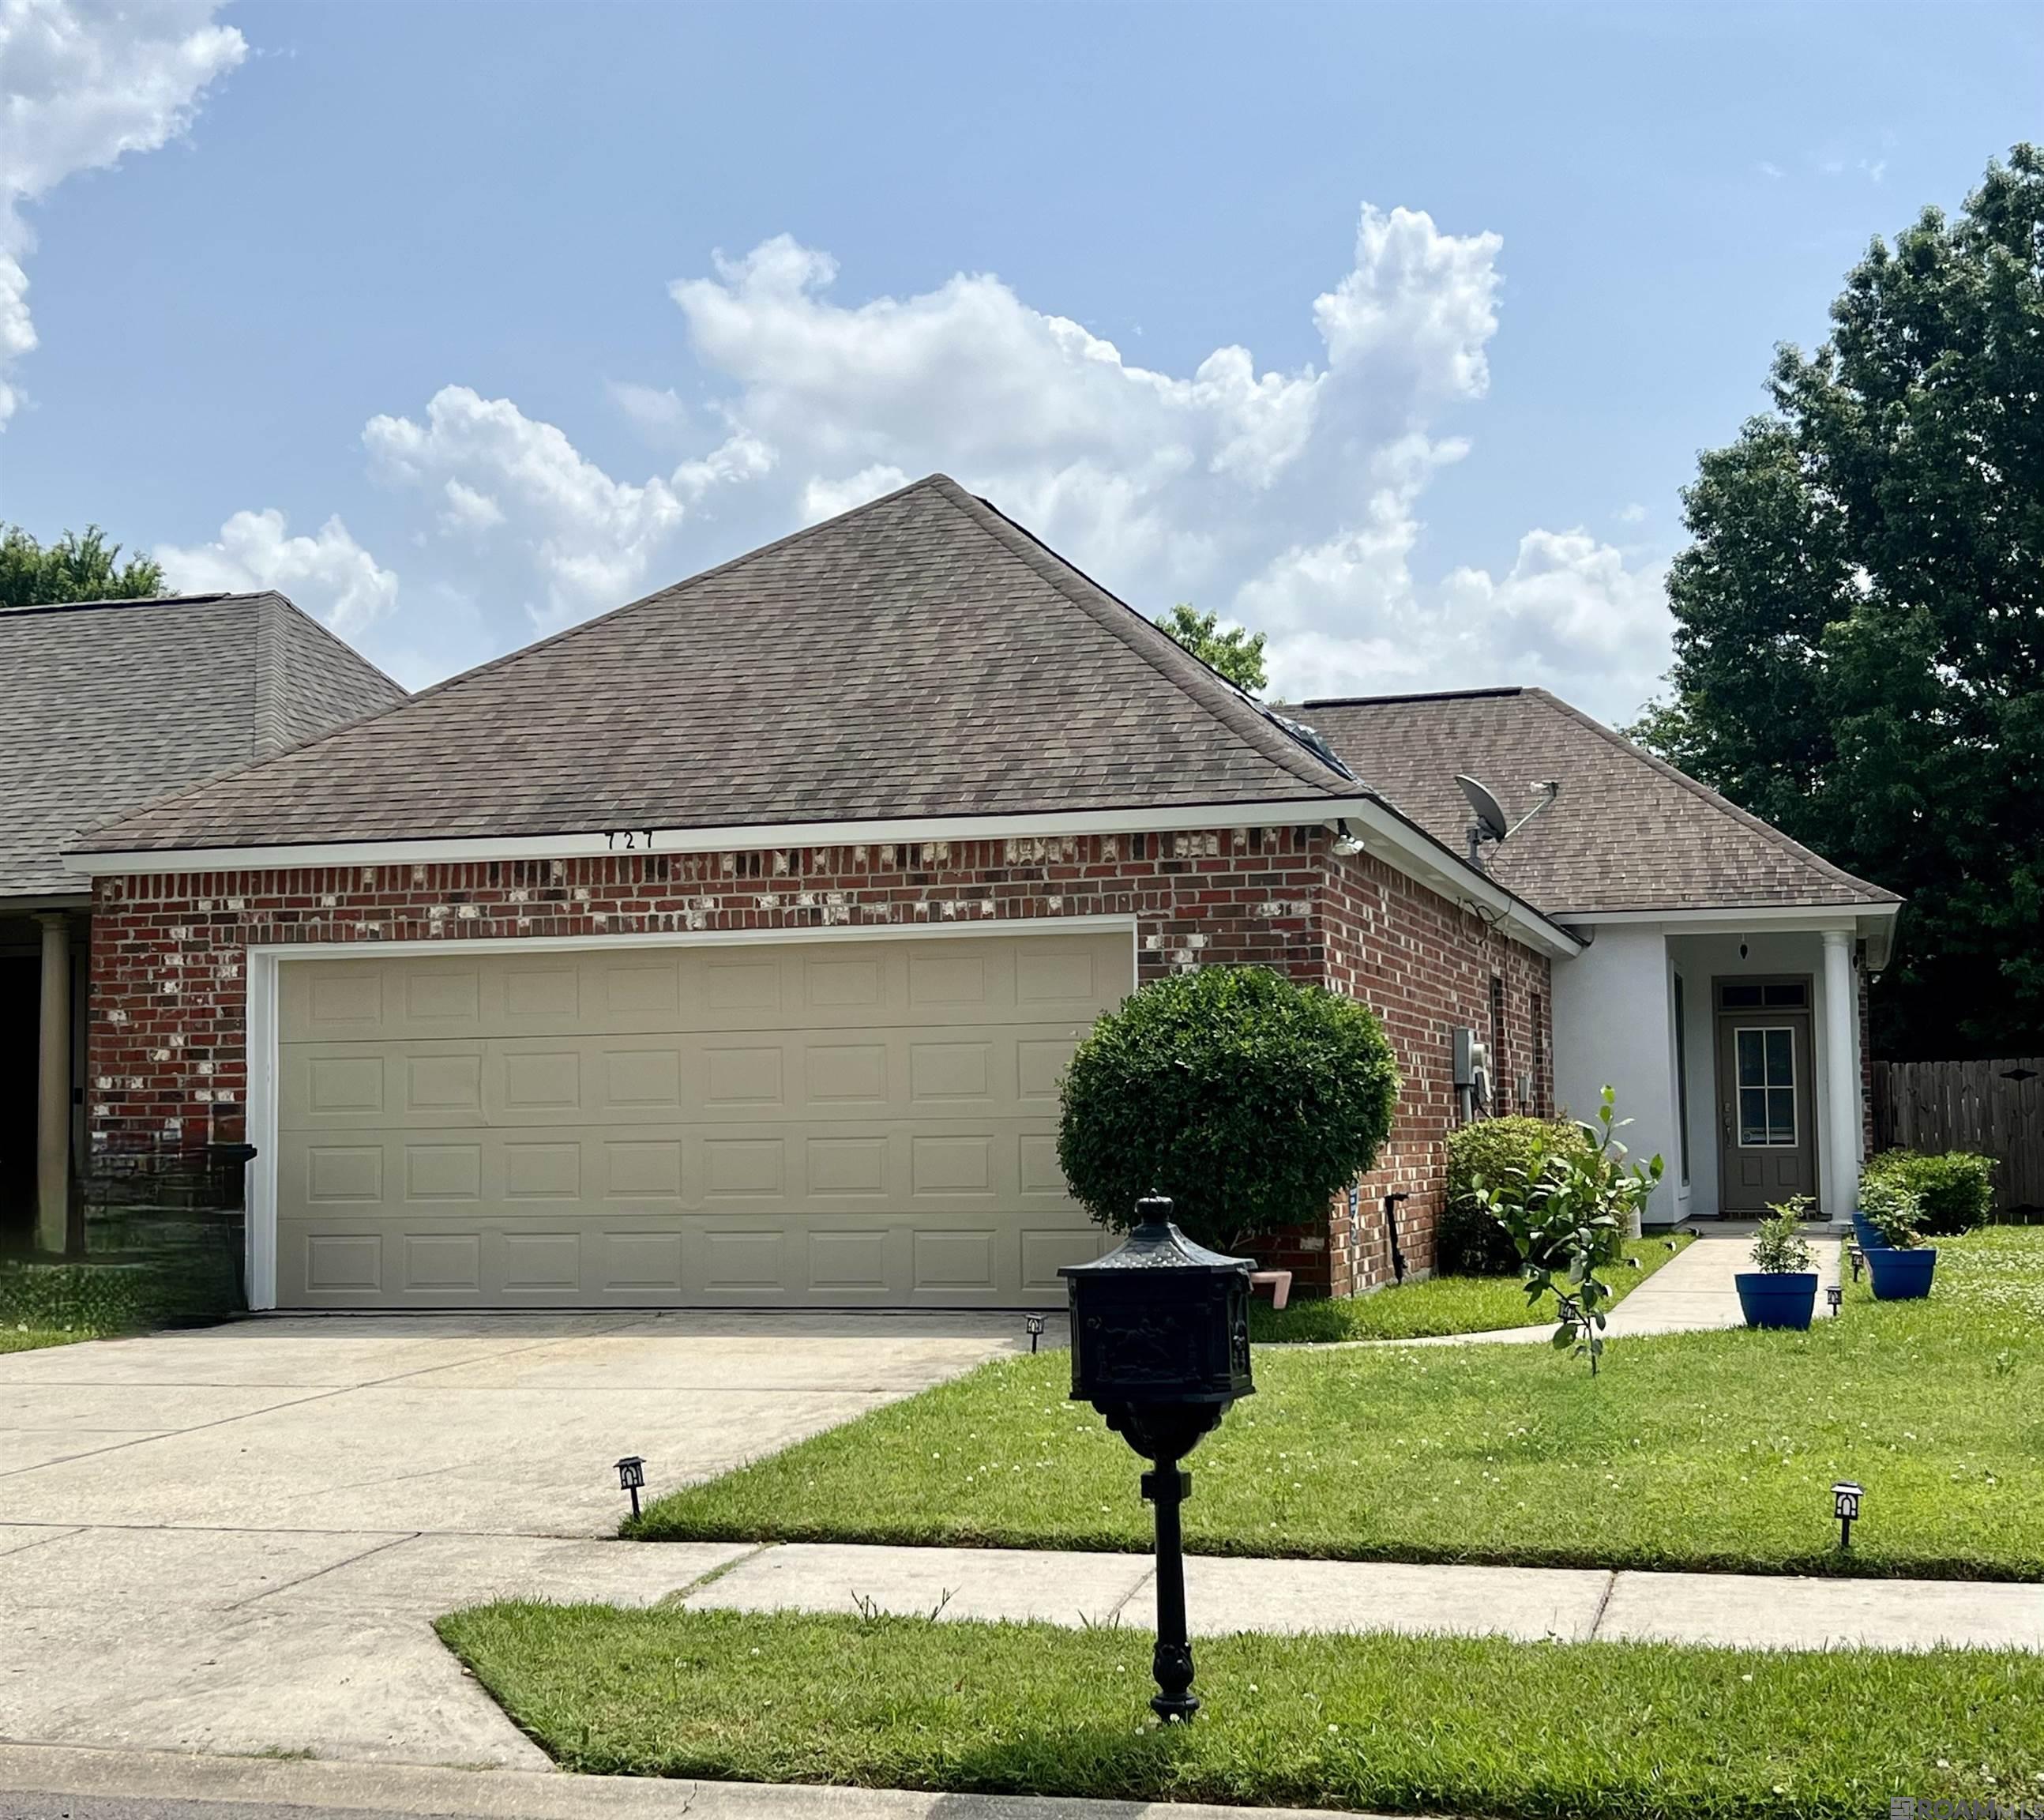
Active
$259,000
3
bds
|
2
ba
|
1,460
sqft
|
built
2006
727 Summer Breeze Dr, Baton Rouge, LA 70810
$-80
Cash flow
-1.6%
Cash-on-Cash Return
5.9%
Cap rate
0.7%
Rent to Value Ratio
Active
$320,000
4
bds
|
3
ba
|
2,668
sqft
|
built
1927
1924 Cherokee St, Baton Rouge, LA 70806
$49
Cash flow
0.8%
Cash-on-Cash Return
6.5%
Cap rate
0.8%
Rent to Value Ratio
Active
$499,000
4
bds
|
3
ba
|
3,225
sqft
|
built
1983
1839 Applewood Rd, Baton Rouge, LA 70808
$-378
Cash flow
-4.0%
Cash-on-Cash Return
5.4%
Cap rate
0.7%
Rent to Value Ratio
Active
$349,000
3
bds
|
3
ba
|
2,717
sqft
|
built
2000
12053 Foxshire Ct, Baton Rouge, LA 70815
$-270
Cash flow
-4.0%
Cash-on-Cash Return
5.4%
Cap rate
0.7%
Rent to Value Ratio
Active
$1,100,000
4
bds
|
5
ba
|
4,576
sqft
|
built
1992
18946 Lake Harbour Ave, Baton Rouge, LA 70816
$-3,250
Cash flow
-15.4%
Cash-on-Cash Return
2.7%
Cap rate
0.4%
Rent to Value Ratio
Active
$1,149,000
4
bds
|
4
ba
|
3,286
sqft
|
built
1926
6038 Jefferson Hwy, Baton Rouge, LA 70806
$-2,636
Cash flow
-12.0%
Cash-on-Cash Return
3.5%
Cap rate
0.4%
Rent to Value Ratio
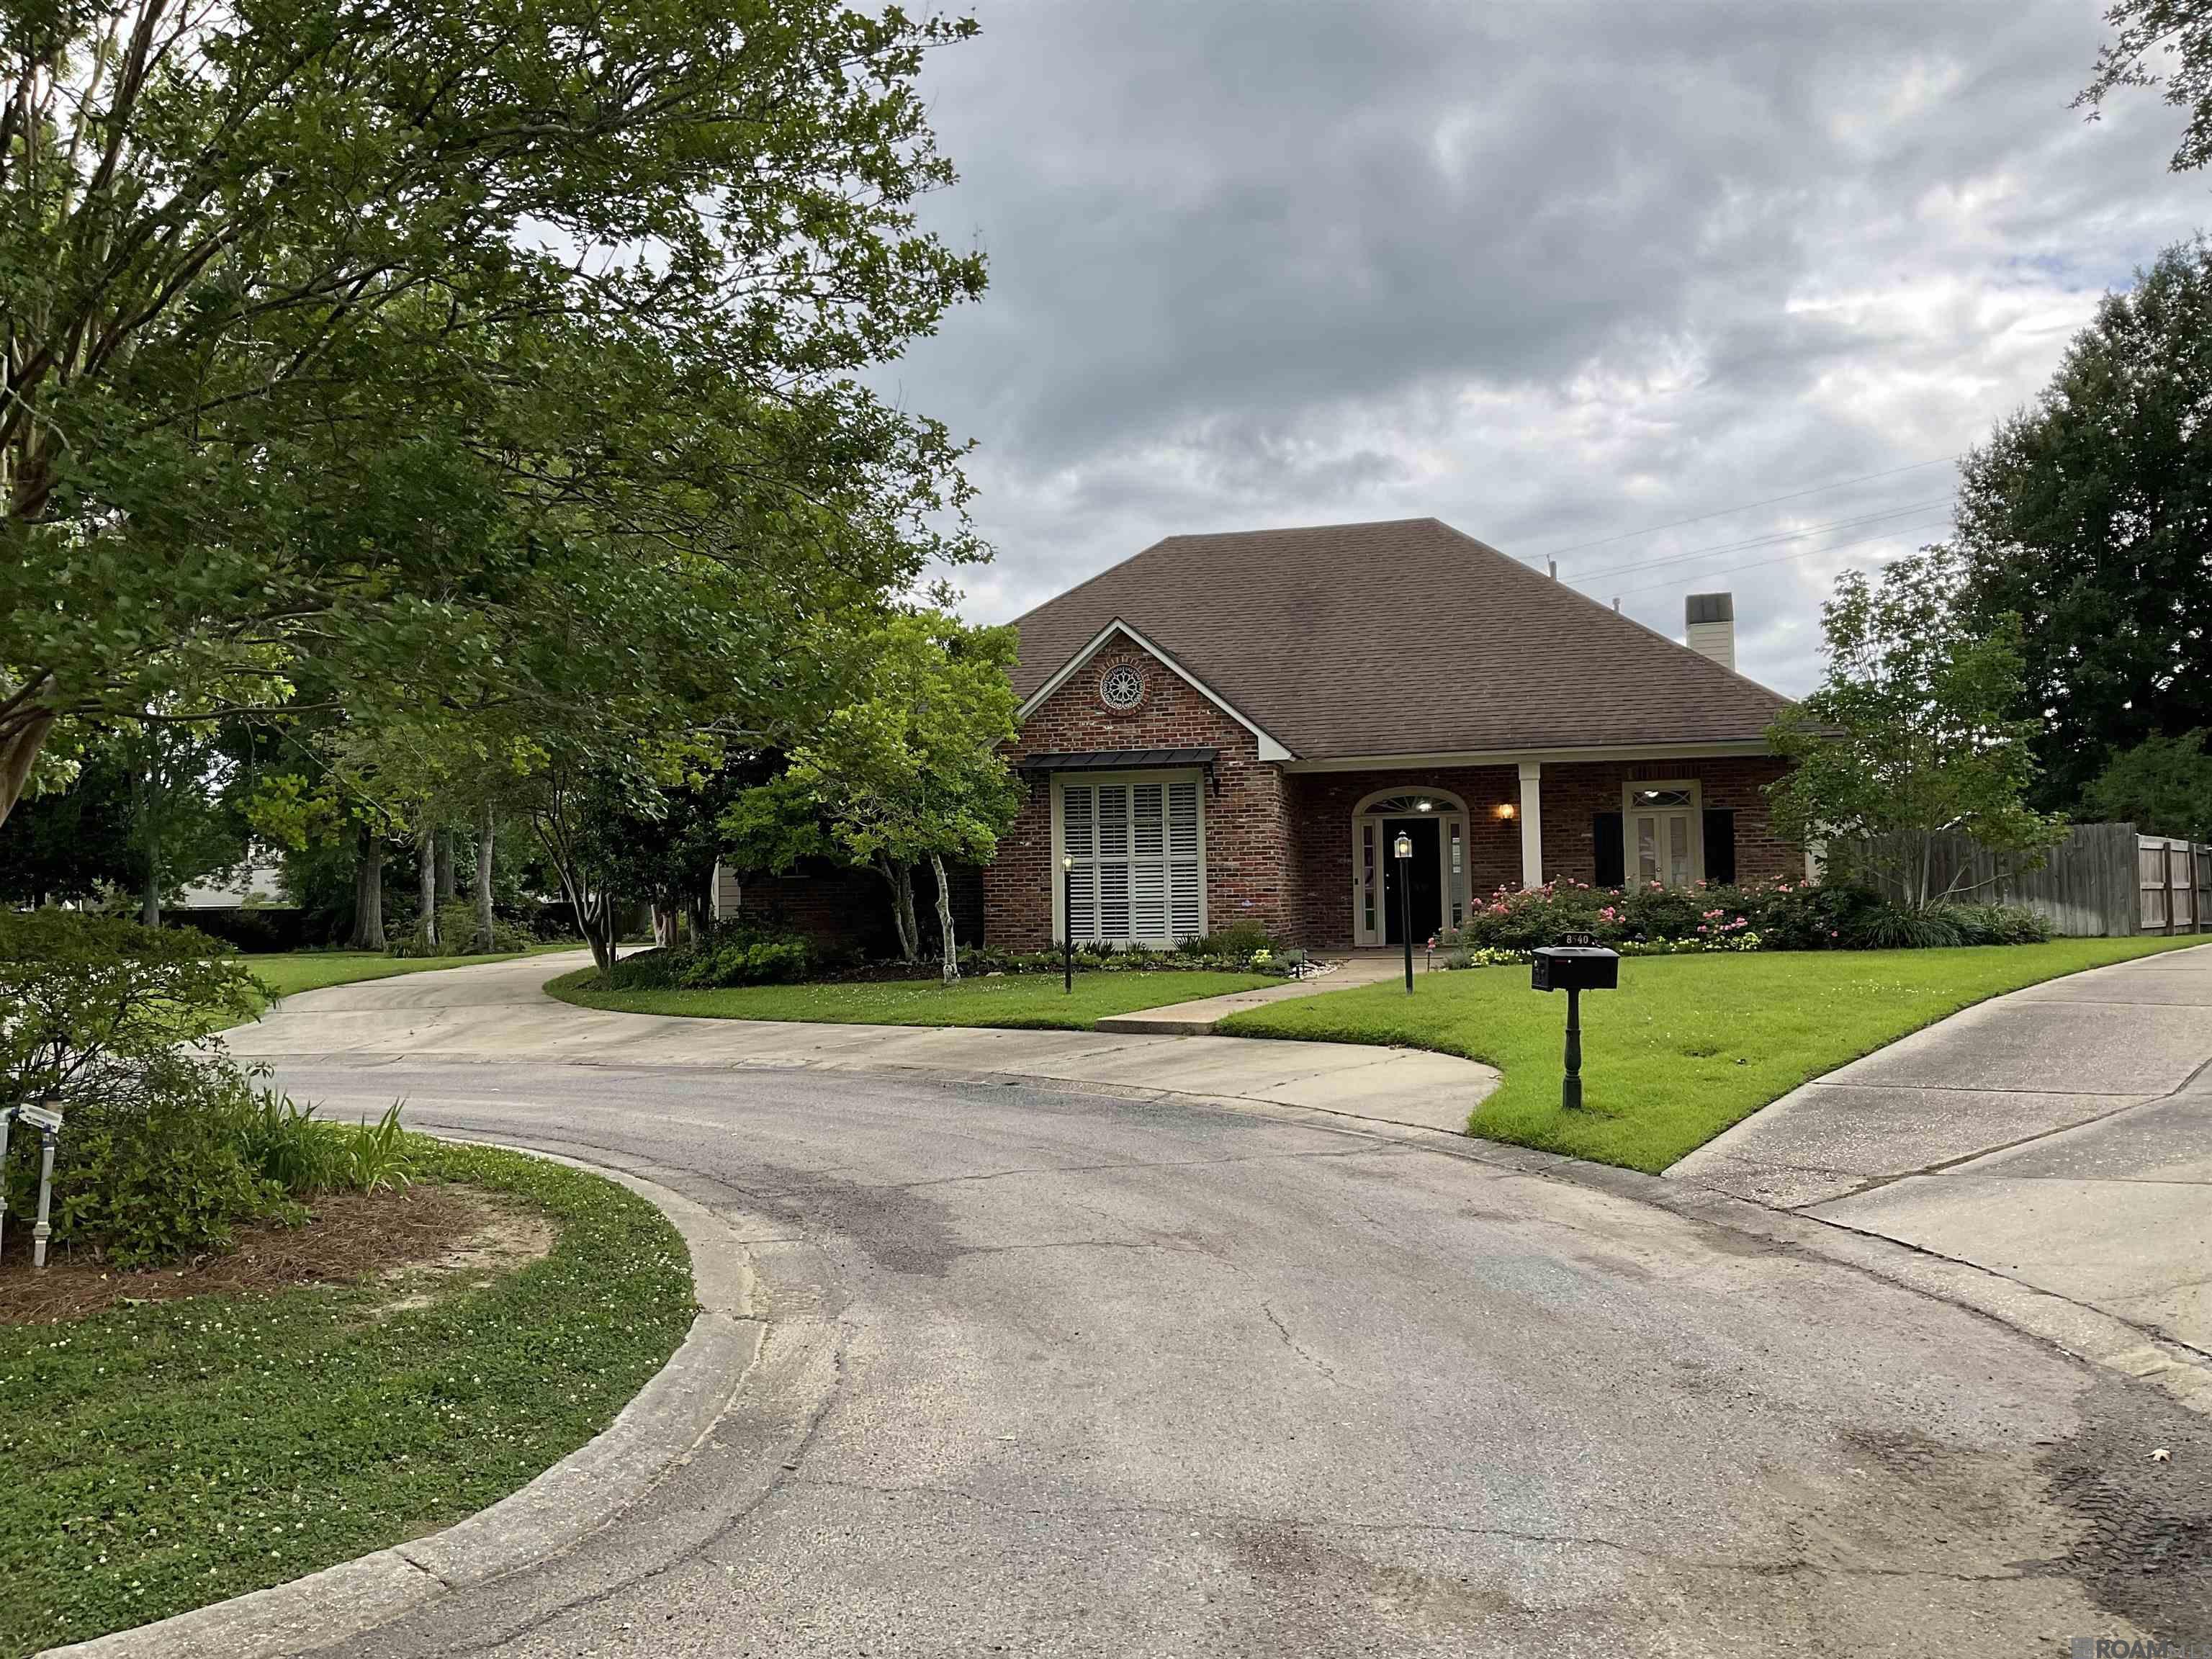
Active
$625,000
4
bds
|
3
ba
|
2,775
sqft
|
built
1996
8540 Mosswood Ave, Baton Rouge, LA 70810
$-1,362
Cash flow
-11.4%
Cash-on-Cash Return
3.7%
Cap rate
0.4%
Rent to Value Ratio
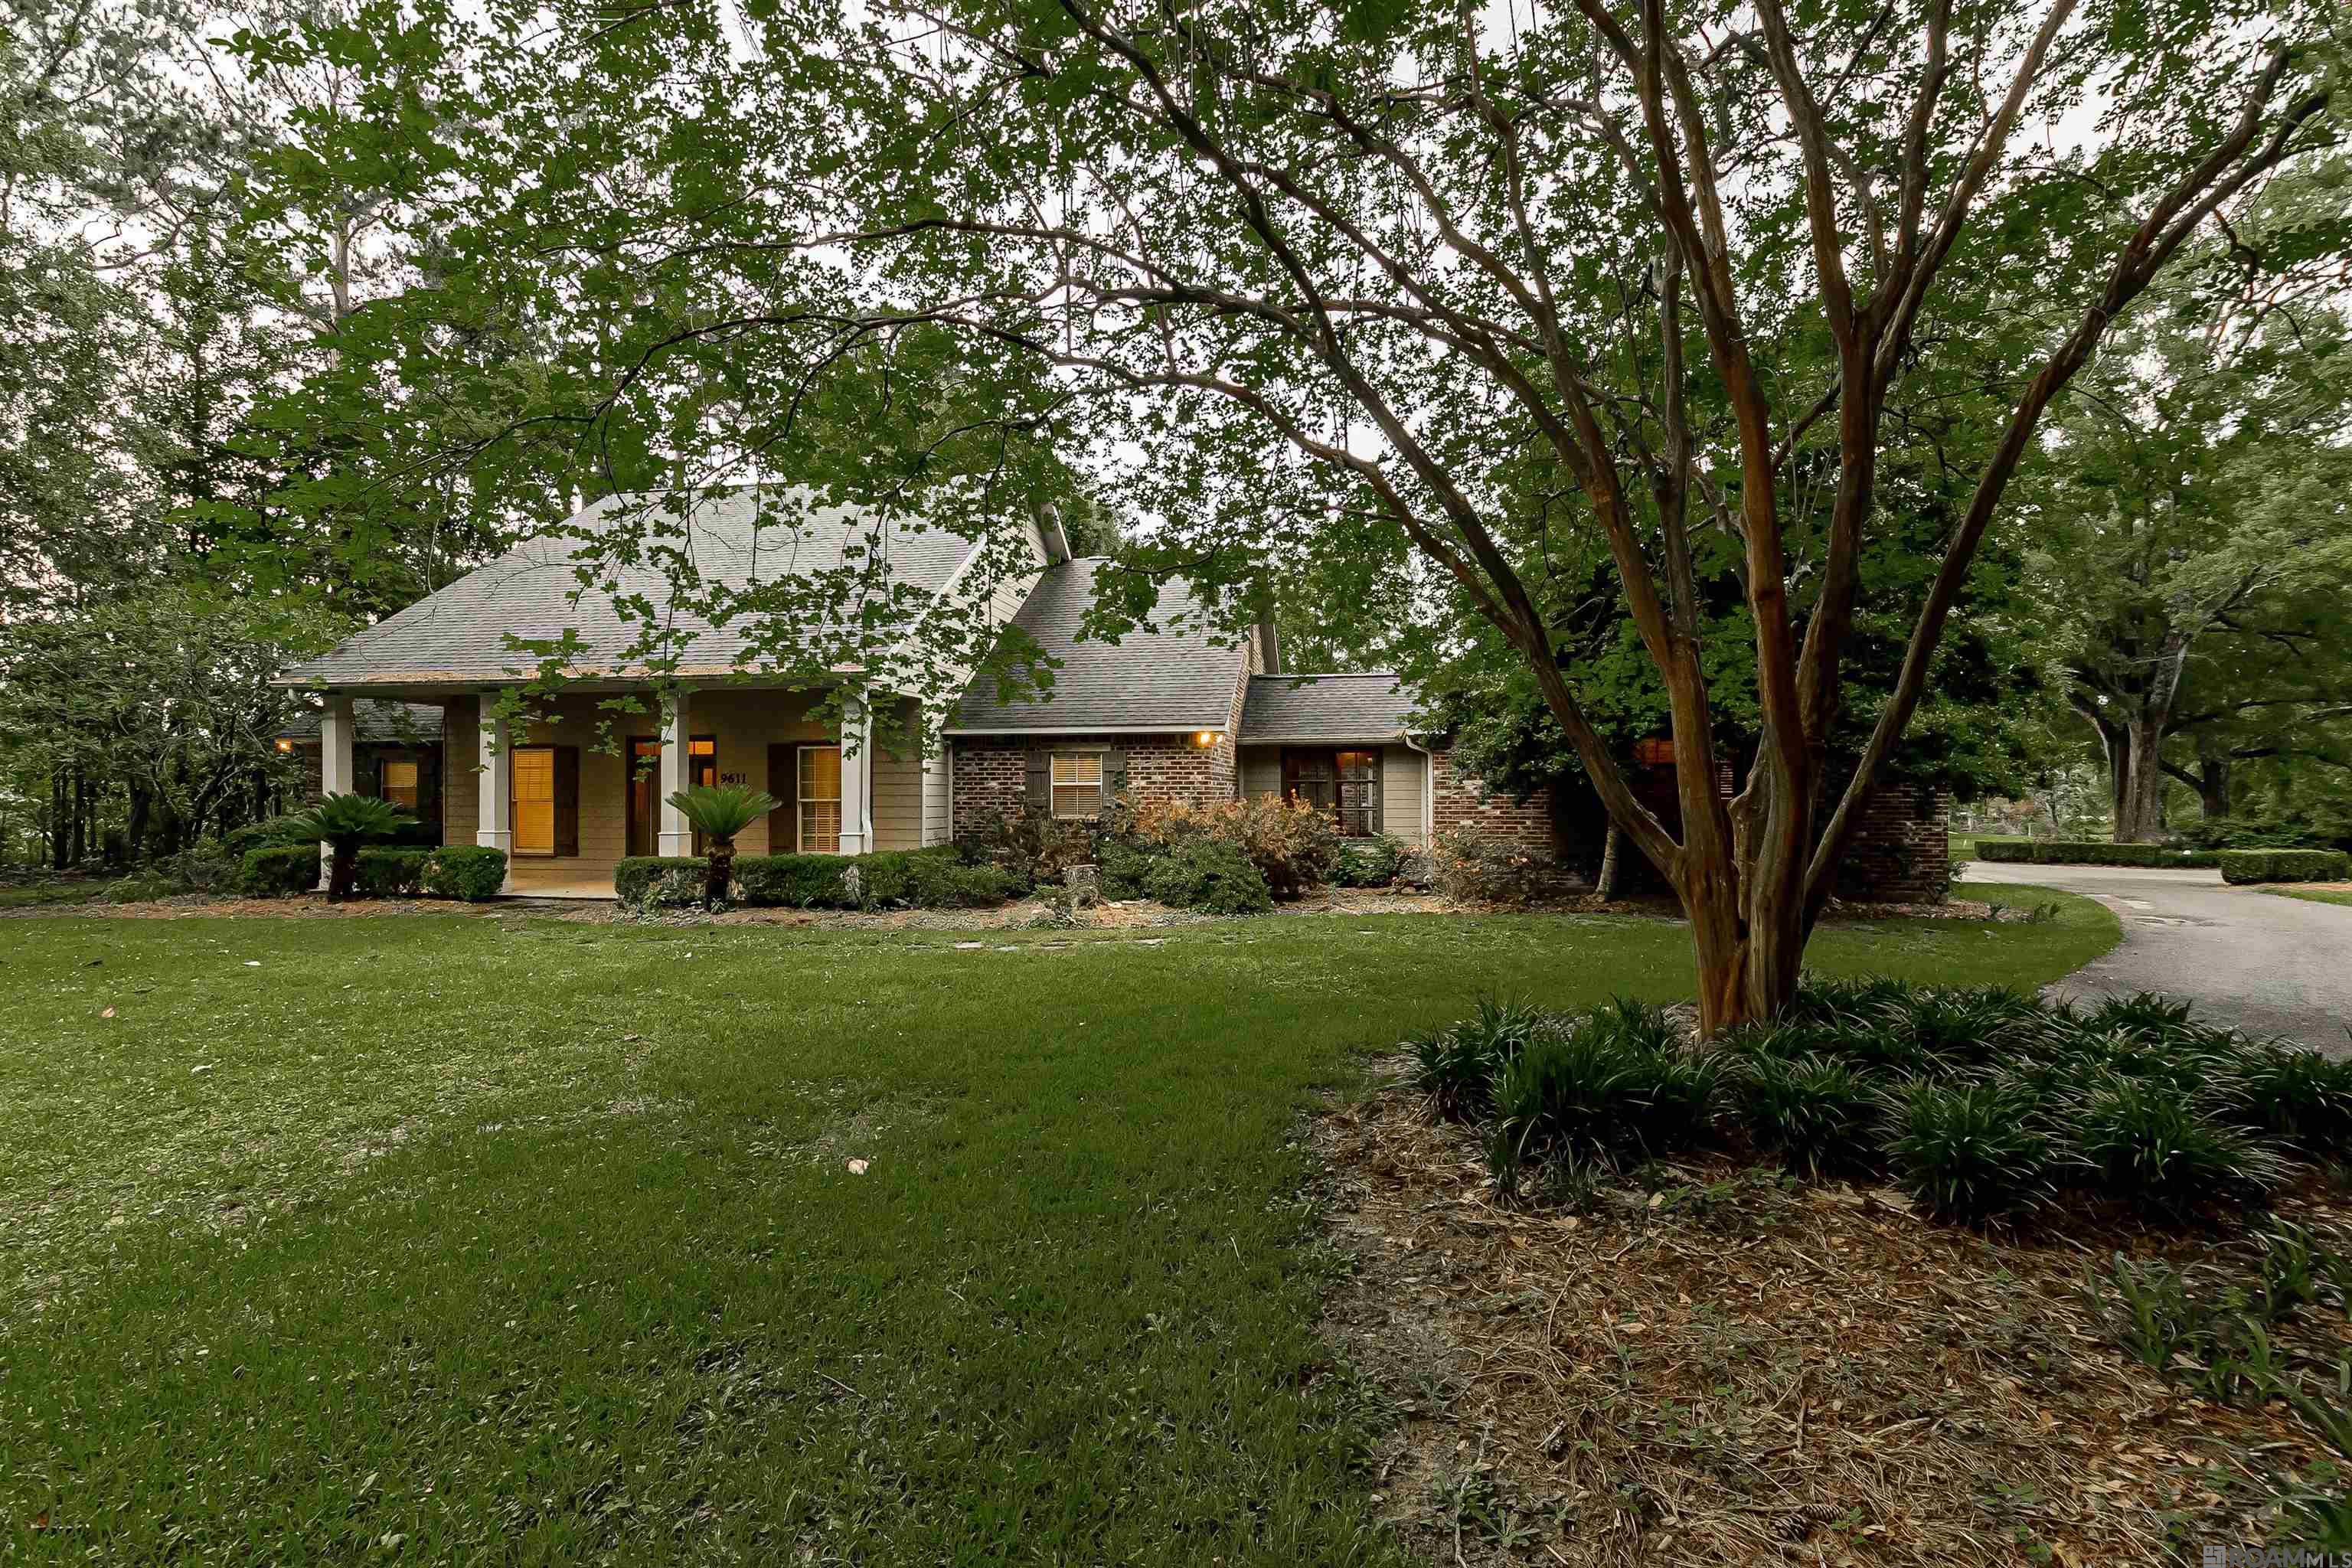
Active
$615,000
3
bds
|
3
ba
|
3,158
sqft
|
built
2001
9611 Barringer Foreman Rd, Baton Rouge, LA 70809
$-1,289
Cash flow
-10.9%
Cash-on-Cash Return
3.8%
Cap rate
0.5%
Rent to Value Ratio
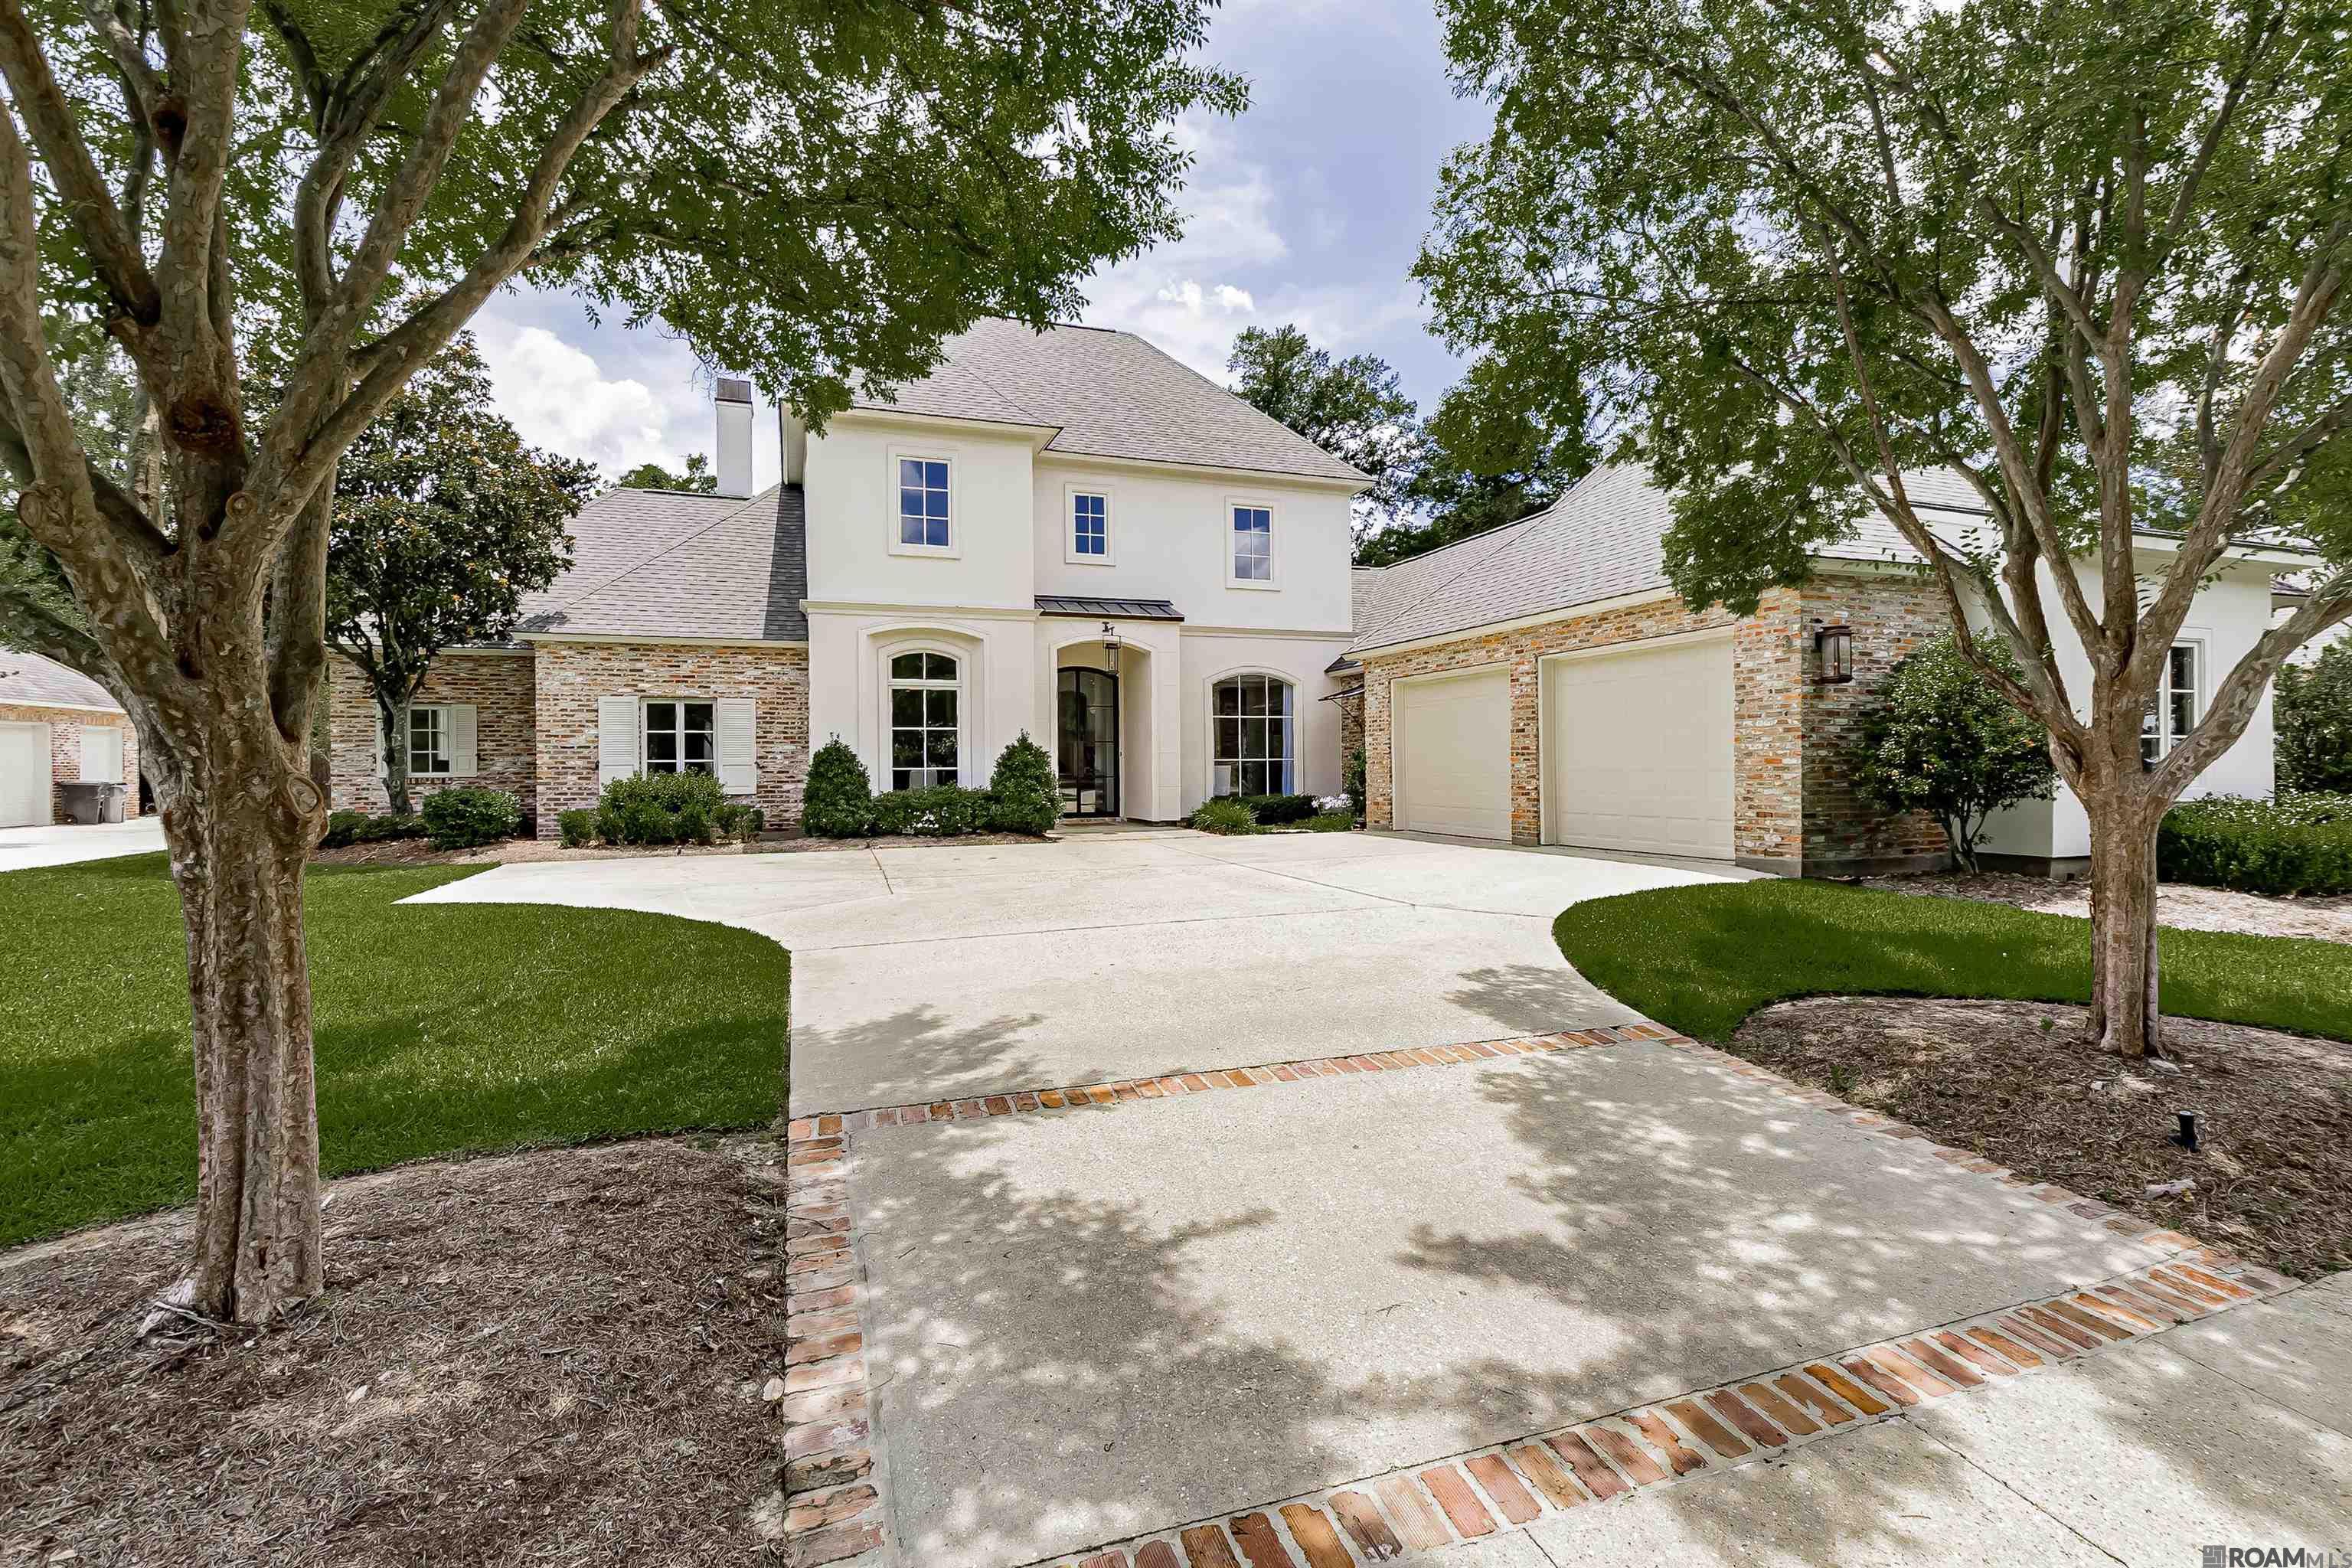
Active
$1,479,000
5
bds
|
4
ba
|
4,982
sqft
|
built
2006
9806 Myrtle Ln, Baton Rouge, LA 70810
$-2,329
Cash flow
-8.2%
Cash-on-Cash Return
4.4%
Cap rate
0.5%
Rent to Value Ratio
Active
$712,000
4
bds
|
4
ba
|
2,825
sqft
|
built
1955
1735 Rosemont Dr, Baton Rouge, LA 70808
$-2,349
Cash flow
-17.2%
Cash-on-Cash Return
2.3%
Cap rate
0.3%
Rent to Value Ratio