Baton Rouge, LA Investment Properties for Sale
Browse homes for sale and investment properties in Baton Rouge, LA. Refine your search by price, property type, or more.
Best cash flowing properties in Baton Rouge, LA

Active
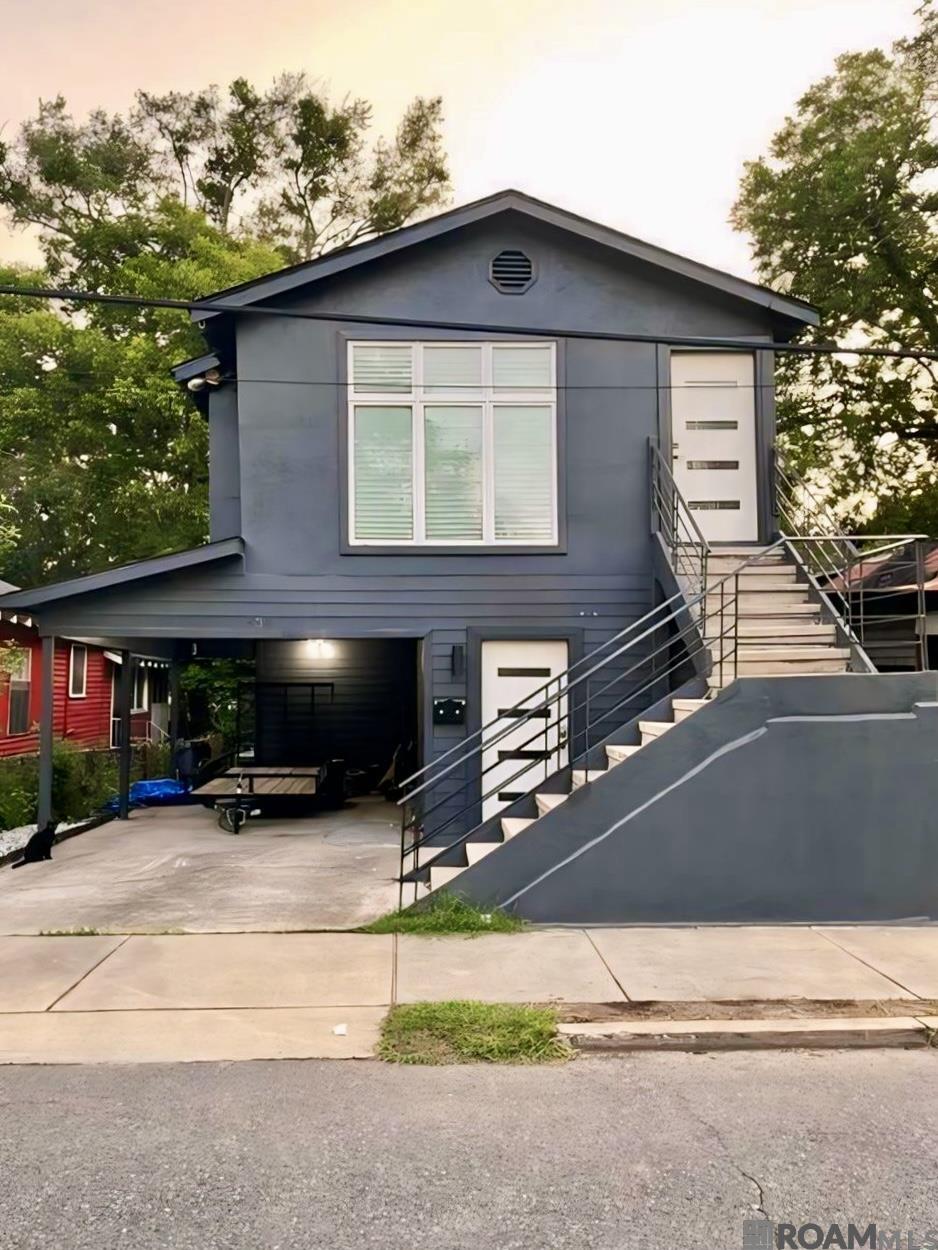
$29,900
bds
|
0
ba
|
1,776
sqft
|
built
2743 Linwood St, Baton Rouge, LA 70805
$897
Cash flow
35.0%
Cash-on-Cash Return
36.0%
Cap rate
4.3%
Rent to Value Ratio
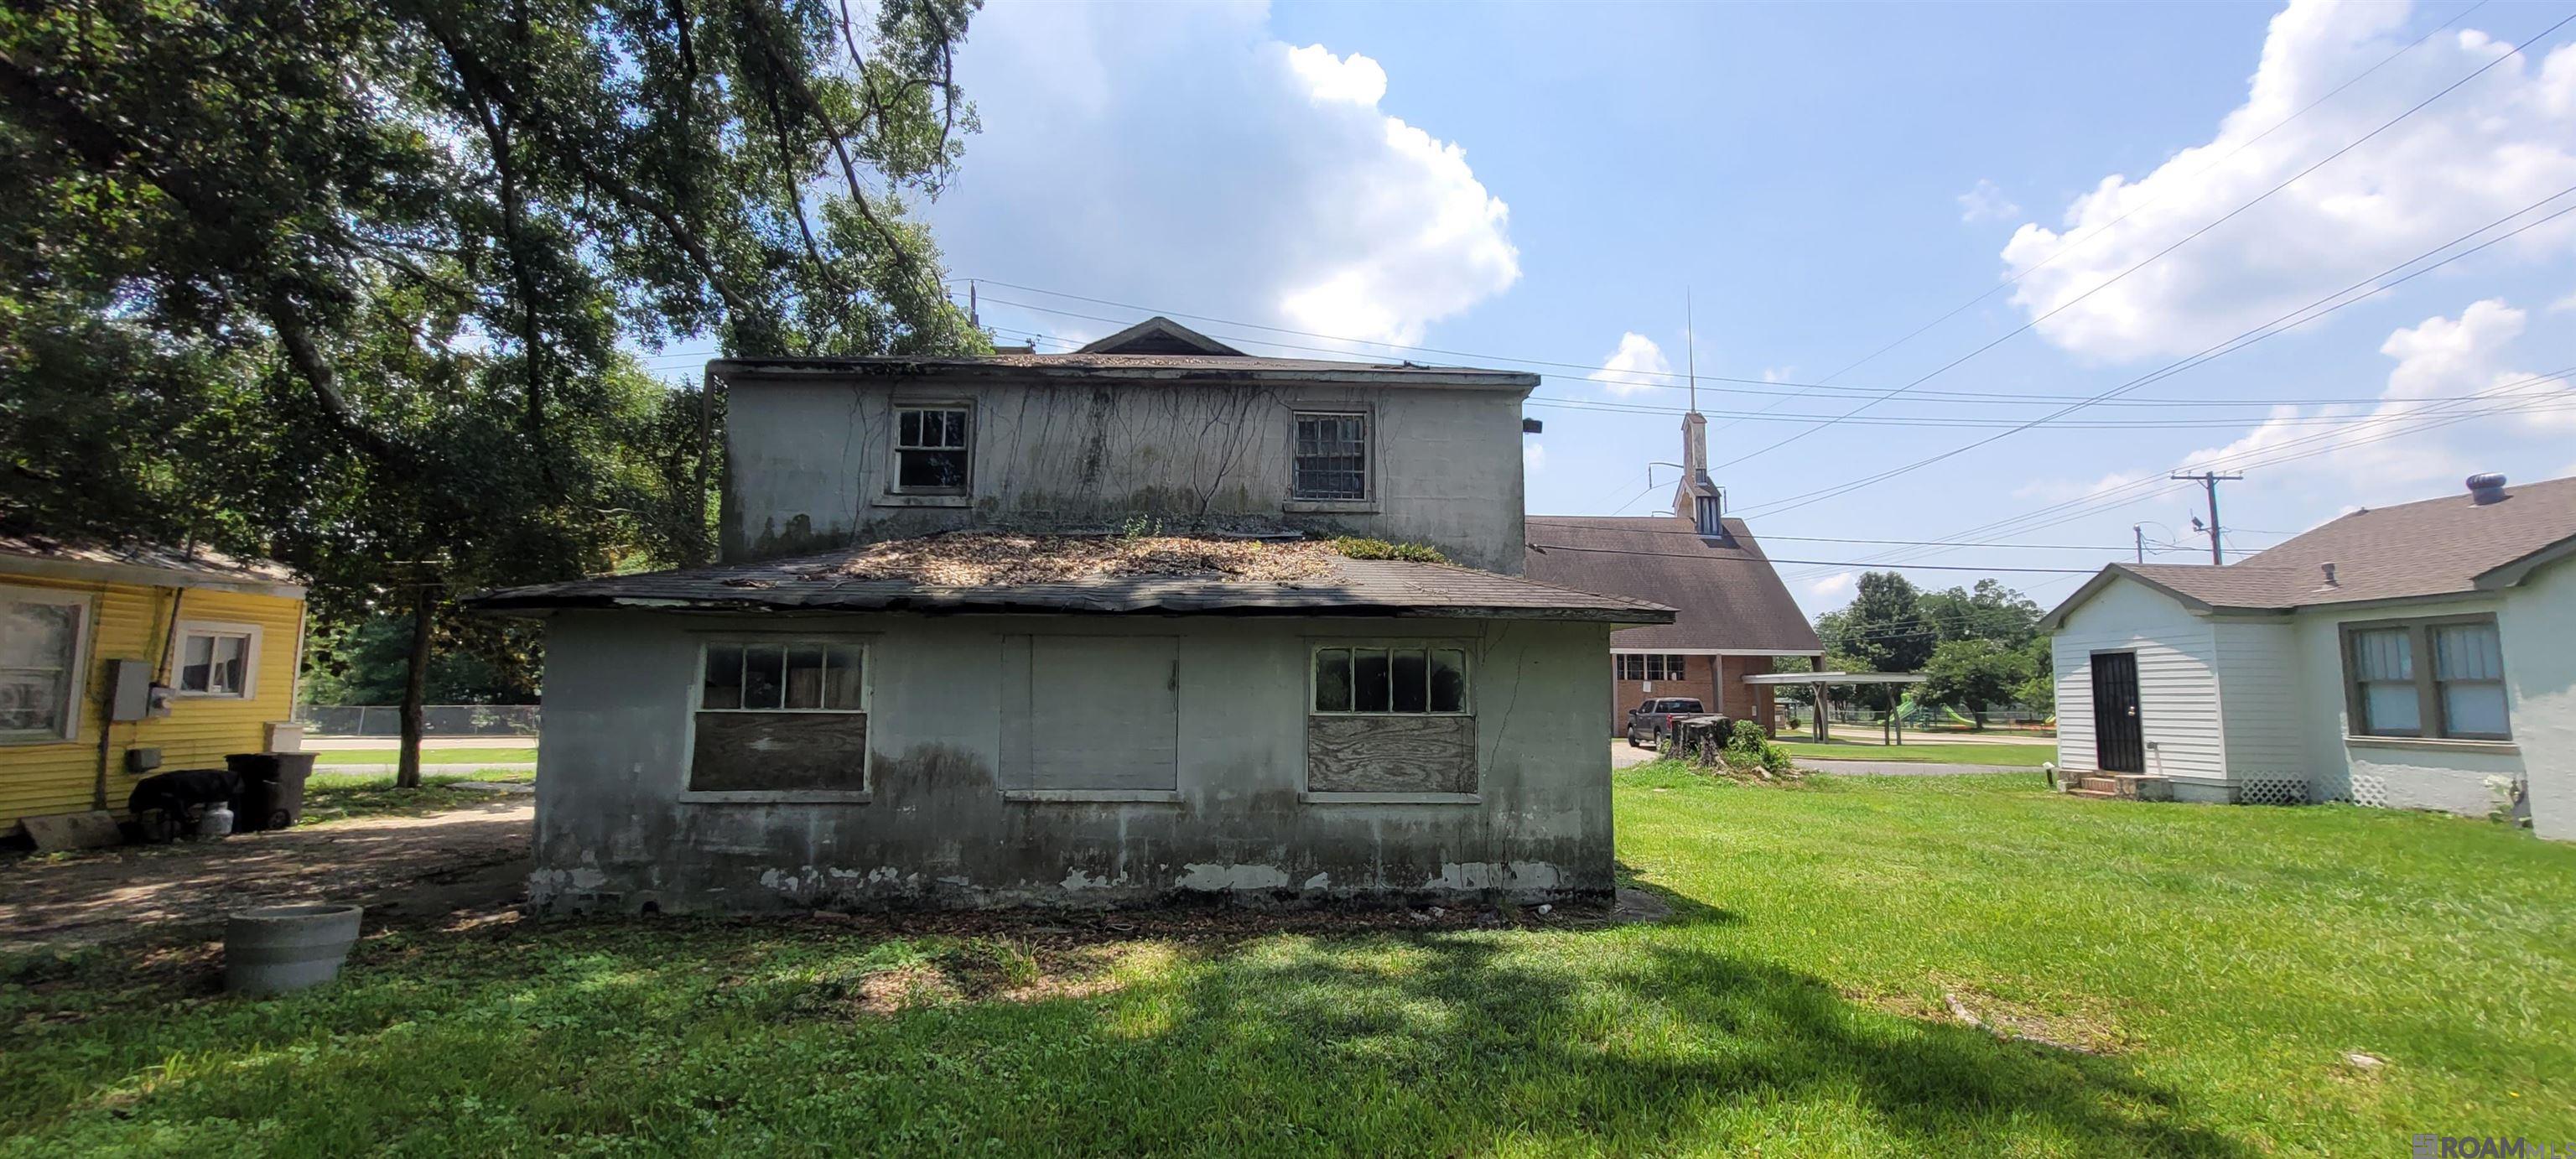
Active
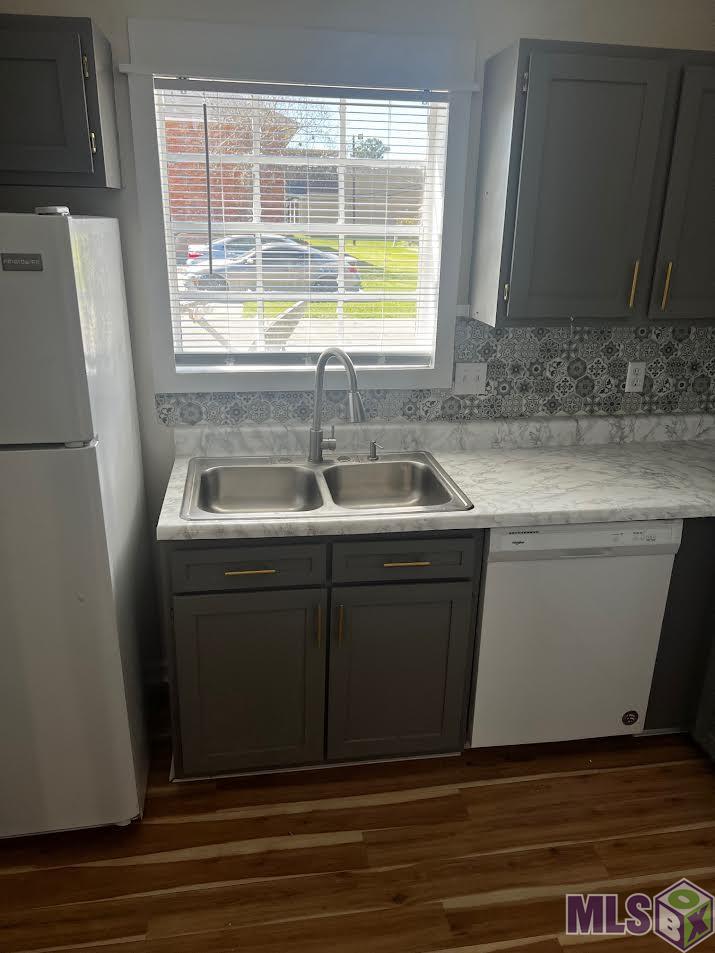
$85,000
bds
|
0
ba
|
3,150
sqft
|
built
1118 Convention St, Baton Rouge, LA 70802
$840
Cash flow
51.6%
Cash-on-Cash Return
17.5%
Cap rate
2.1%
Rent to Value Ratio
31 out of 54 properties for sale in Baton Rouge, LA
Limited Results Shown
Create a free account, or log in to reveal all property listings and enjoy the complete experience.
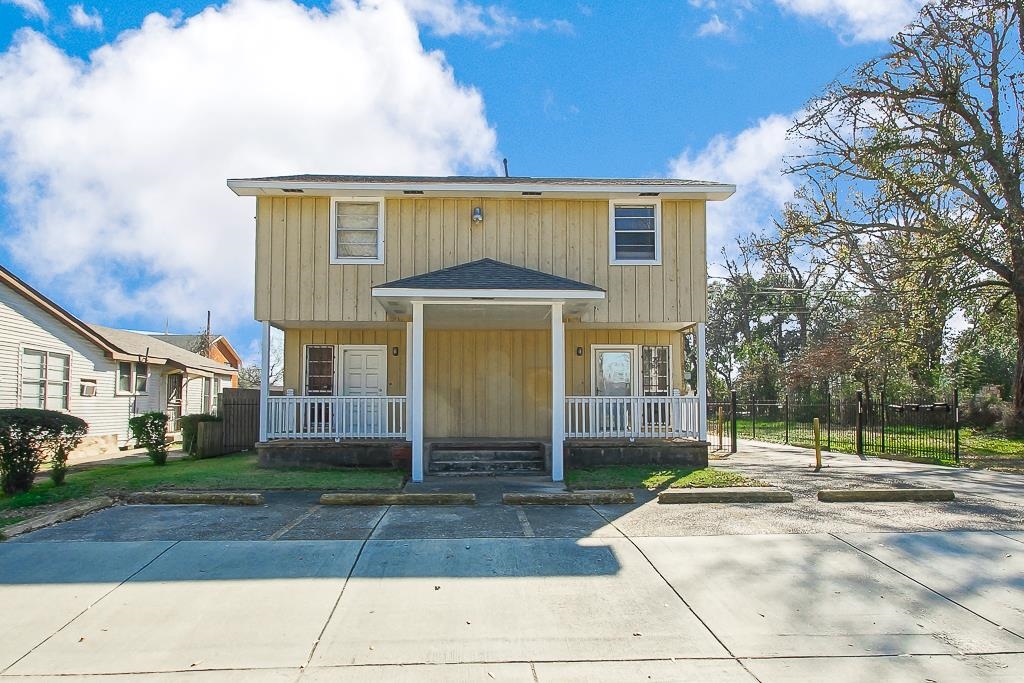
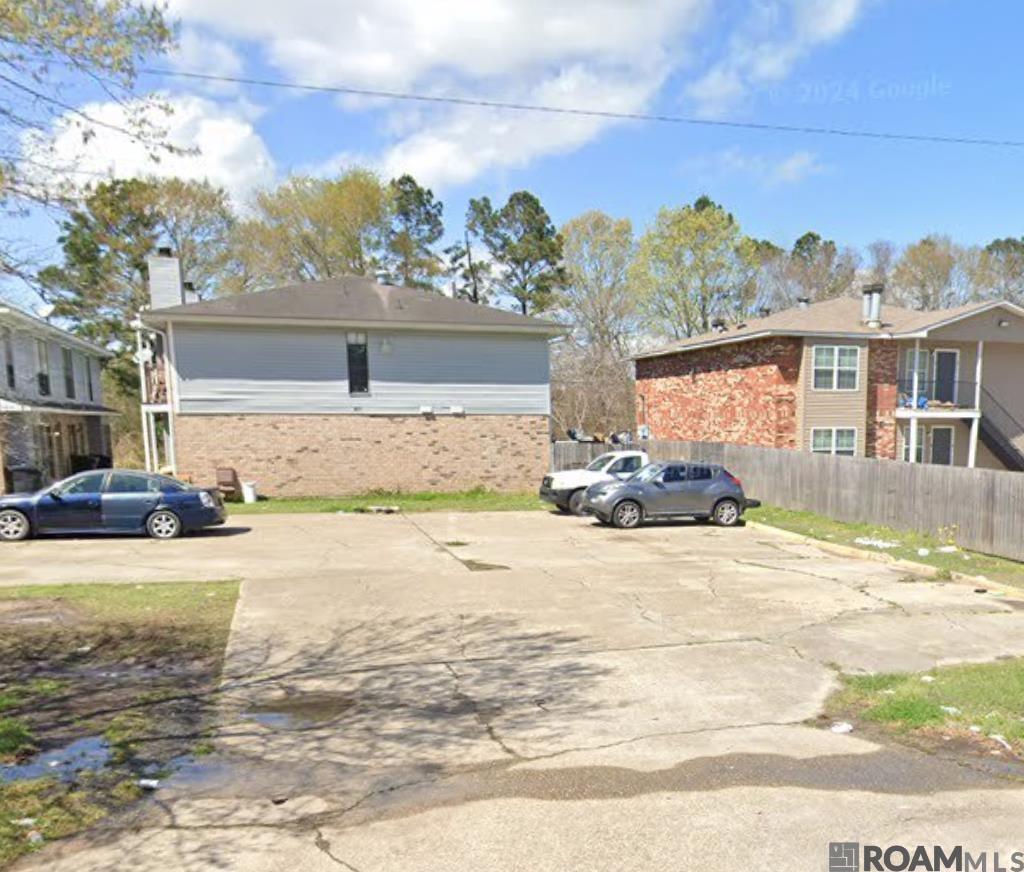
Active
$220,000
6
bds
|
0
ba
|
2,900
sqft
|
built
1982
774-776 Holt Drive, Baton Rouge, LA 70815
n/a
Cash flow
n/a
Cash-on-Cash Return
n/a
Cap rate
n/a
Rent to Value Ratio

Active
$220,000
6
bds
|
0
ba
|
2,900
sqft
|
built
1982
782-784 Holt Drive, Baton Rouge, LA 70815
n/a
Cash flow
n/a
Cash-on-Cash Return
n/a
Cap rate
n/a
Rent to Value Ratio

Active
$225,000
4
bds
|
0
ba
|
2,000
sqft
|
built
2389 Tennessee St, Baton Rouge, LA 70802
$-99
Cash flow
-2.3%
Cash-on-Cash Return
5.2%
Cap rate
0.6%
Rent to Value Ratio
Active
$315,000
bds
|
0
ba
|
4,200
sqft
|
built
1979
1767 Port Dr, Baton Rouge, LA 70820
$234
Cash flow
3.9%
Cash-on-Cash Return
6.6%
Cap rate
0.8%
Rent to Value Ratio
Active
$318,000
bds
|
0
ba
|
3,462
sqft
|
built
1983
3218 Toulon Dr, Baton Rouge, LA 70816
$13
Cash flow
0.2%
Cash-on-Cash Return
5.7%
Cap rate
0.7%
Rent to Value Ratio
Active
$275,000
bds
|
0
ba
|
2,114
sqft
|
built
638 Eddie Robinson Sr Dr, Baton Rouge, LA 70802
$79
Cash flow
1.5%
Cash-on-Cash Return
6.0%
Cap rate
0.7%
Rent to Value Ratio
Active
$85,000
bds
|
0
ba
|
3,150
sqft
|
built
1118 Convention St, Baton Rouge, LA 70802
$840
Cash flow
51.6%
Cash-on-Cash Return
17.5%
Cap rate
2.1%
Rent to Value Ratio
Active
$362,200
bds
|
0
ba
|
4,332
sqft
|
built
1985
1706 Brightside Dr, Baton Rouge, LA 70820
$-1,368
Cash flow
-19.7%
Cash-on-Cash Return
1.1%
Cap rate
0.2%
Rent to Value Ratio
Active
$280,000
bds
|
0
ba
|
4,200
sqft
|
built
2116 Fairchild St, Baton Rouge, LA 70807
$55
Cash flow
1.0%
Cash-on-Cash Return
5.9%
Cap rate
0.7%
Rent to Value Ratio
Active
$402,000
bds
|
0
ba
|
3,248
sqft
|
built
5435 Nicholson Dr, Baton Rouge, LA 70820
$-1,281
Cash flow
-16.6%
Cash-on-Cash Return
1.9%
Cap rate
0.2%
Rent to Value Ratio
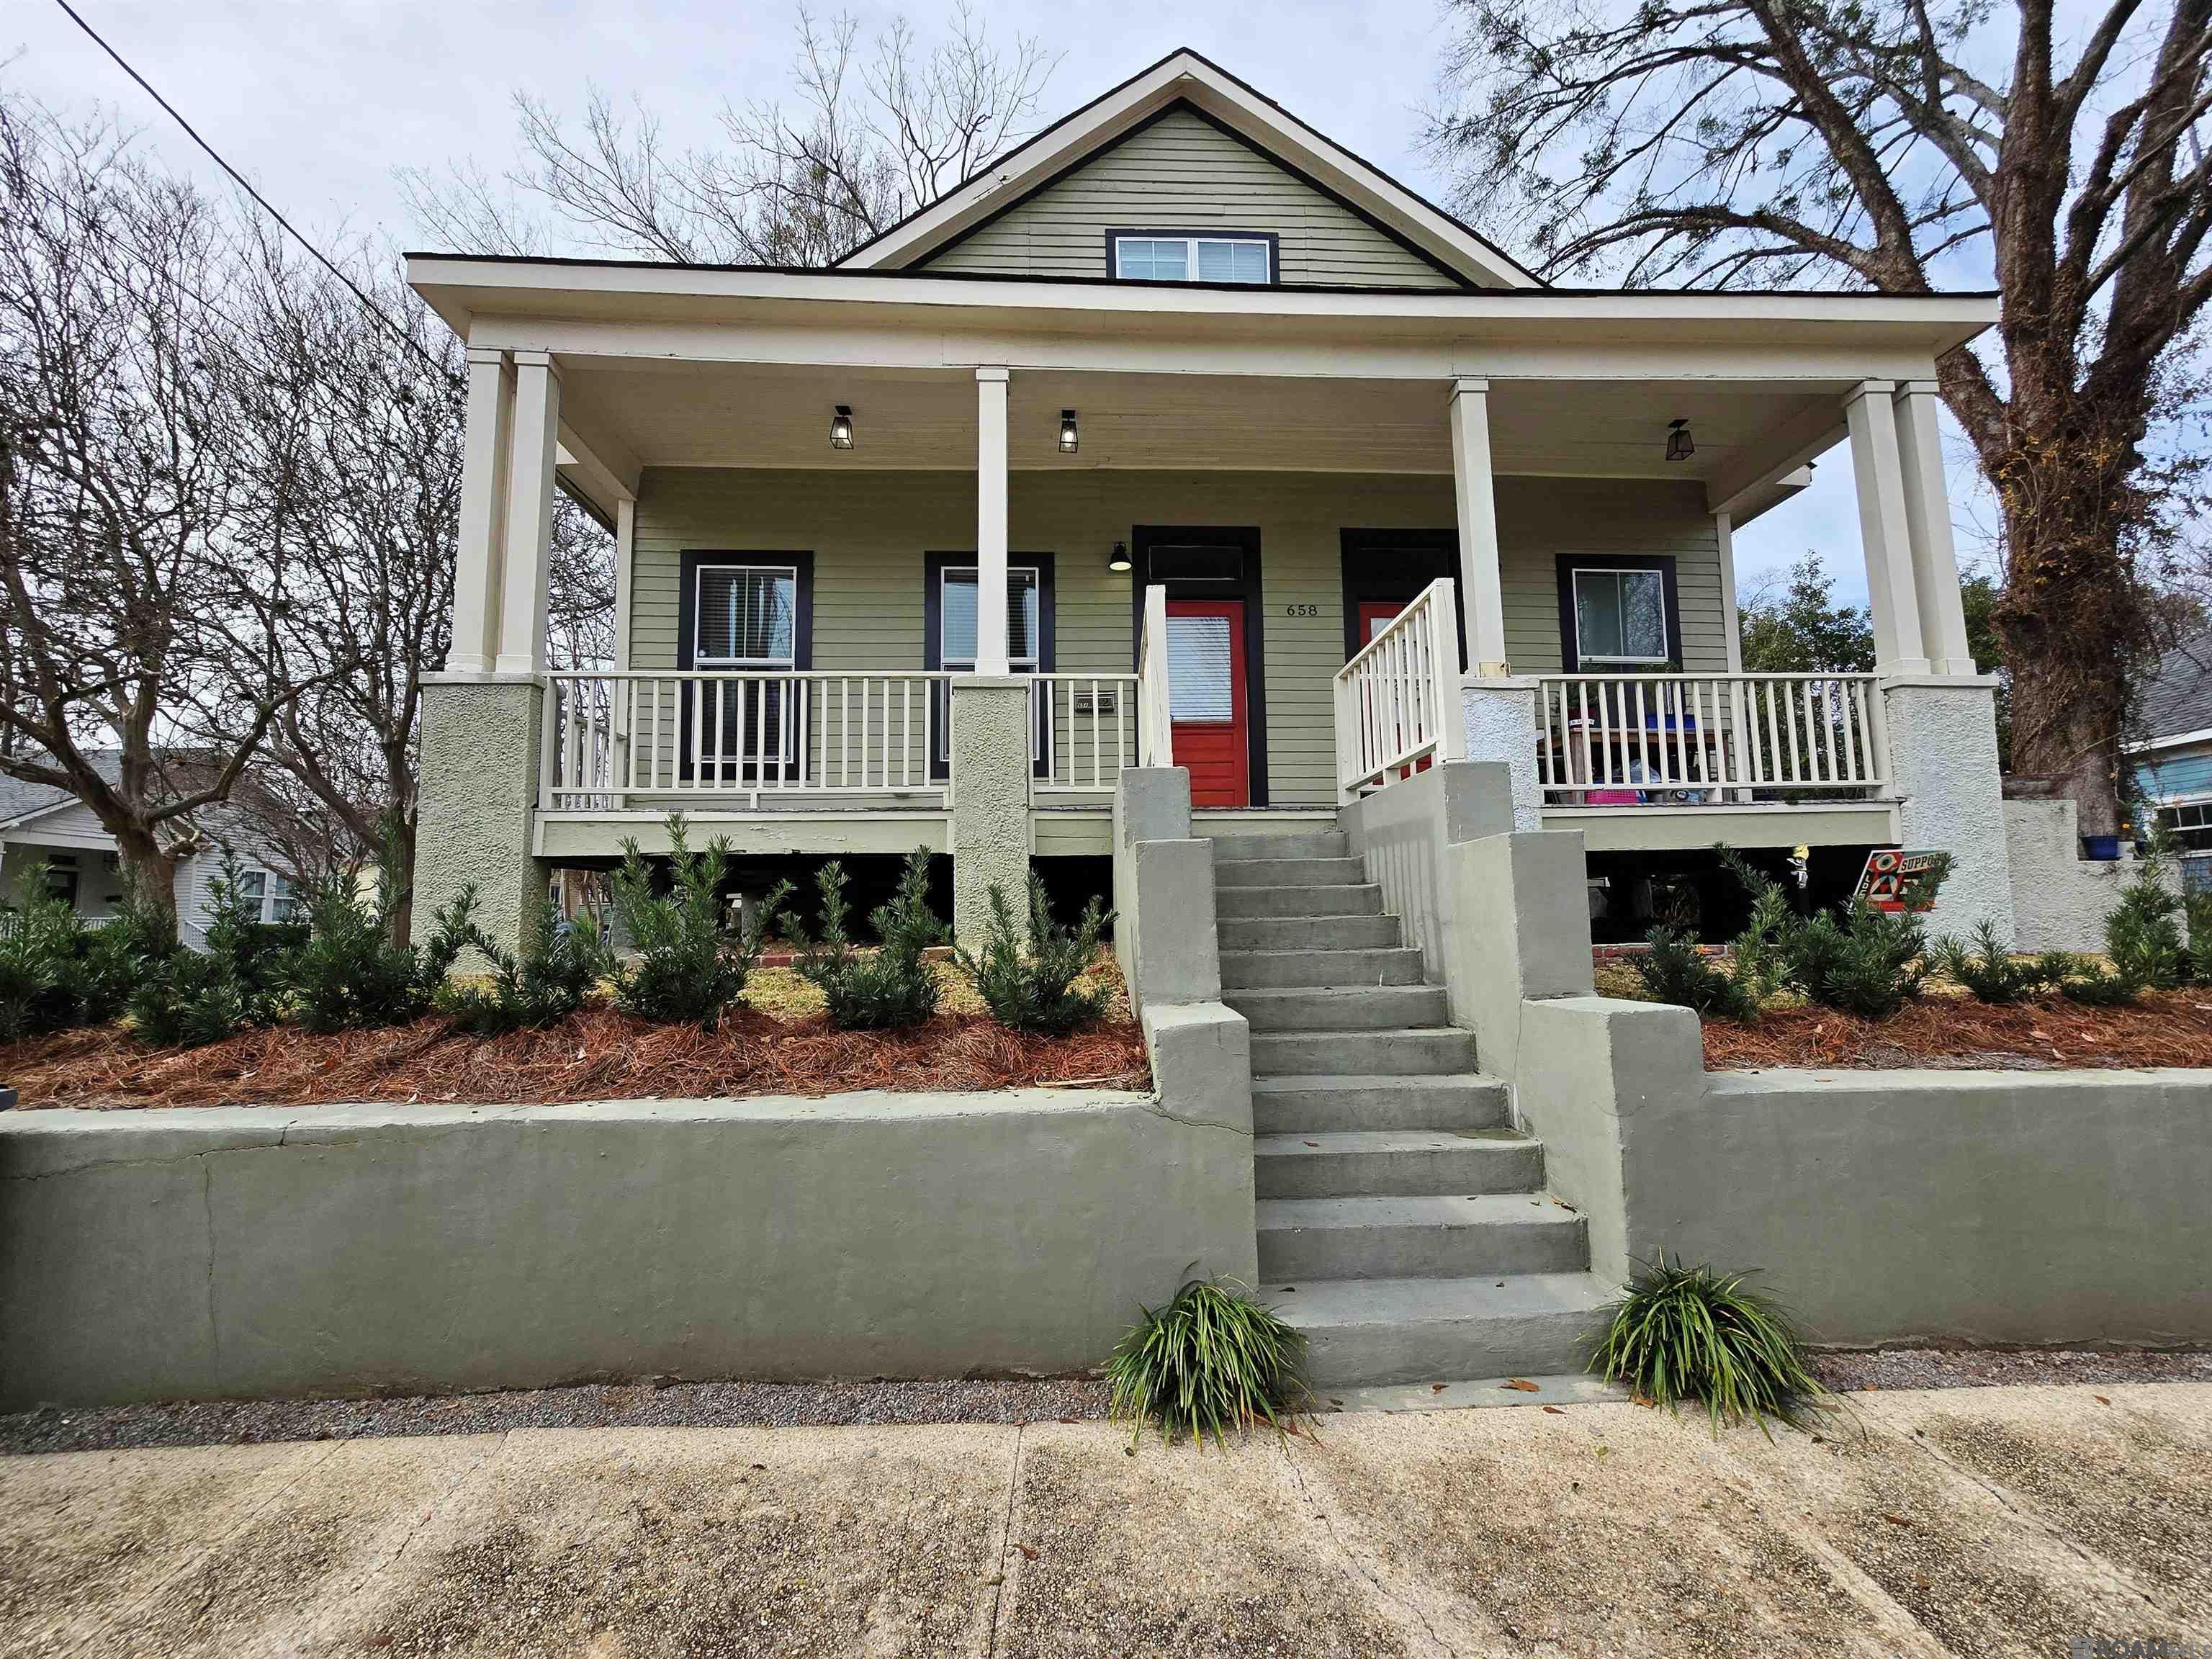
Pending
$405,000
3
bds
|
0
ba
|
2,300
sqft
|
built
658 Napoleon St, Baton Rouge, LA 70802
$-675
Cash flow
-8.7%
Cash-on-Cash Return
3.7%
Cap rate
0.4%
Rent to Value Ratio
Active
$325,400
bds
|
0
ba
|
4,000
sqft
|
built
1982
14121 Azalea Park Ave, Baton Rouge, LA 70816
$-919
Cash flow
-14.7%
Cash-on-Cash Return
2.3%
Cap rate
0.3%
Rent to Value Ratio
Active
$20,000
bds
|
0
ba
|
1,700
sqft
|
built
4652 Lemonwood Dr, Baton Rouge, LA 70805
$759
Cash flow
44.2%
Cash-on-Cash Return
45.5%
Cap rate
5.5%
Rent to Value Ratio
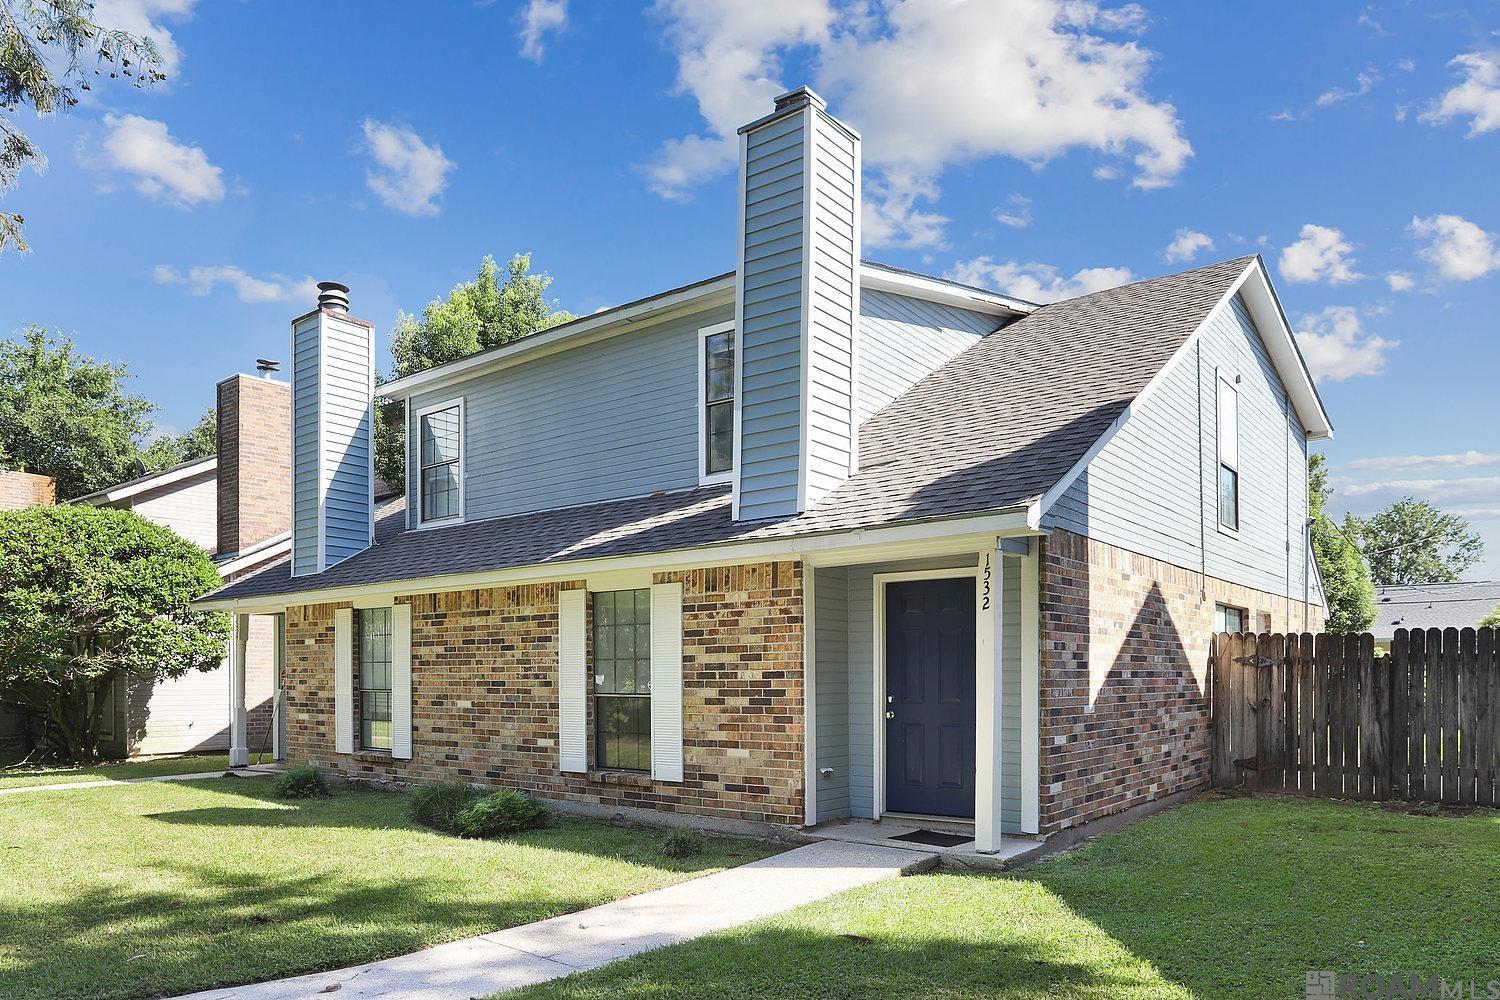
Active
$350,000
3
bds
|
0
ba
|
3,214
sqft
|
built
1980
1532 Sharlo Ave, Baton Rouge, LA 70820
$-770
Cash flow
-11.5%
Cash-on-Cash Return
3.0%
Cap rate
0.4%
Rent to Value Ratio
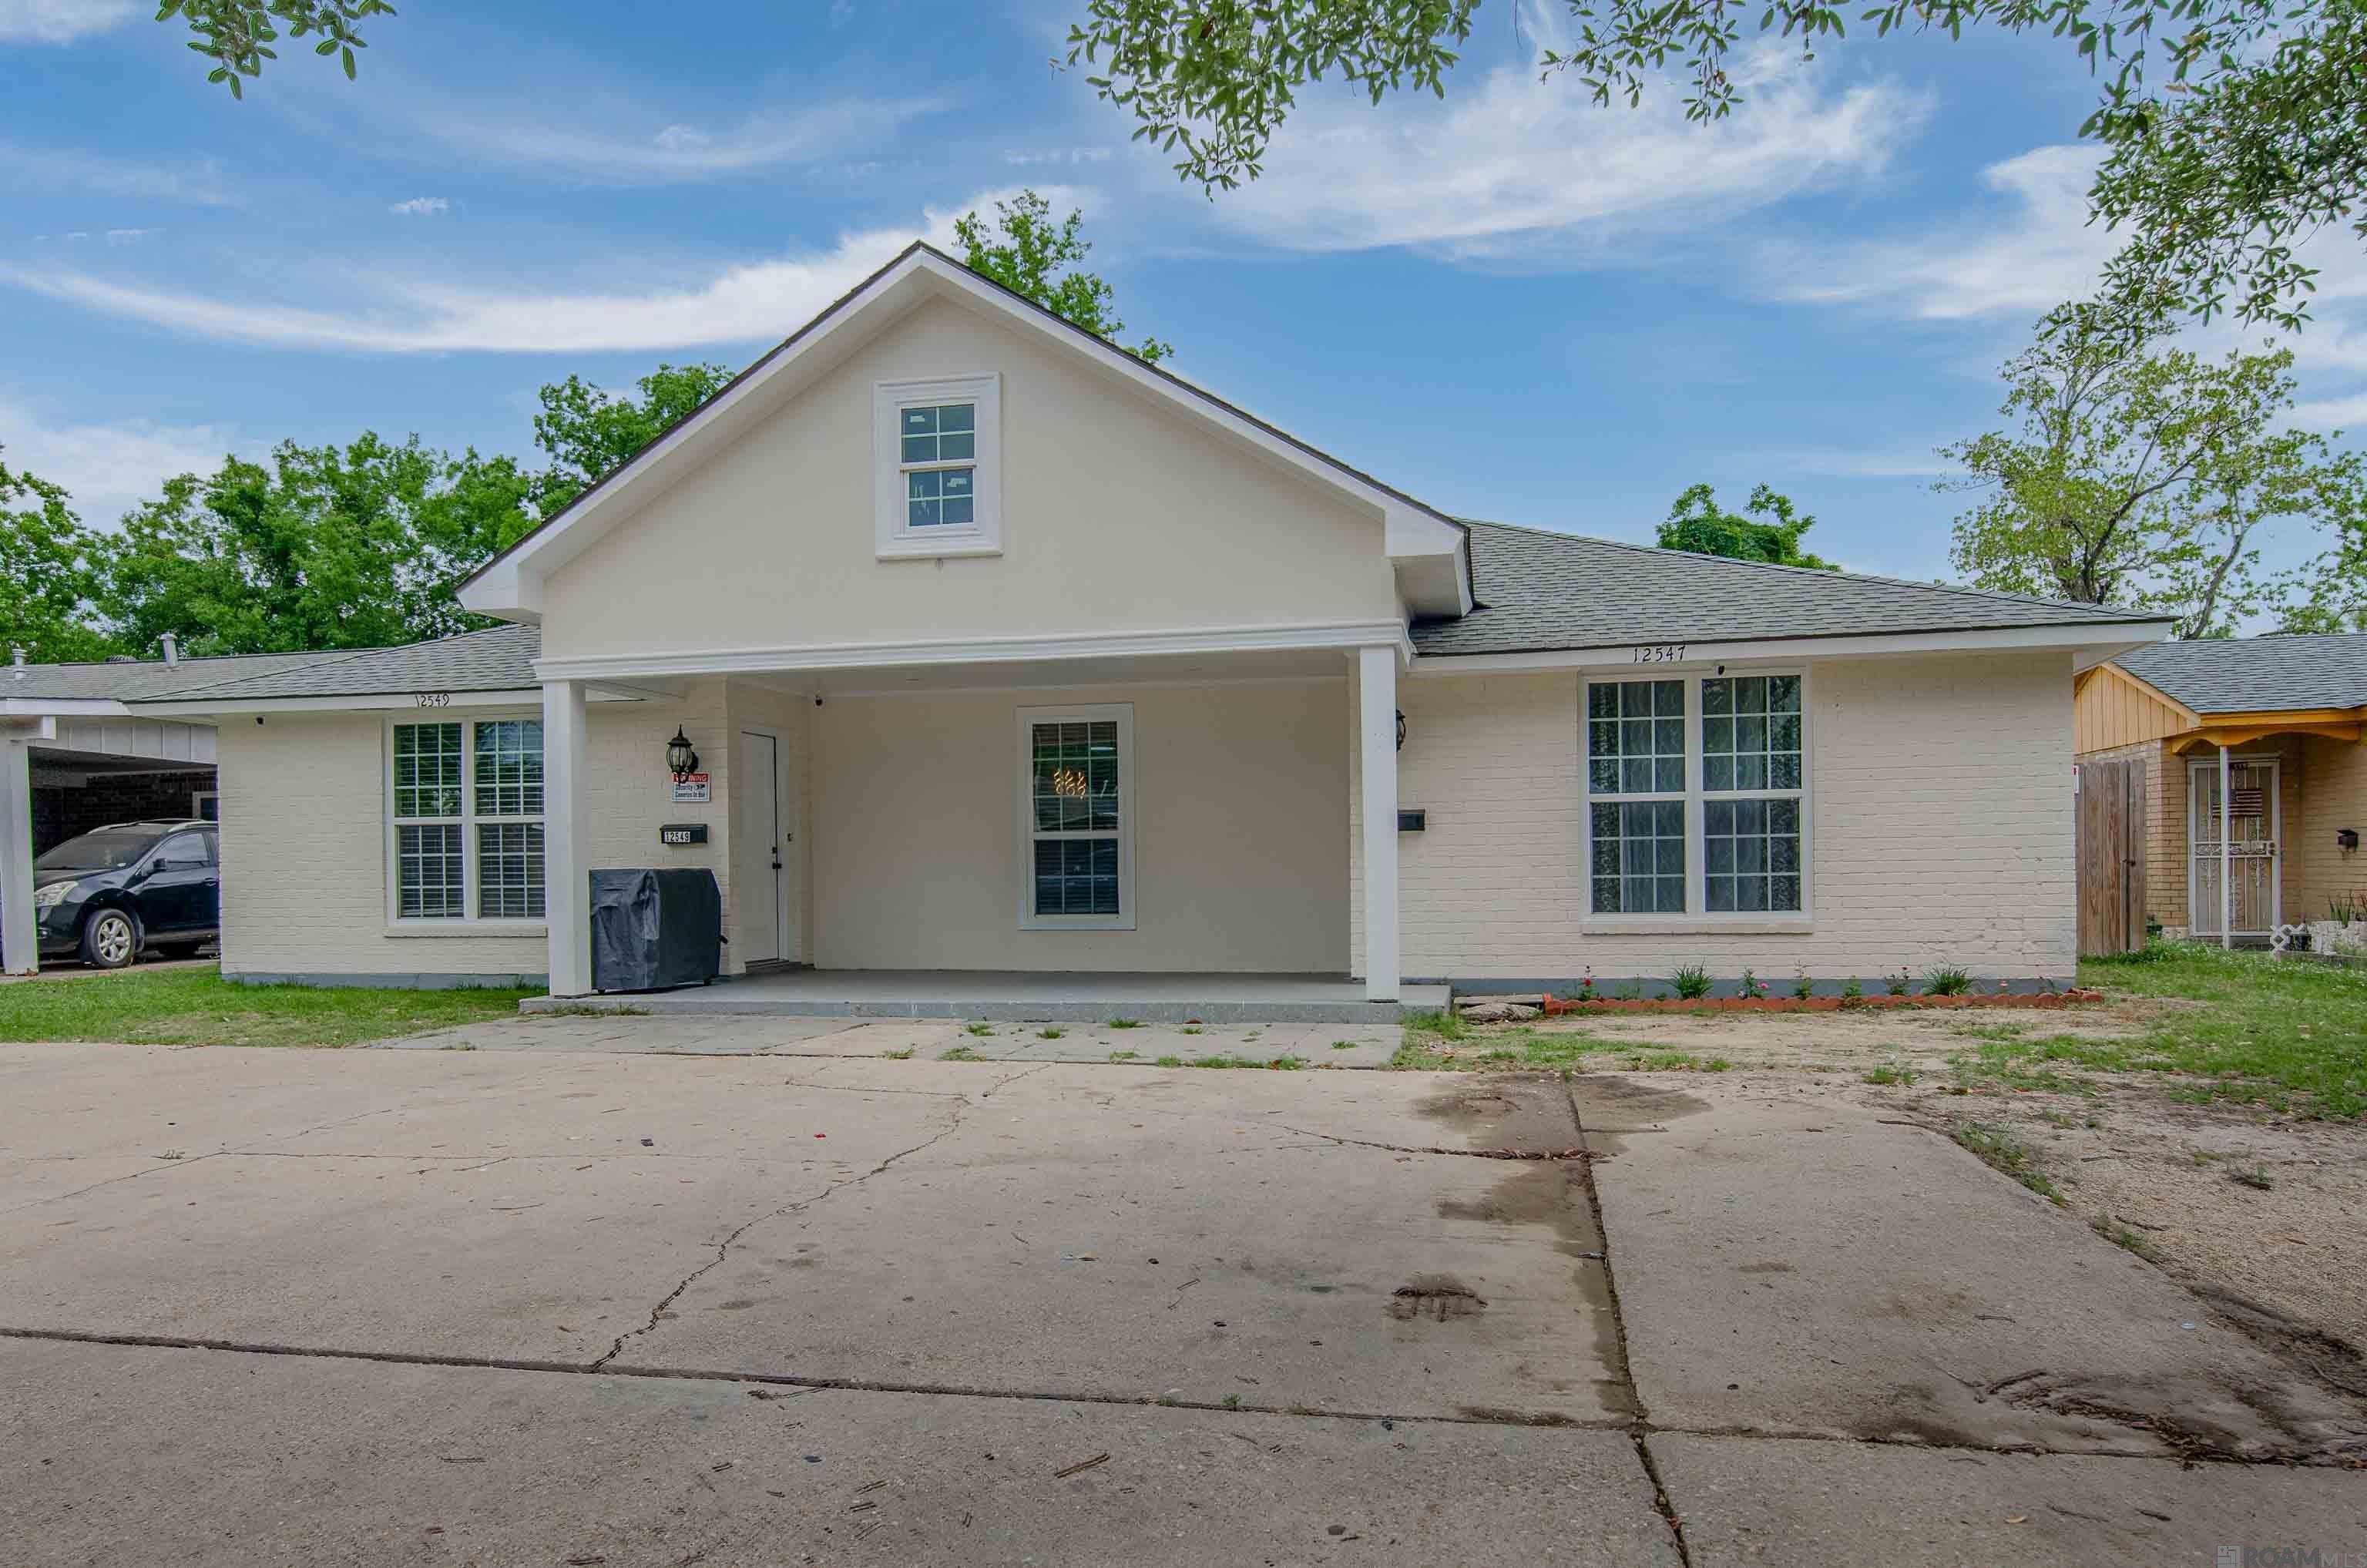
Active
$220,000
bds
|
0
ba
|
2,281
sqft
|
built
12549 Lorna Ave, Baton Rouge, LA 70815
$-144
Cash flow
-3.4%
Cash-on-Cash Return
4.9%
Cap rate
0.6%
Rent to Value Ratio
Active
$316,000
2
bds
|
0
ba
|
3,648
sqft
|
built
4555 Alvin Dark Ave, Baton Rouge, LA 70820
$-943
Cash flow
-15.6%
Cash-on-Cash Return
2.1%
Cap rate
0.3%
Rent to Value Ratio
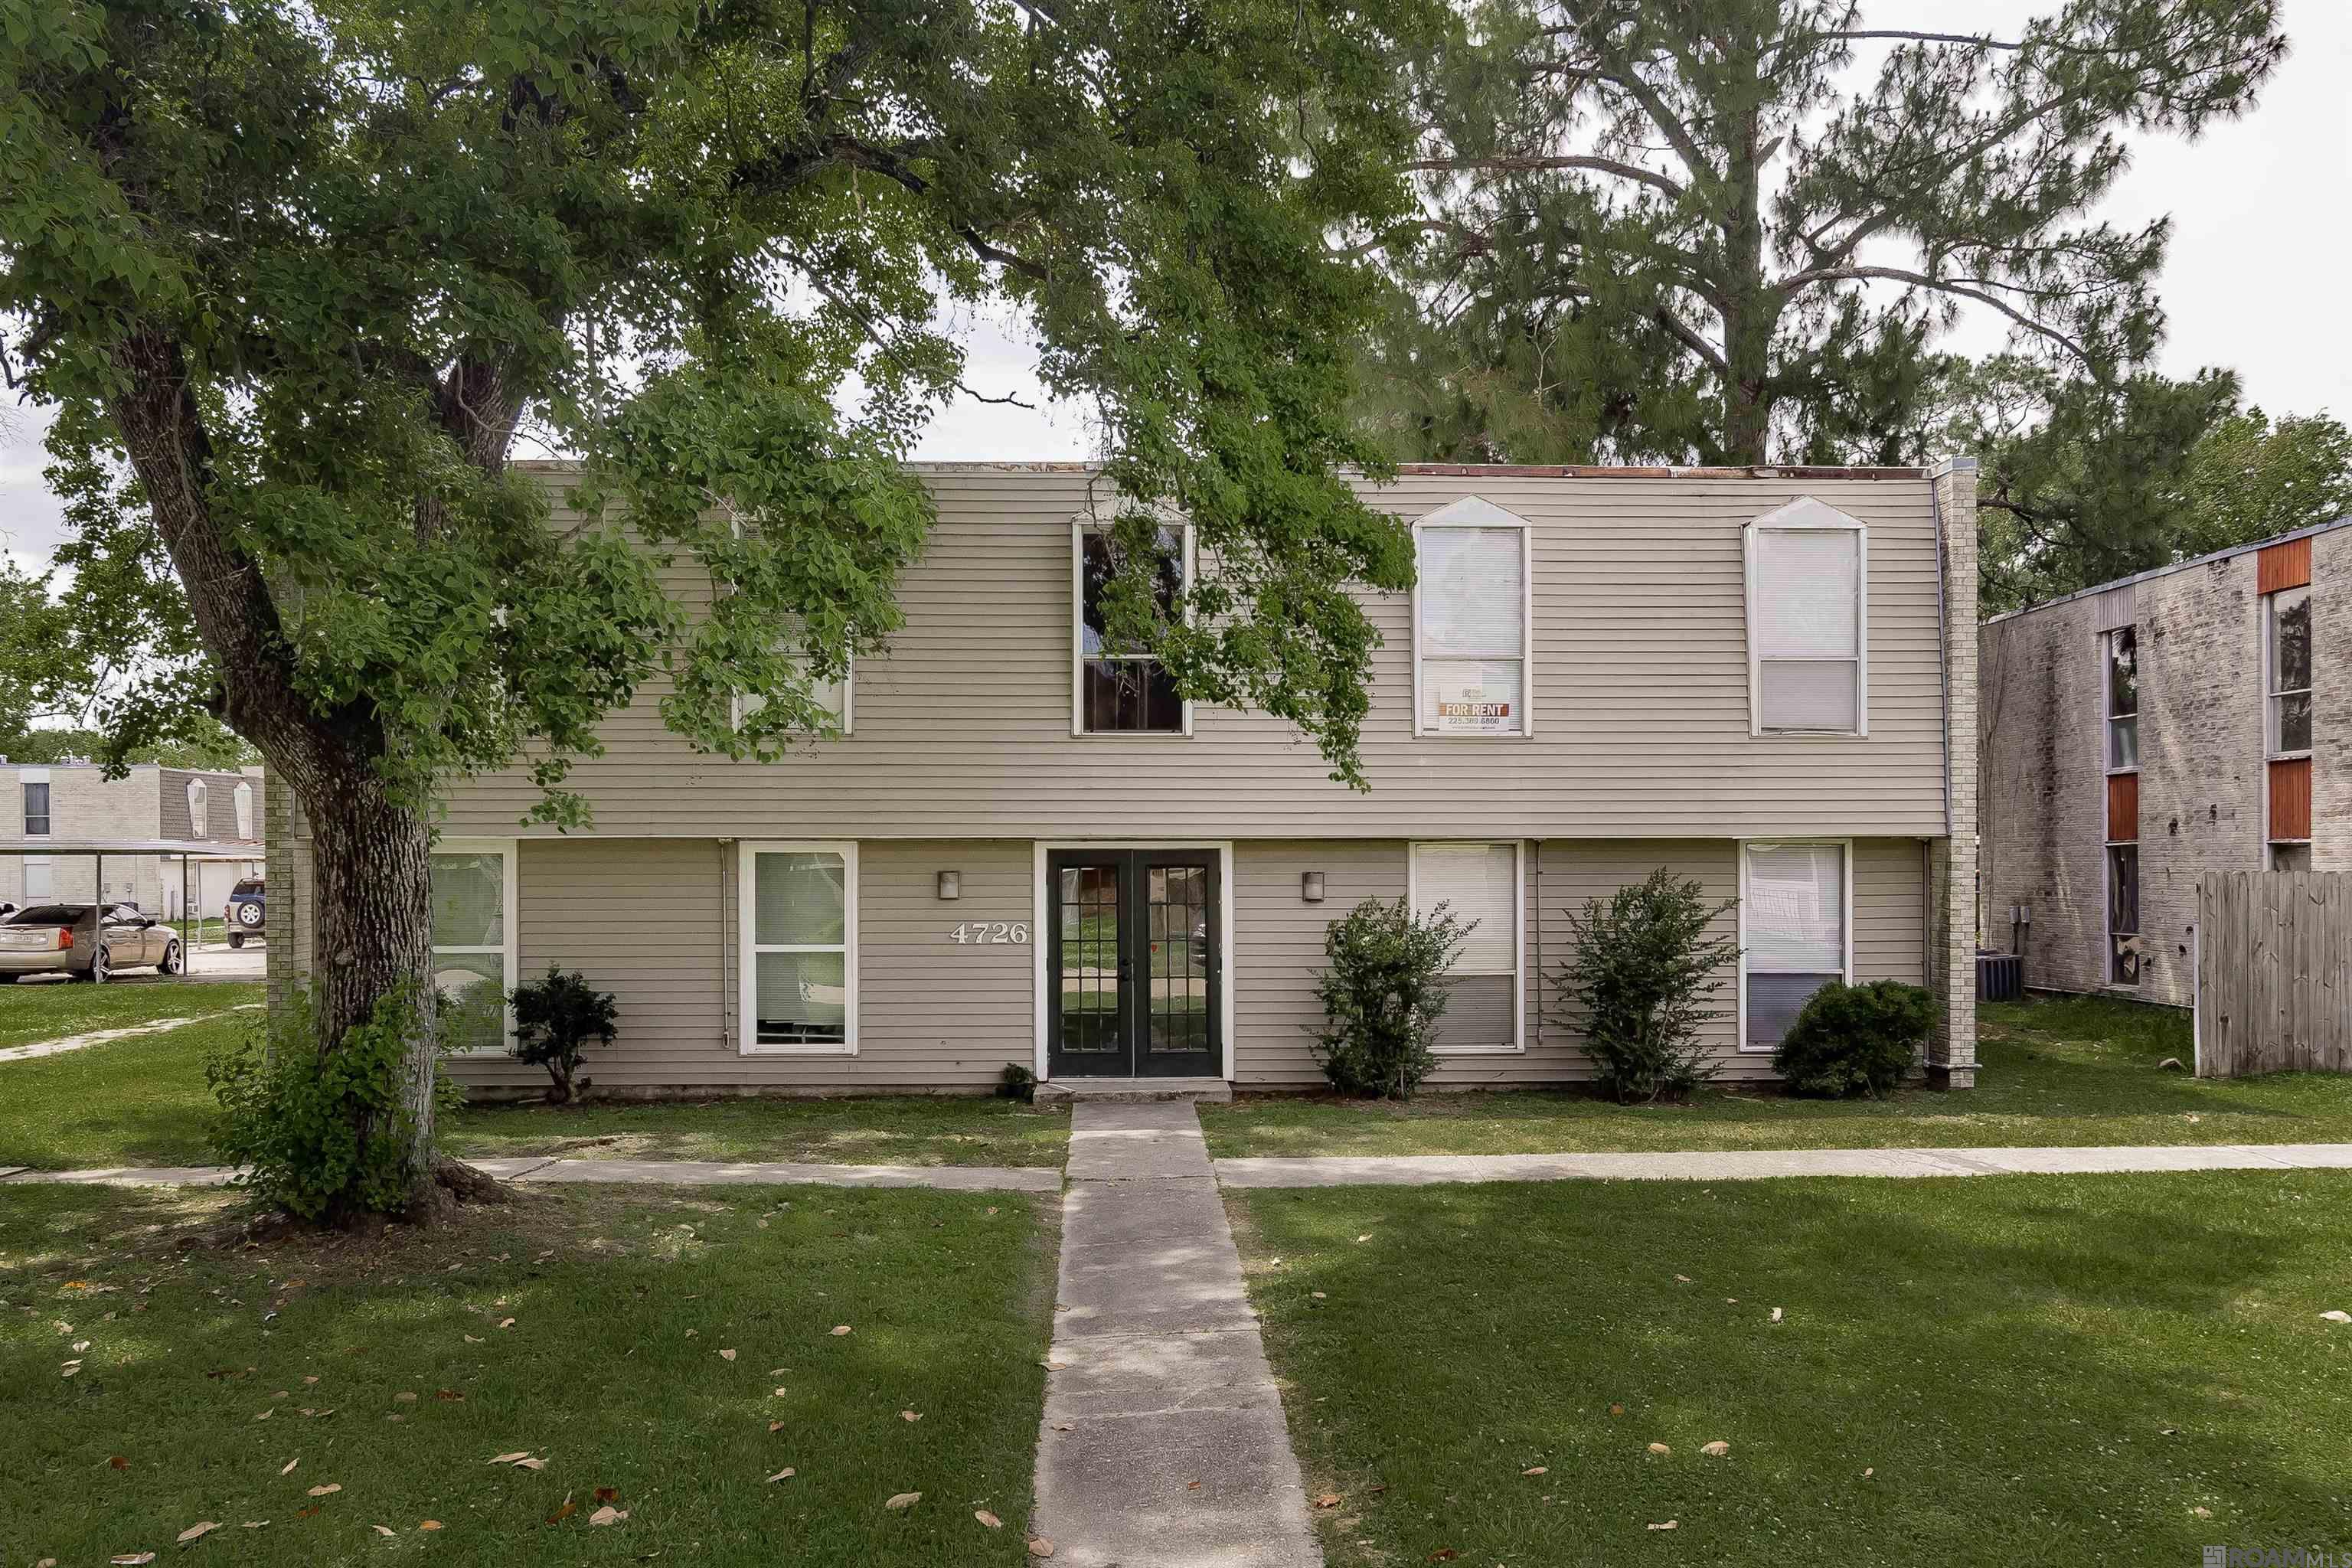
Active
$280,000
bds
|
0
ba
|
3,450
sqft
|
built
4726 Earl Gros Ave, Baton Rouge, LA 70820
$-221
Cash flow
-4.1%
Cash-on-Cash Return
4.7%
Cap rate
0.6%
Rent to Value Ratio
Active
$29,900
bds
|
0
ba
|
1,776
sqft
|
built
2743 Linwood St, Baton Rouge, LA 70805
$897
Cash flow
35.0%
Cash-on-Cash Return
36.0%
Cap rate
4.3%
Rent to Value Ratio
Active
$289,900
bds
|
0
ba
|
4,514
sqft
|
built
3412 Yorkfield Dr, Baton Rouge, LA 70816
$8
Cash flow
0.1%
Cash-on-Cash Return
5.7%
Cap rate
0.7%
Rent to Value Ratio
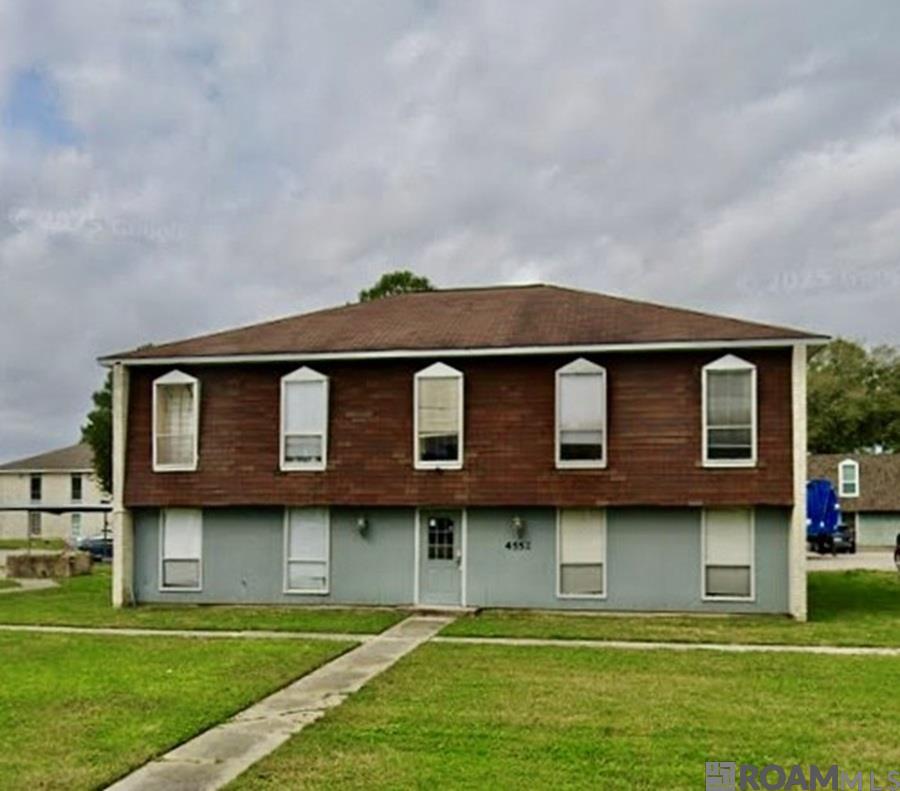
Pending
$268,500
bds
|
0
ba
|
3,840
sqft
|
built
4552 Earl Gros Ave, Baton Rouge, LA 70820
$247
Cash flow
4.8%
Cash-on-Cash Return
6.8%
Cap rate
0.8%
Rent to Value Ratio
Active
$3,450,000
bds
|
0
ba
|
30,000
sqft
|
built
1984
11352 Bard Ave, Baton Rouge, LA 70815
$-15,360
Cash flow
-23.2%
Cash-on-Cash Return
0.3%
Cap rate
0.0%
Rent to Value Ratio
Active
$255,000
bds
|
0
ba
|
1,500
sqft
|
built
144-146 Beverly Dr, Baton Rouge, LA 70806
$35
Cash flow
0.7%
Cash-on-Cash Return
5.8%
Cap rate
0.7%
Rent to Value Ratio
Active
$3,500,000
bds
|
0
ba
|
36,000
sqft
|
built
7272 Burbank Dr, Baton Rouge, LA 70820
$-15,597
Cash flow
-23.3%
Cash-on-Cash Return
0.3%
Cap rate
0.0%
Rent to Value Ratio
Active
$279,000
bds
|
0
ba
|
1,506
sqft
|
built
570 Caddo St, Baton Rouge, LA 70806
$-768
Cash flow
-14.4%
Cash-on-Cash Return
2.4%
Cap rate
0.3%
Rent to Value Ratio
Active
$325,000
bds
|
0
ba
|
4,290
sqft
|
built
1983
8756 Elvin Dr, Baton Rouge, LA 70810
$-434
Cash flow
-7.0%
Cash-on-Cash Return
4.1%
Cap rate
0.5%
Rent to Value Ratio
Active
$180,000
bds
|
0
ba
|
2,382
sqft
|
built
1984
824 E Polk St, Baton Rouge, LA 70802
$-162
Cash flow
-4.7%
Cash-on-Cash Return
4.6%
Cap rate
0.6%
Rent to Value Ratio
Active
$423,899
bds
|
0
ba
|
4,000
sqft
|
built
1984
5407 Nicholson Dr, Baton Rouge, LA 70820
$-1,247
Cash flow
-15.3%
Cash-on-Cash Return
2.1%
Cap rate
0.3%
Rent to Value Ratio
Active
$155,000
bds
|
0
ba
|
2,304
sqft
|
built
1984
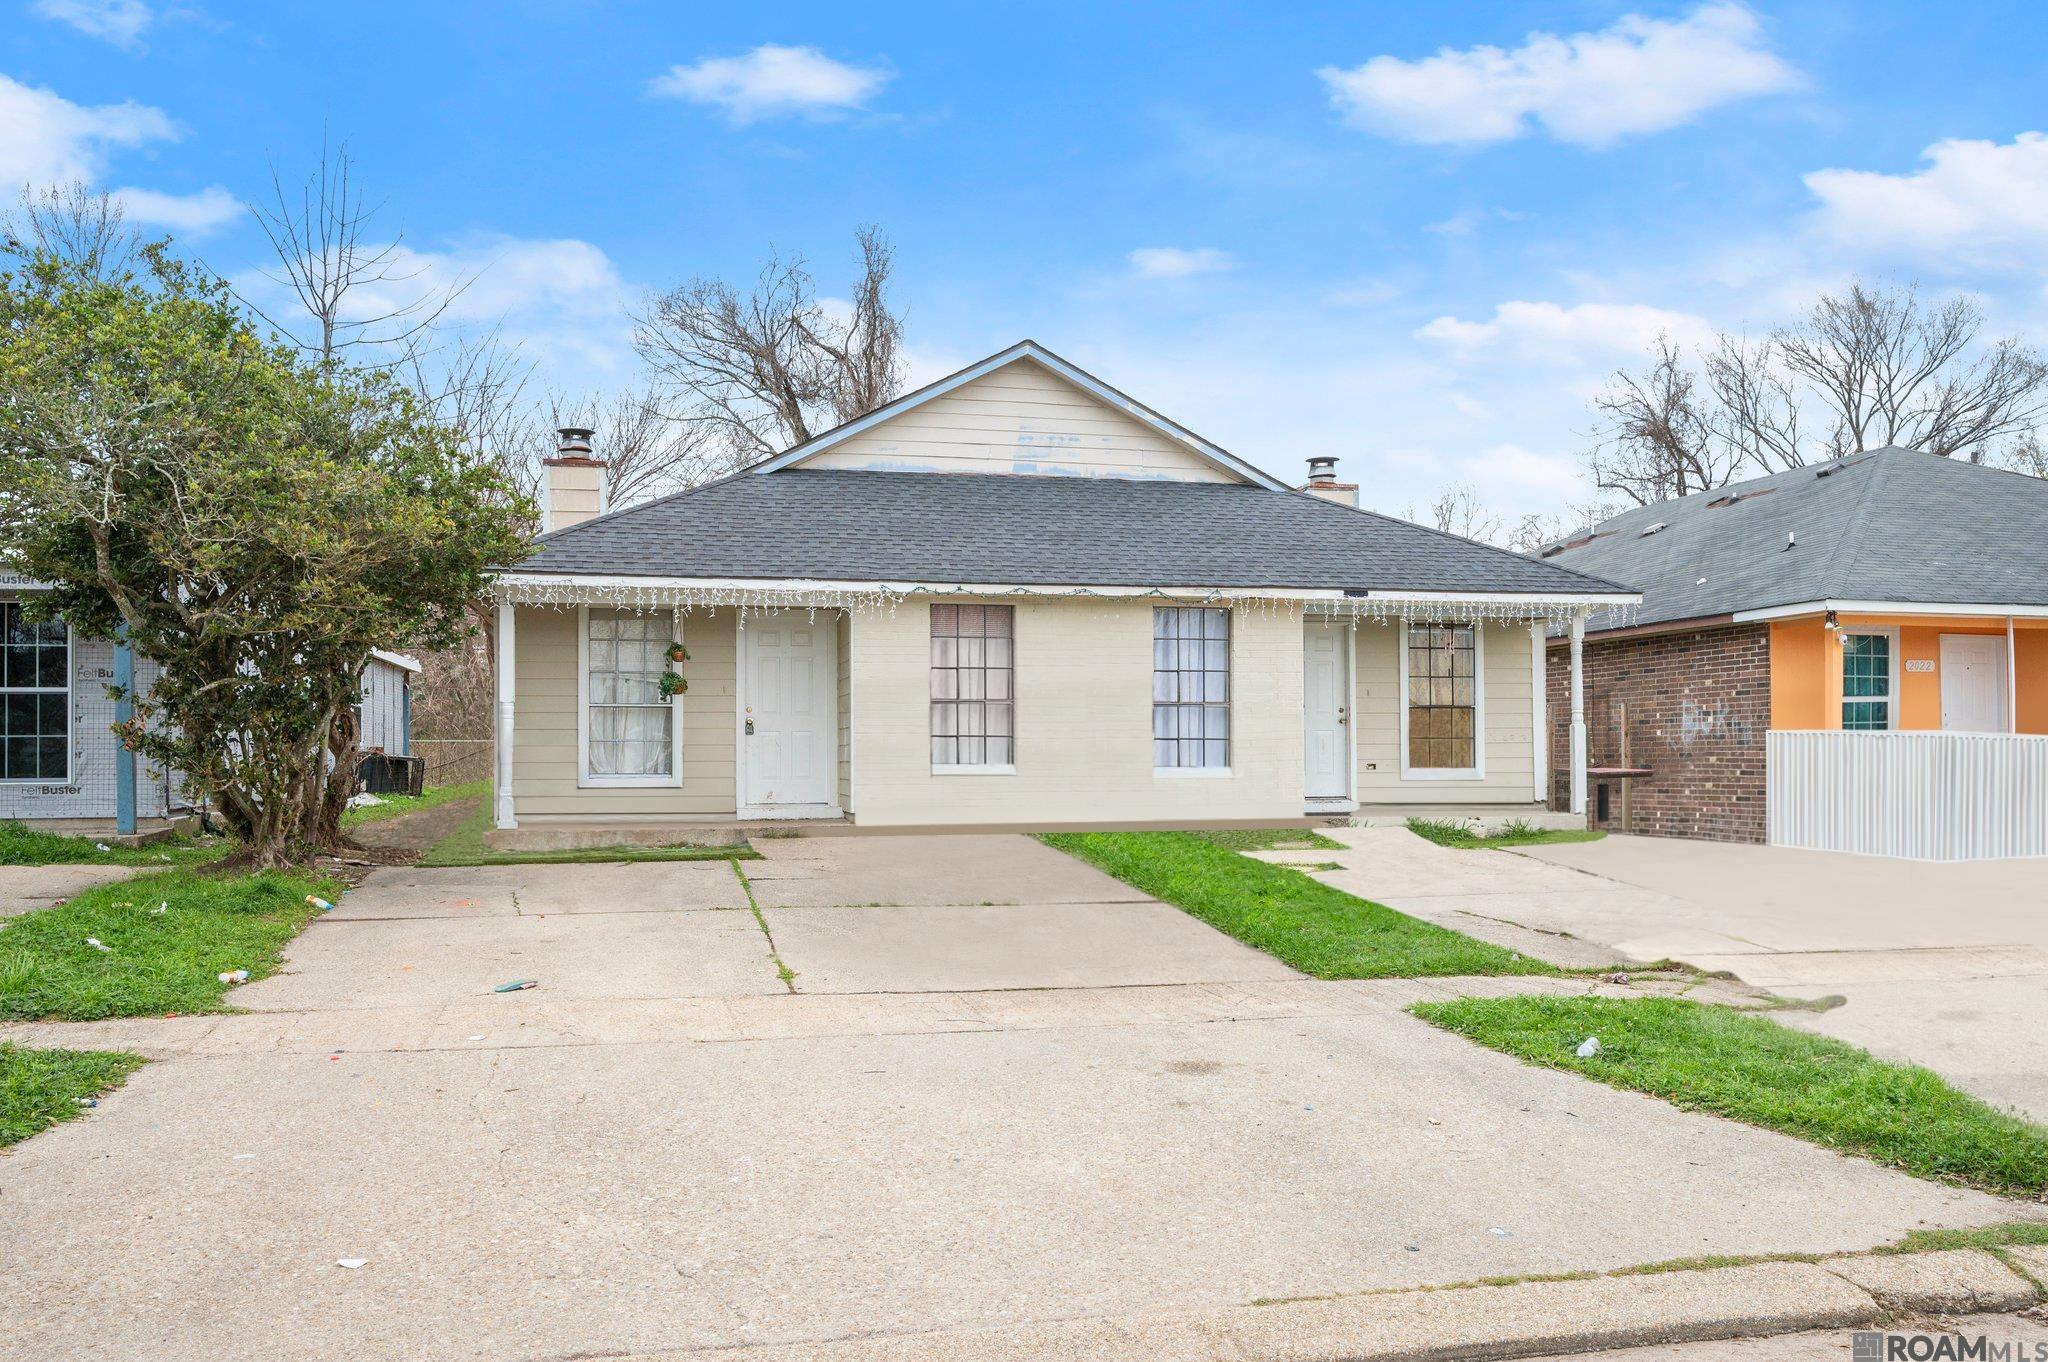
2030-2032 Helm Dr, Baton Rouge, LA 70820
$646
Cash flow
21.7%
Cash-on-Cash Return
10.7%
Cap rate
1.3%
Rent to Value Ratio
Active
$155,000
bds
|
0
ba
|
2,304
sqft
|
built
1984
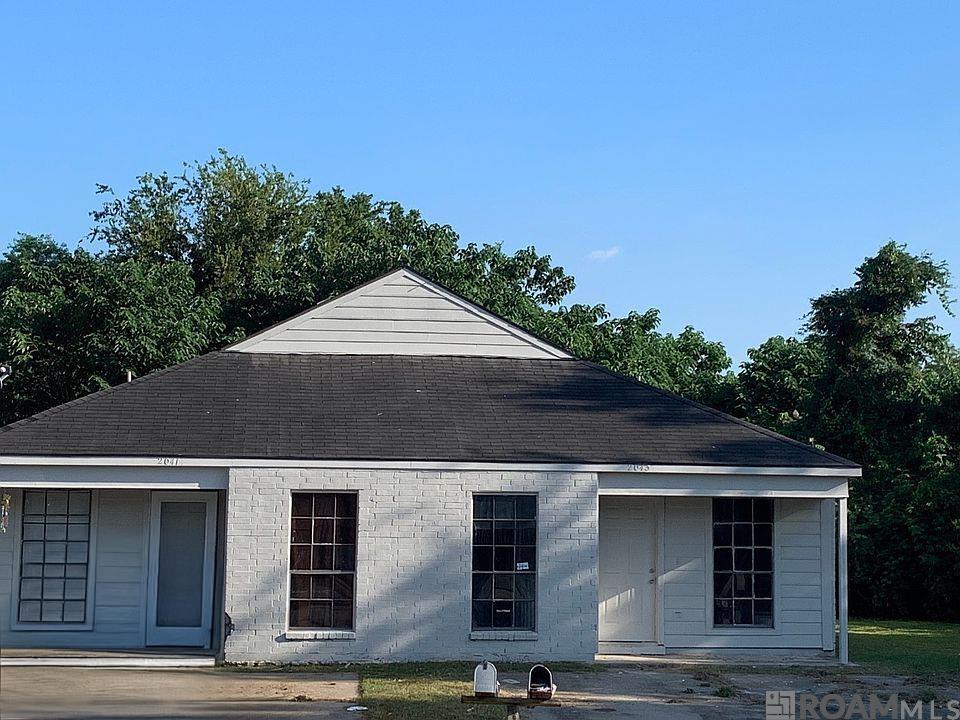
2041-2043 Helm Dr, Baton Rouge, LA 70820
$646
Cash flow
21.7%
Cash-on-Cash Return
10.7%
Cap rate
1.3%
Rent to Value Ratio
Active
$384,000
bds
|
0
ba
|
3,800
sqft
|
built
1983
843 Hammond Manor Dr, Baton Rouge, LA 70816
$-92
Cash flow
-1.3%
Cash-on-Cash Return
5.4%
Cap rate
0.7%
Rent to Value Ratio
Active
$285,000
bds
|
0
ba
|
1,536
sqft
|
built
3408 Wilshire Dr, Baton Rouge, LA 70806
$31
Cash flow
0.6%
Cash-on-Cash Return
5.8%
Cap rate
0.7%
Rent to Value Ratio