Baton Rouge, LA Investment Properties for Sale
Browse homes for sale and investment properties in Baton Rouge, LA. Refine your search by price, property type, or more.
Best cash flowing properties in Baton Rouge, LA
Active
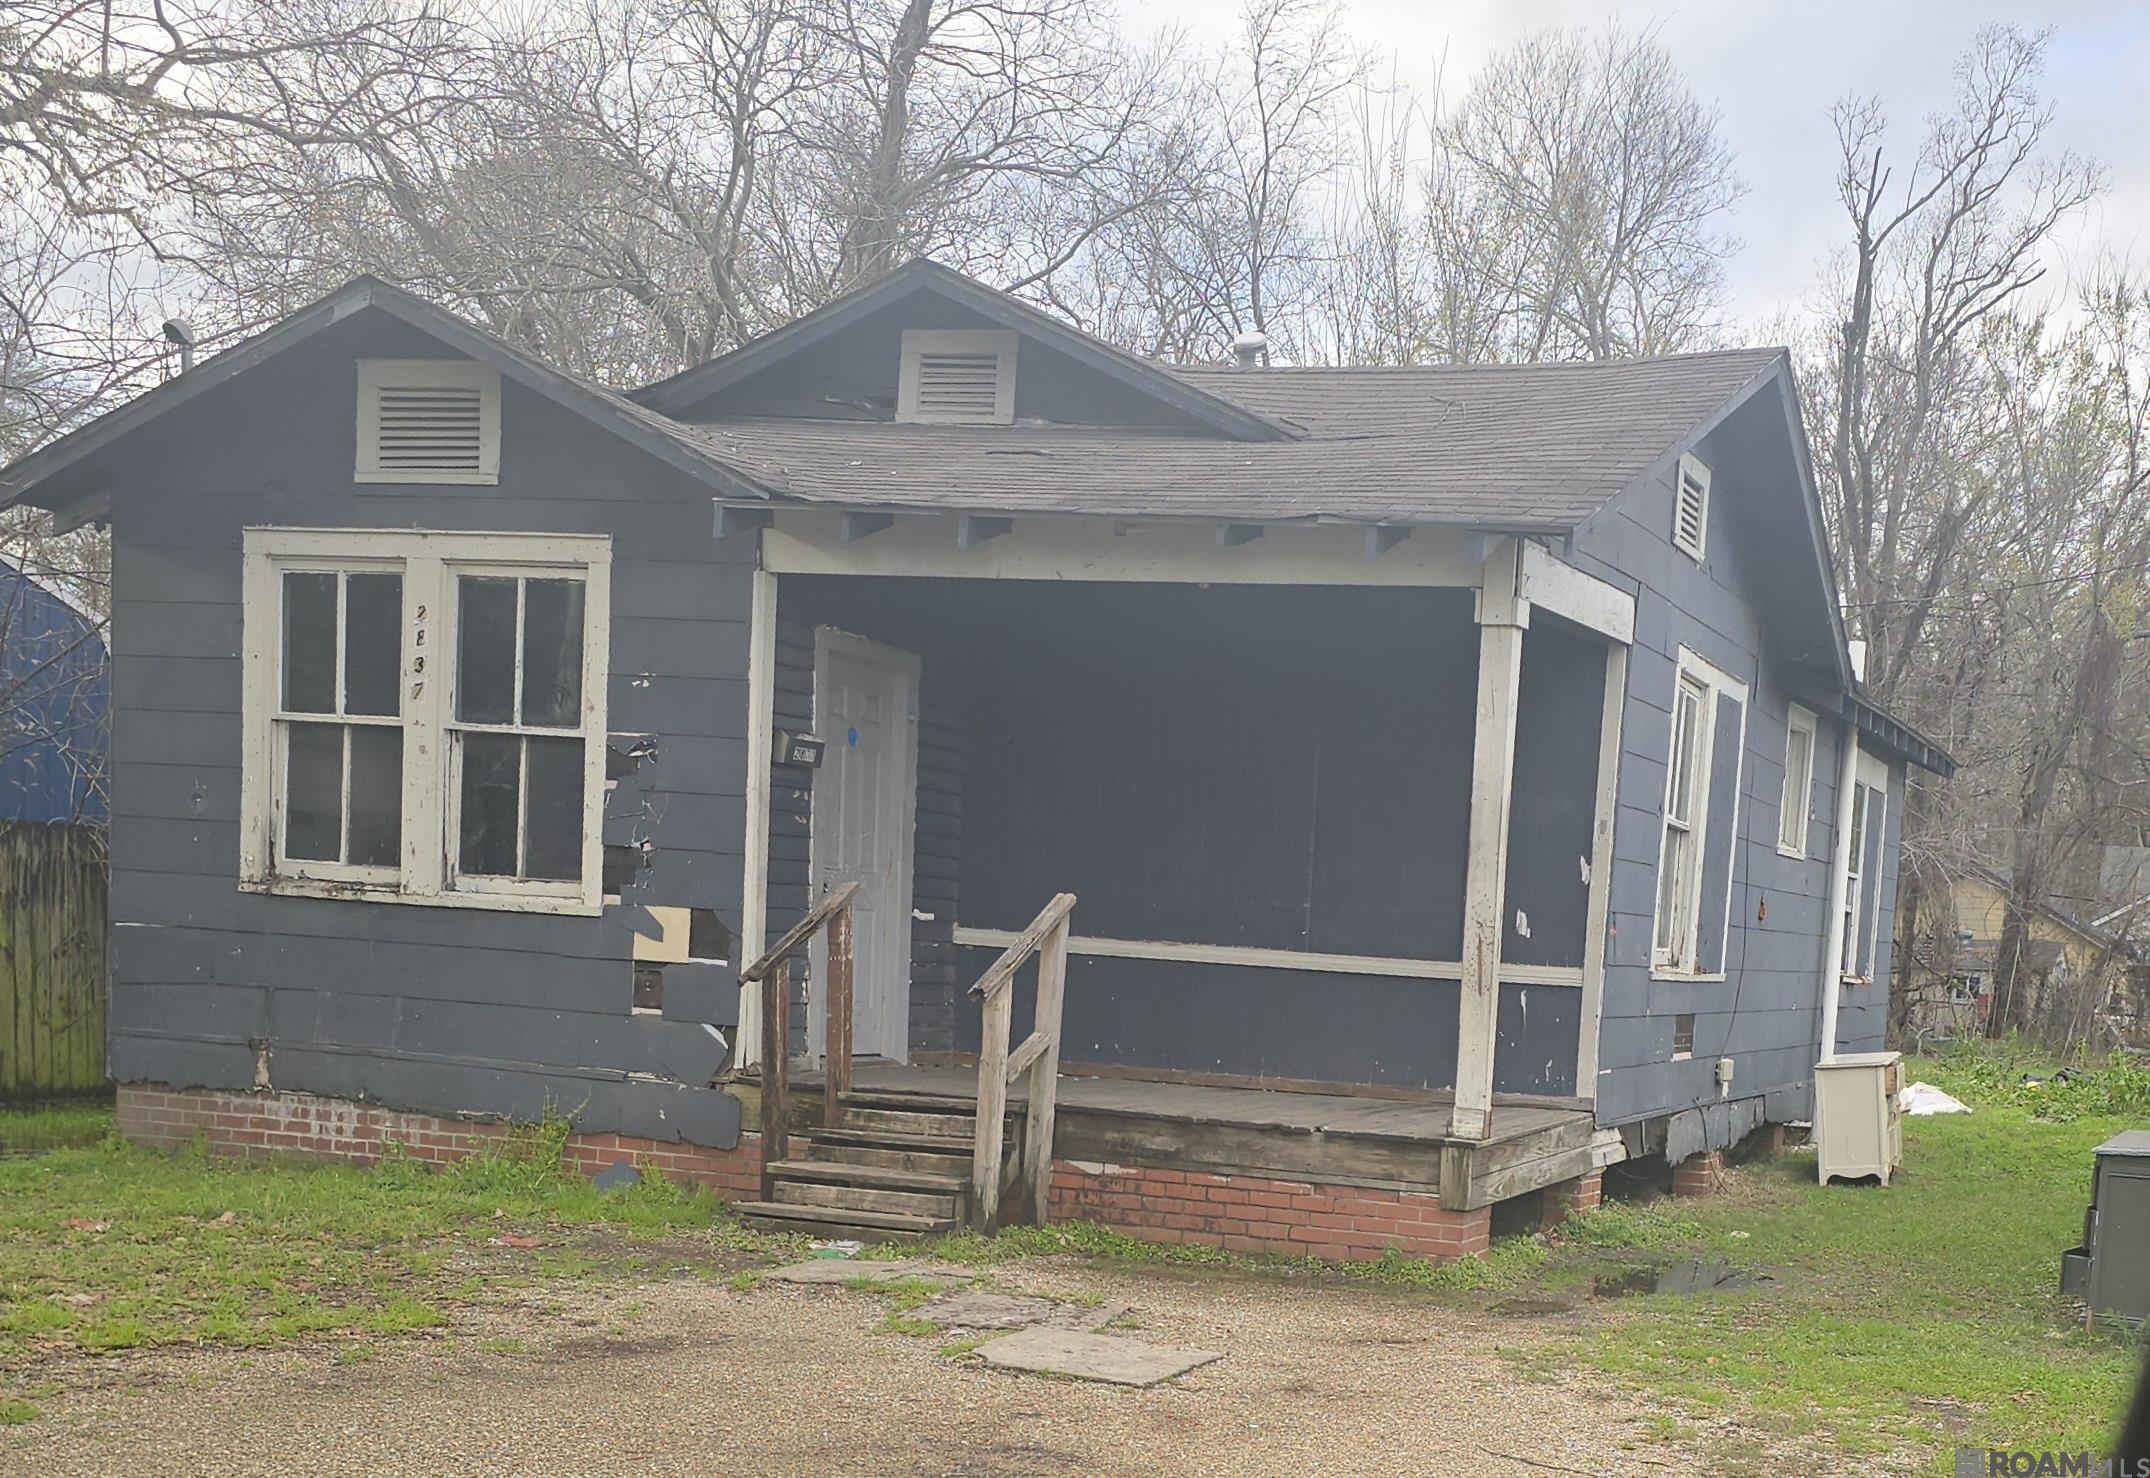
$35,000
3
bds
|
1
ba
|
756
sqft
|
built
1950
2837 Ozark St, Baton Rouge, LA 70805
$552
Cash flow
18.4%
Cash-on-Cash Return
18.9%
Cap rate
2.3%
Rent to Value Ratio
Active
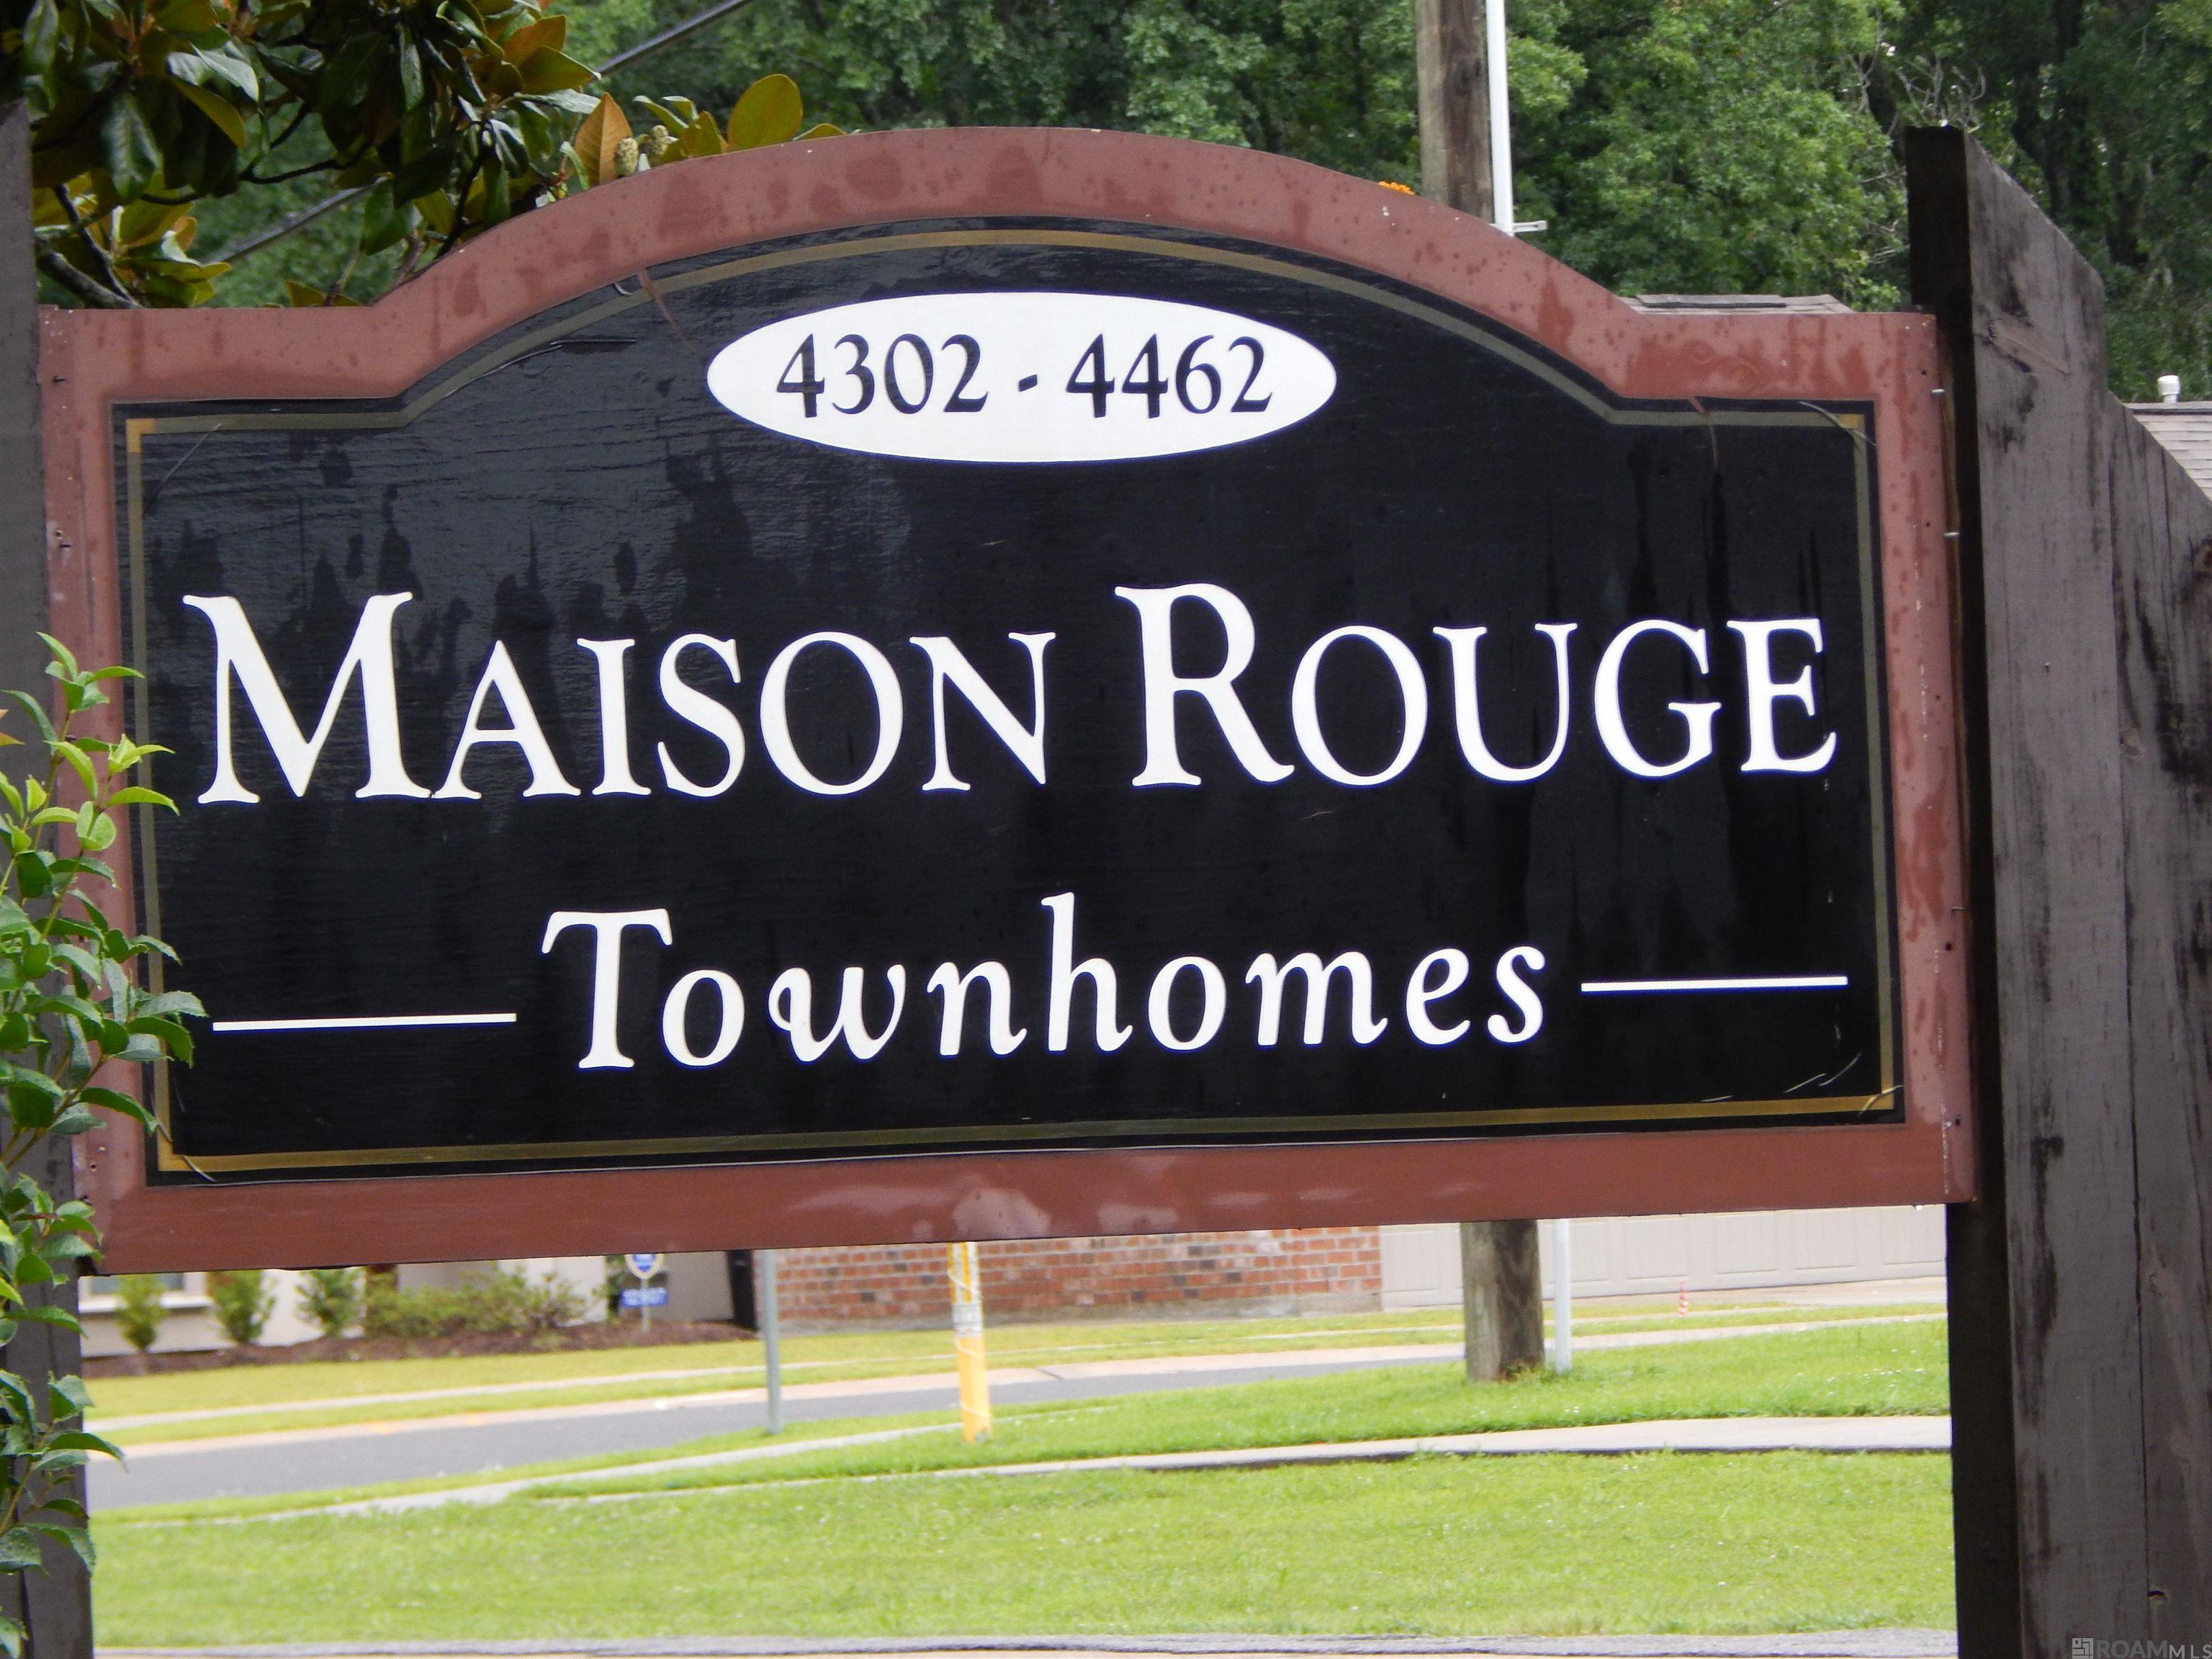
$130,000
2
bds
|
3
ba
|
1,186
sqft
|
built
1983
4352 Stumberg Ln, Baton Rouge, LA 70816
$266
Cash flow
10.7%
Cash-on-Cash Return
8.7%
Cap rate
1.1%
Rent to Value Ratio
996 out of 1,283 properties for sale in Baton Rouge, LA
Limited Results Shown
Create a free account, or log in to reveal all property listings and enjoy the complete experience.
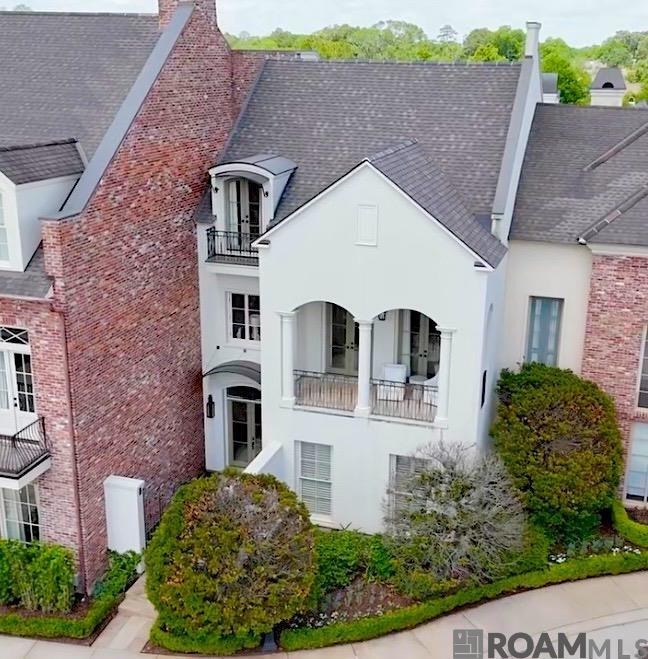
Active
$694,500
4
bds
|
3
ba
|
3,555
sqft
|
built
1978
9302 Hilltrace Ave, Baton Rouge, LA 70809
$-1,548
Cash flow
-11.6%
Cash-on-Cash Return
3.6%
Cap rate
0.4%
Rent to Value Ratio
Active
$3,500,000
bds
|
0
ba
|
36,000
sqft
|
built
7272 Burbank Dr, Baton Rouge, LA 70820
$-17,363
Cash flow
-25.9%
Cash-on-Cash Return
0.3%
Cap rate
0.0%
Rent to Value Ratio
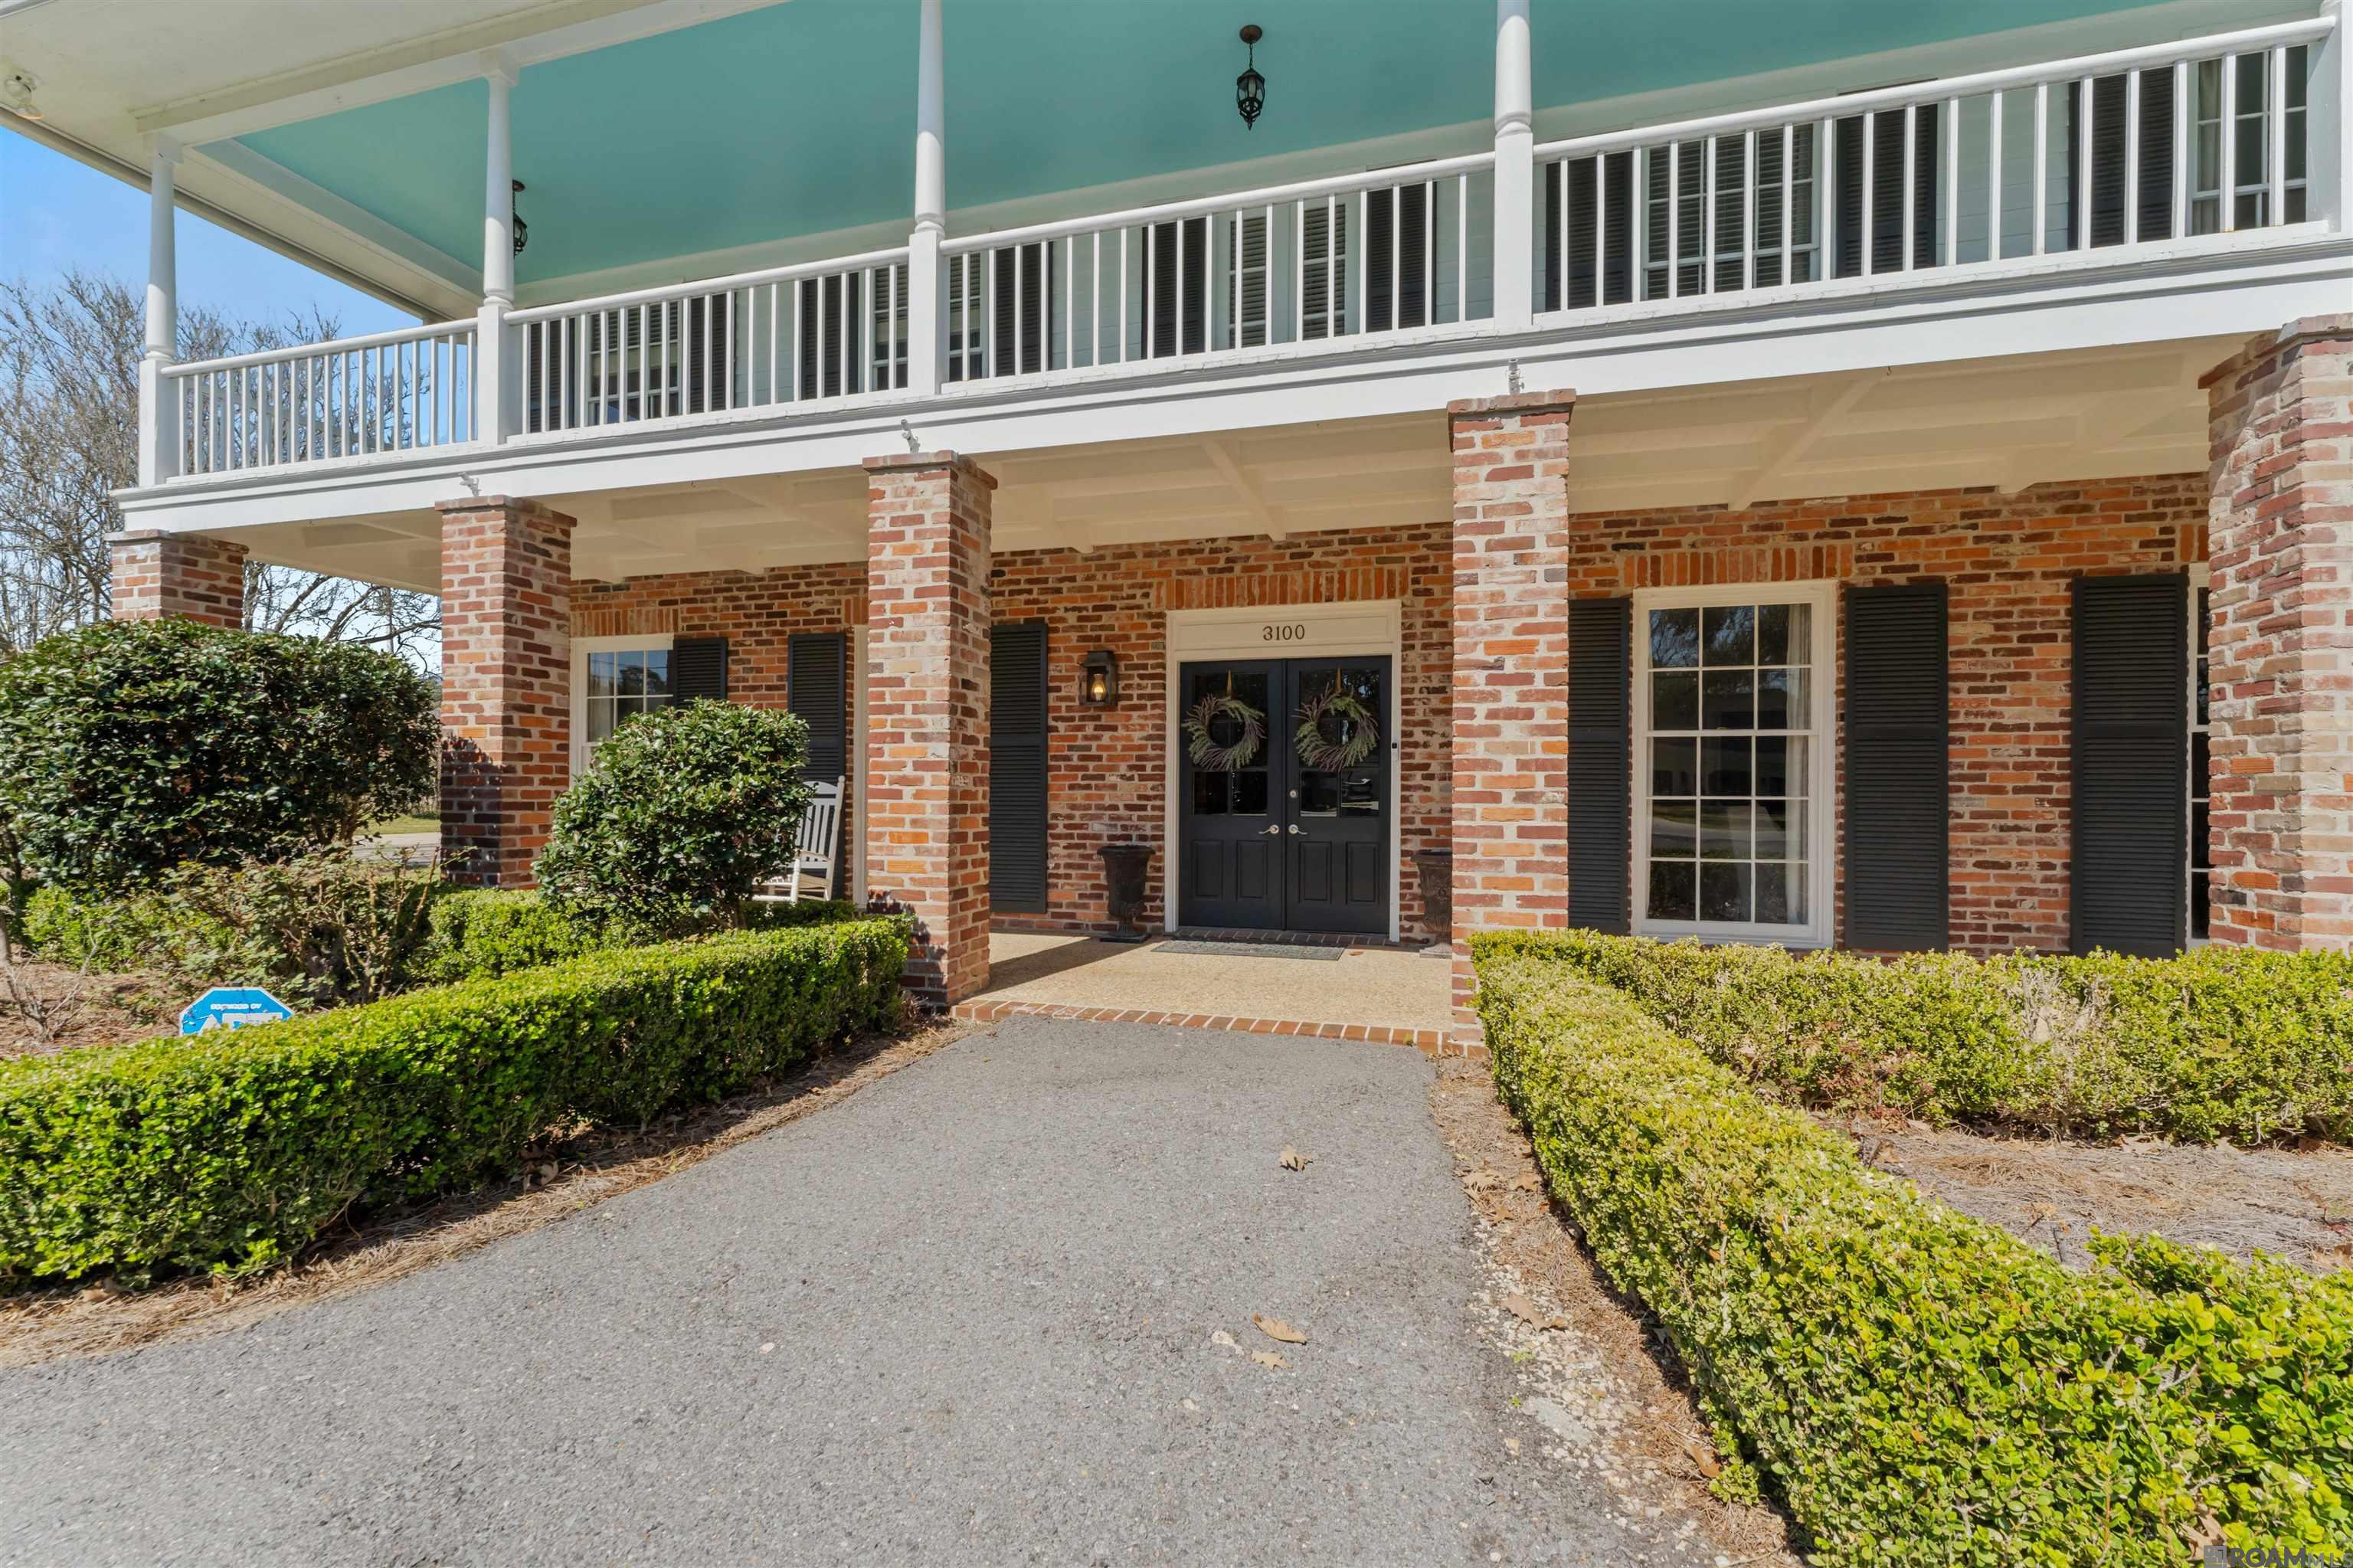
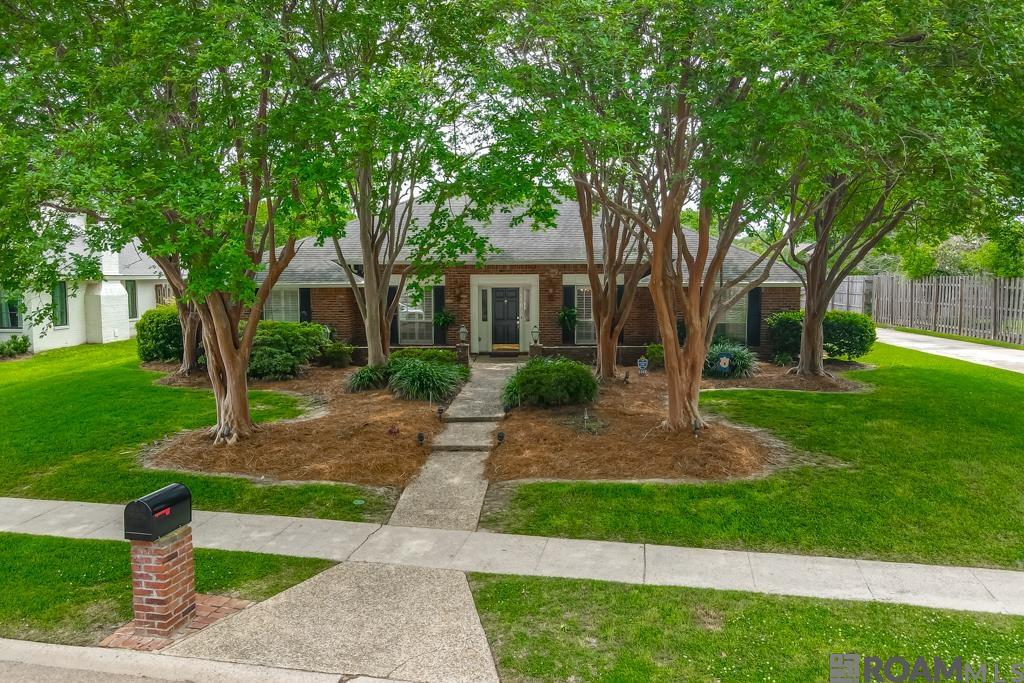
Active
$949,900
5
bds
|
4
ba
|
3,930
sqft
|
built
1967
3100 Fairway Dr, Baton Rouge, LA 70809
$-1,455
Cash flow
-8.0%
Cash-on-Cash Return
4.4%
Cap rate
0.5%
Rent to Value Ratio
Active
$419,000
4
bds
|
3
ba
|
2,643
sqft
|
built
1966
8566 E Thurman Dr, Baton Rouge, LA 70806
$-607
Cash flow
-7.6%
Cash-on-Cash Return
4.5%
Cap rate
0.5%
Rent to Value Ratio
Active
$485,000
4
bds
|
3
ba
|
2,215
sqft
|
built
1993
19344 S Trent Jones Dr, Baton Rouge, LA 70810
$-666
Cash flow
-7.2%
Cash-on-Cash Return
4.6%
Cap rate
0.6%
Rent to Value Ratio
Active
$315,000
3
bds
|
2
ba
|
2,030
sqft
|
built
2000
1715 Foxton Ct, Baton Rouge, LA 70815
$-291
Cash flow
-4.8%
Cash-on-Cash Return
5.2%
Cap rate
0.6%
Rent to Value Ratio
Active
$585,000
5
bds
|
4
ba
|
3,448
sqft
|
built
1993
6553 Double Tree Dr, Baton Rouge, LA 70817
$-397
Cash flow
-3.5%
Cash-on-Cash Return
5.5%
Cap rate
0.7%
Rent to Value Ratio
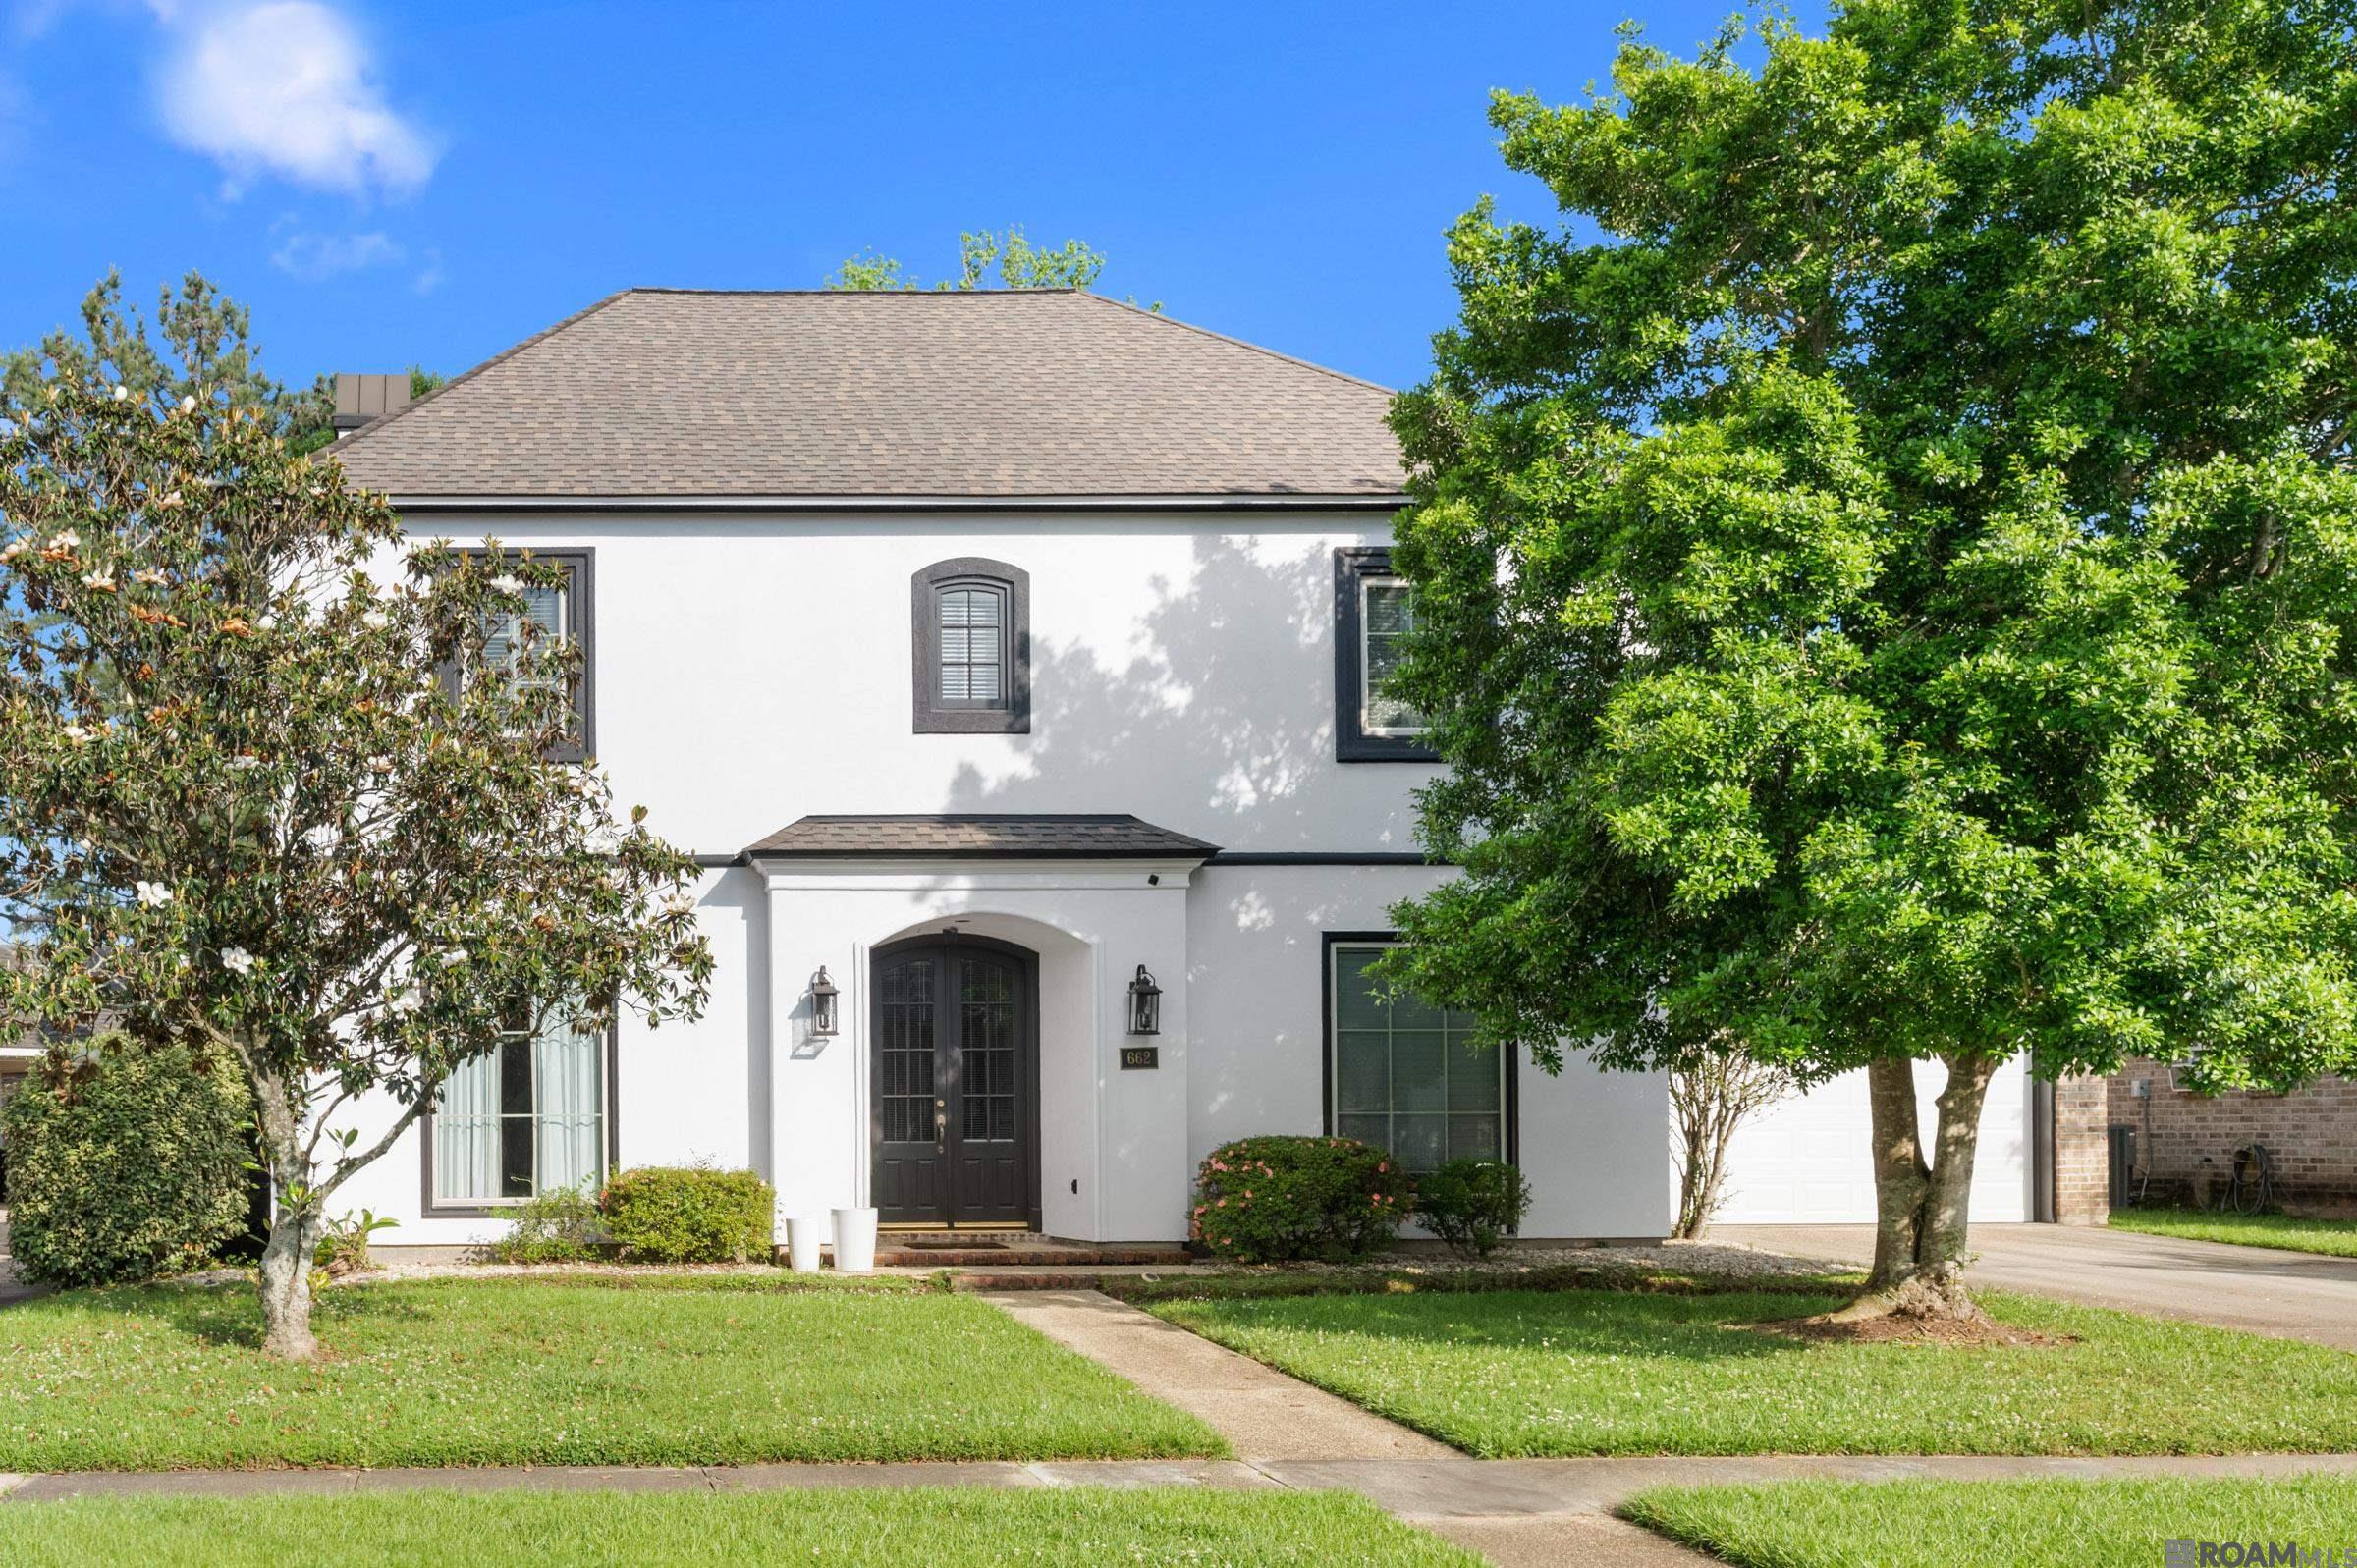
Active
$490,000
3
bds
|
3
ba
|
2,597
sqft
|
built
1997
662 Wheatsheaf Dr, Baton Rouge, LA 70810
$-375
Cash flow
-4.0%
Cash-on-Cash Return
5.4%
Cap rate
0.7%
Rent to Value Ratio
Active
$3,450,000
bds
|
0
ba
|
30,000
sqft
|
built
1984
11352 Bard Ave, Baton Rouge, LA 70815
$-17,101
Cash flow
-25.9%
Cash-on-Cash Return
0.3%
Cap rate
0.0%
Rent to Value Ratio
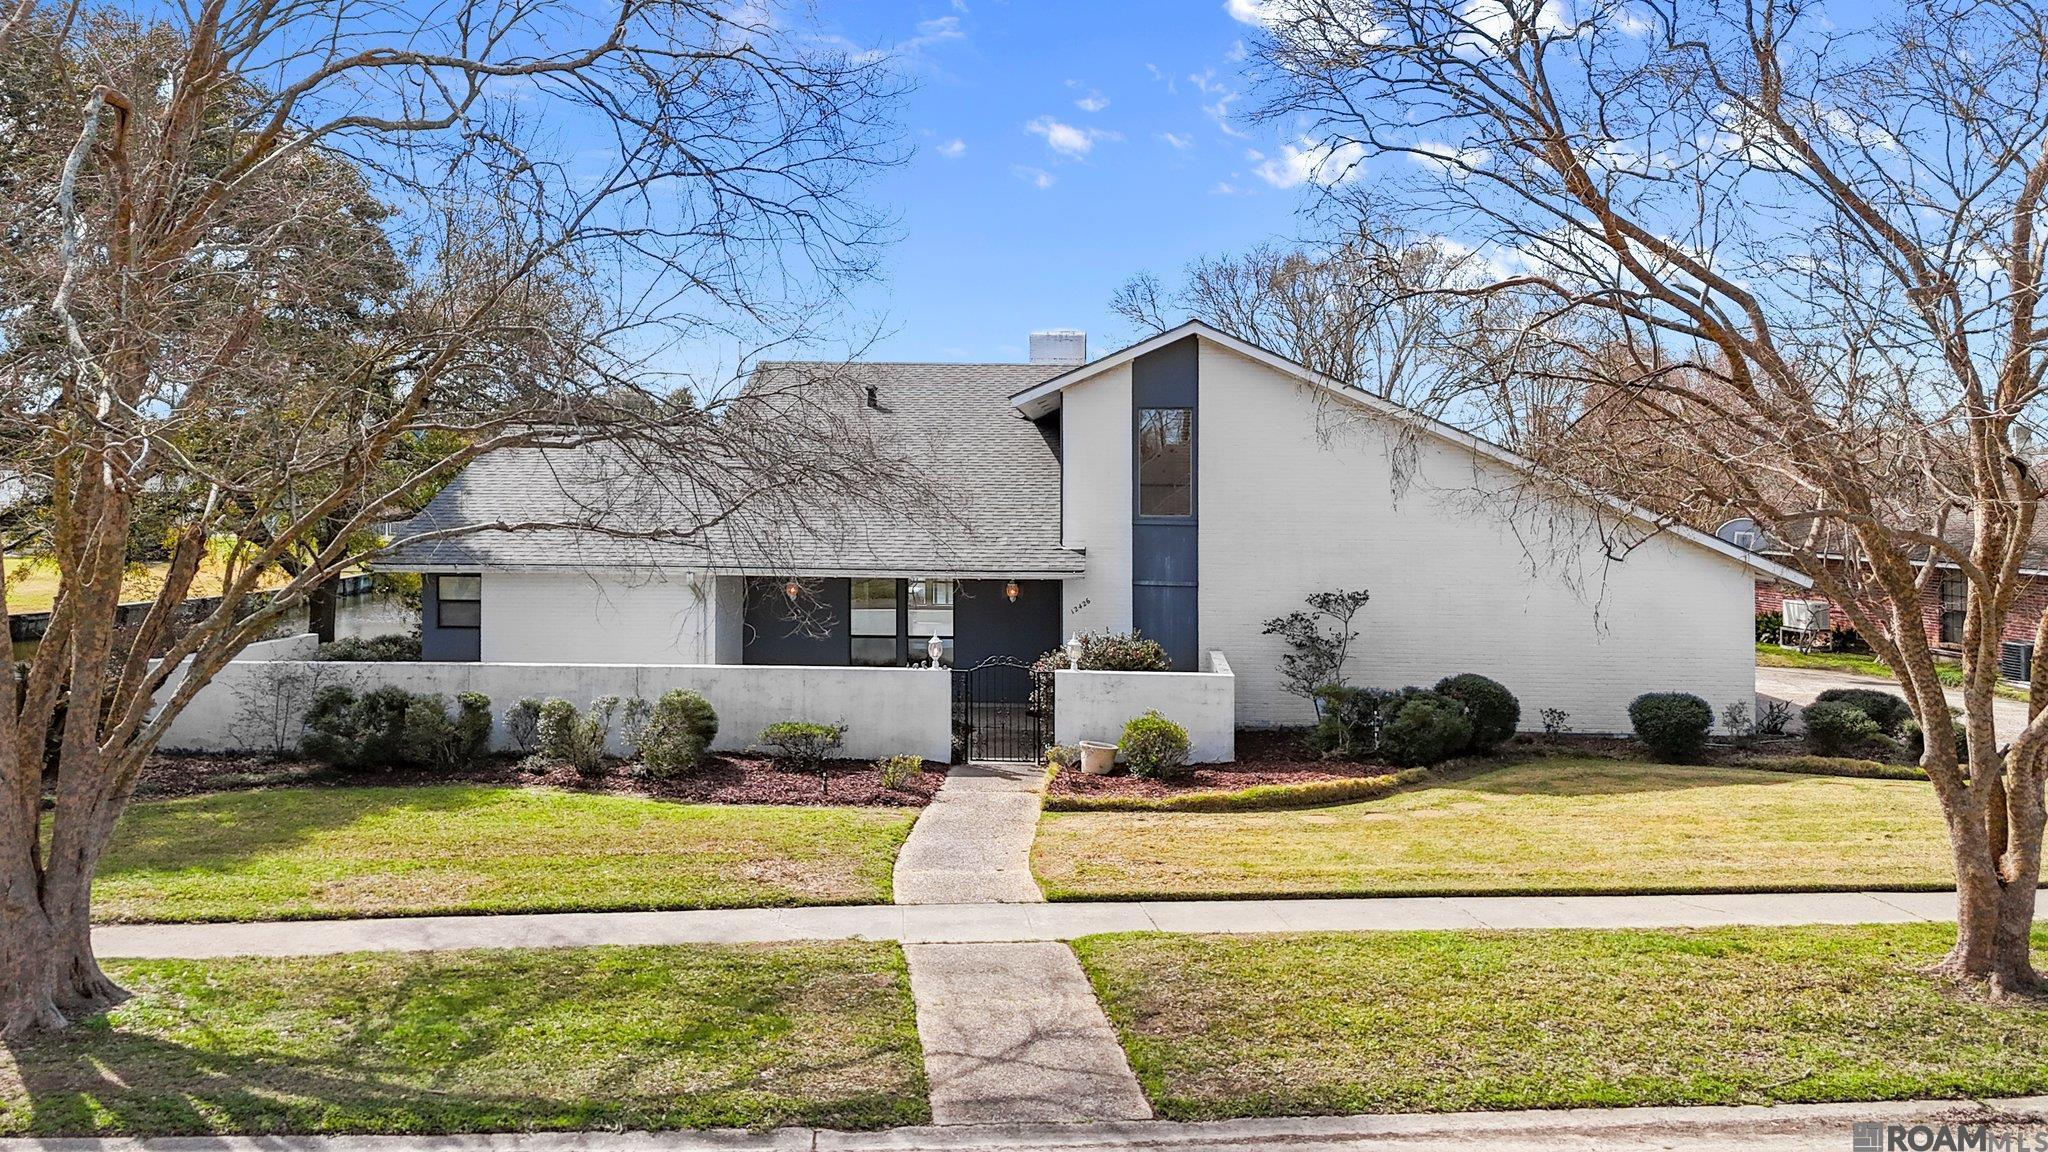
Active
$650,000
4
bds
|
3
ba
|
3,725
sqft
|
built
1979
12426 Lake Sherwood Ave N, Baton Rouge, LA 70816
$-1,265
Cash flow
-10.2%
Cash-on-Cash Return
3.9%
Cap rate
0.5%
Rent to Value Ratio
Active
$439,000
4
bds
|
3
ba
|
2,497
sqft
|
built
2005
8659 Highcrest Dr, Baton Rouge, LA 70809
$-392
Cash flow
-4.7%
Cash-on-Cash Return
5.2%
Cap rate
0.6%
Rent to Value Ratio
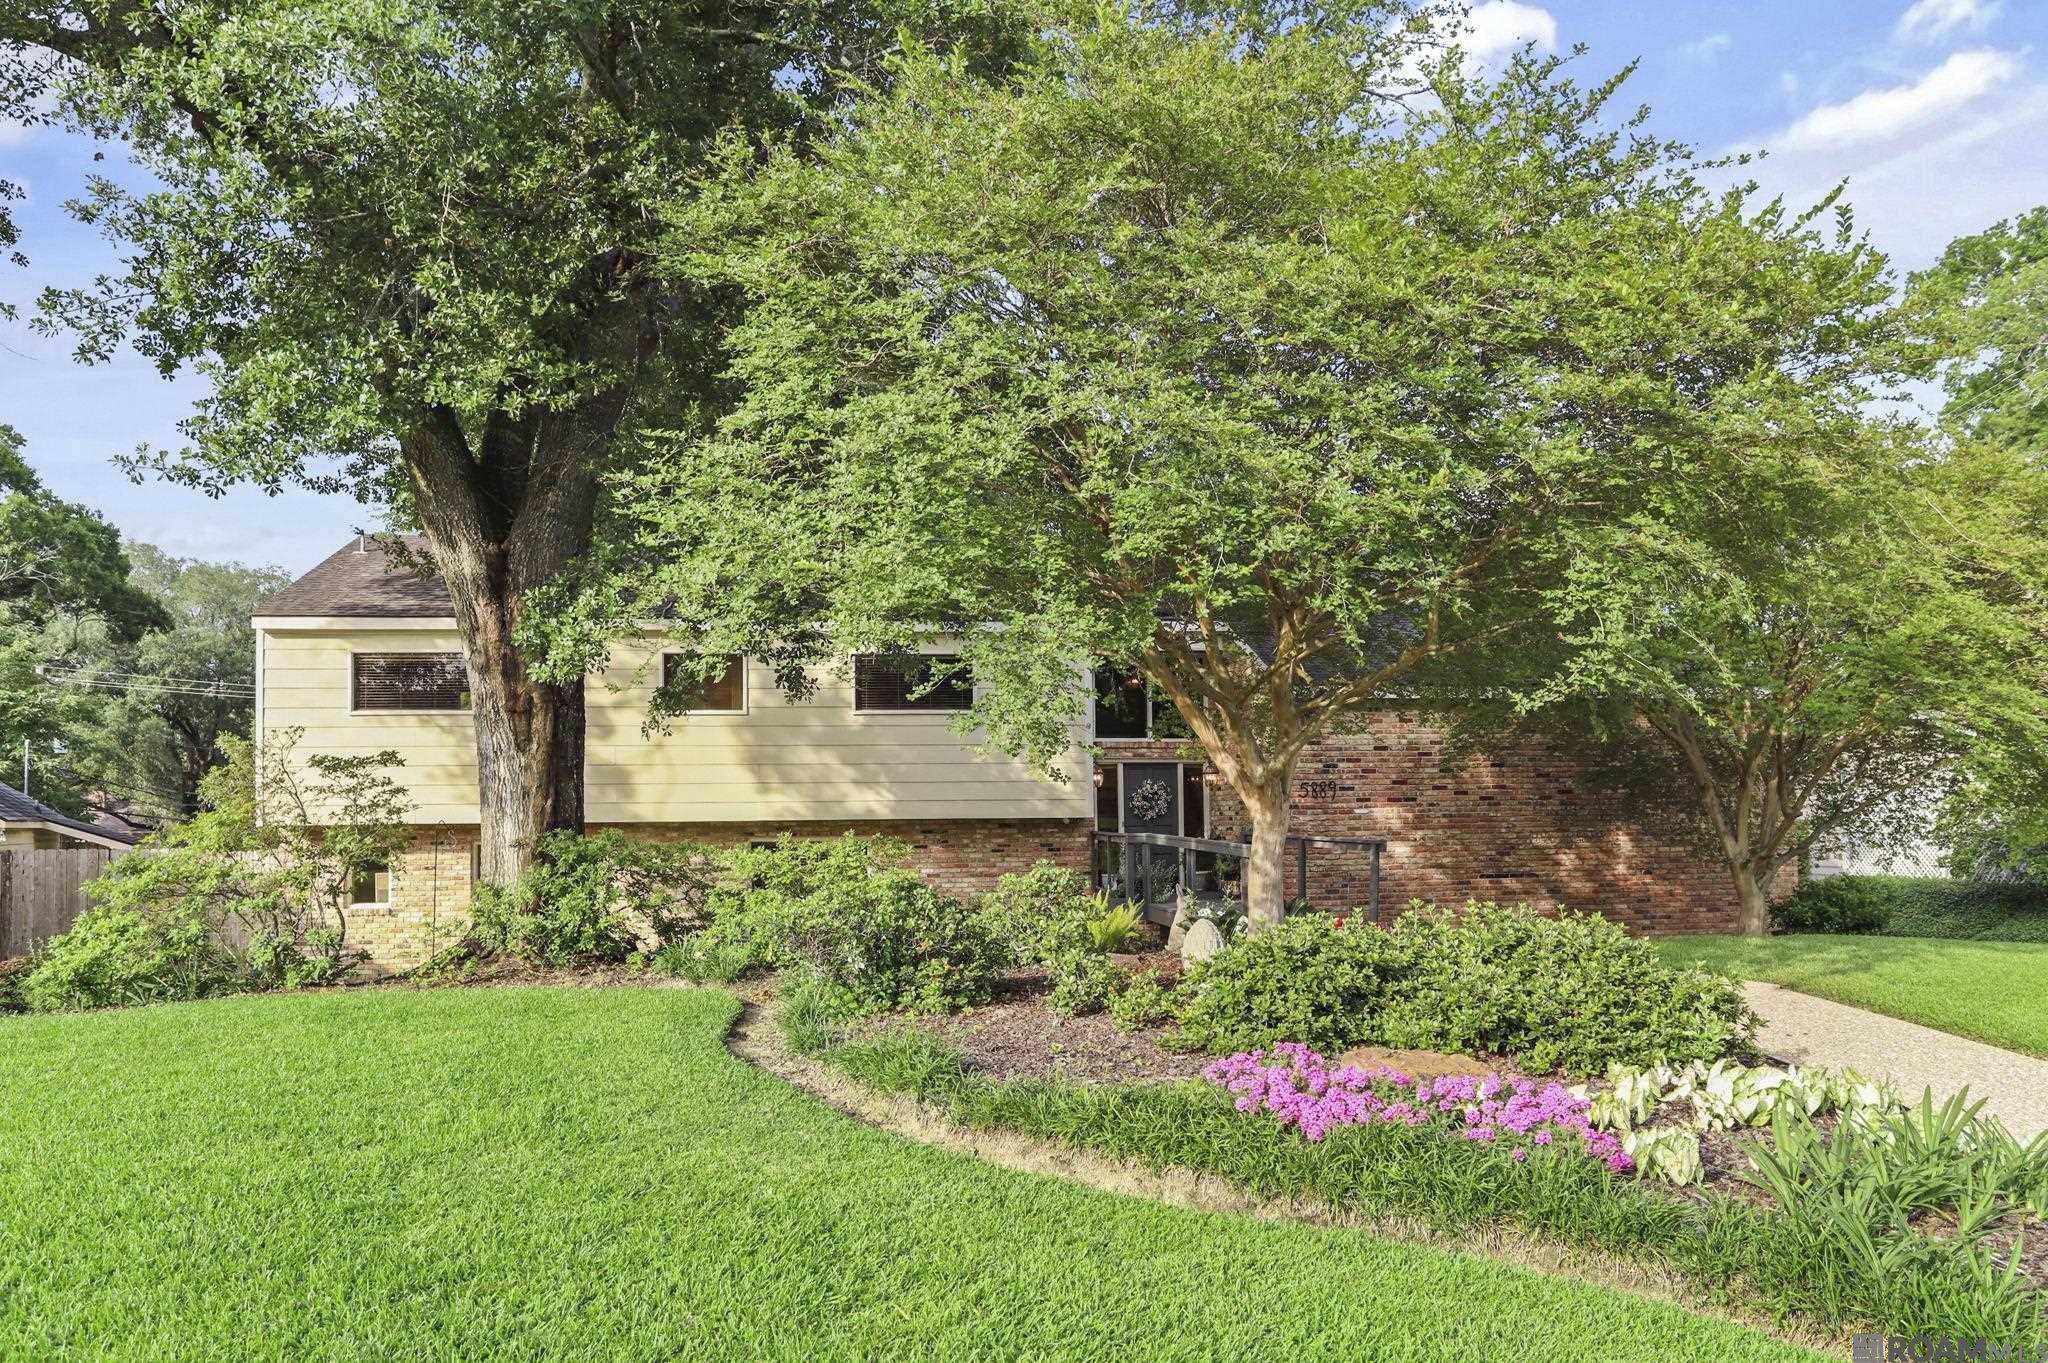
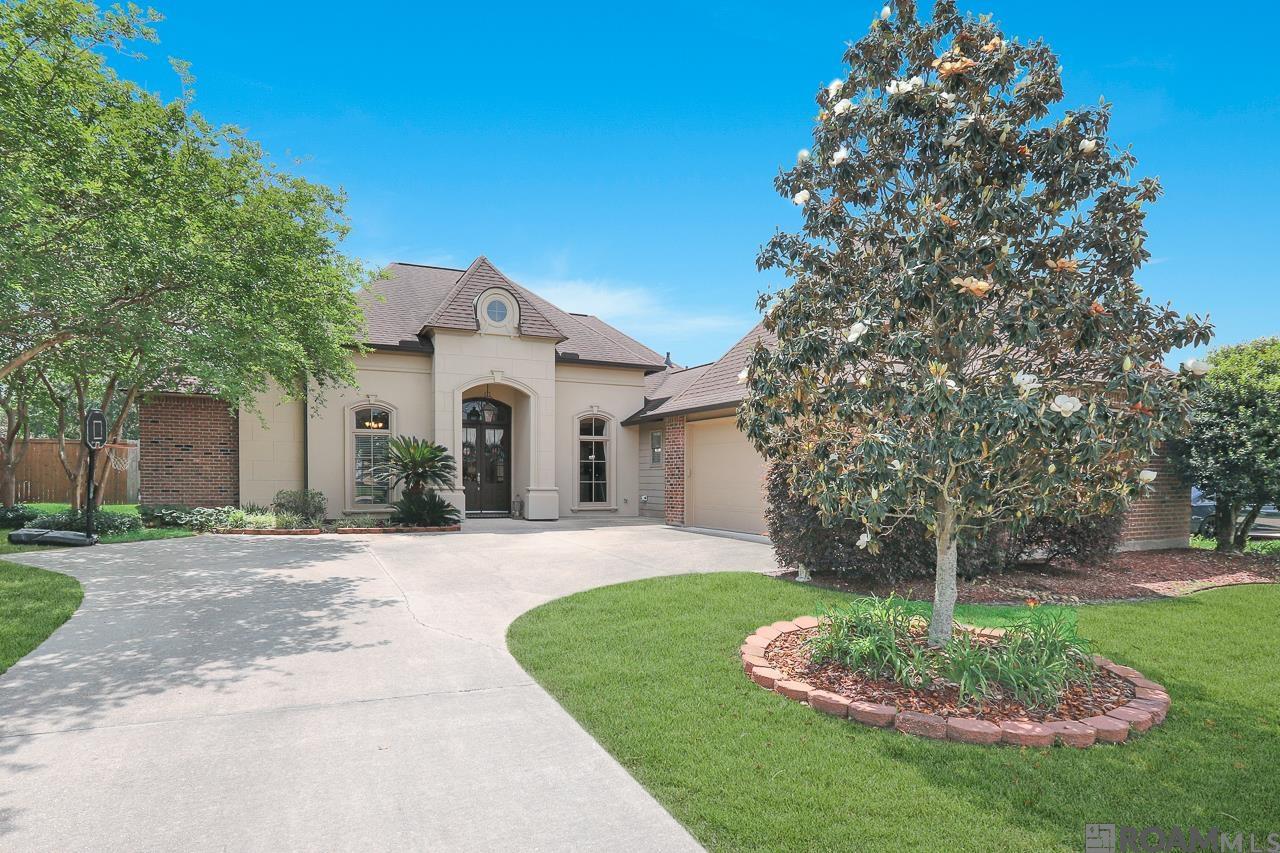
Active
$492,000
3
bds
|
3
ba
|
2,743
sqft
|
built
1977
5889 Hyacinth Ave, Baton Rouge, LA 70808
$-644
Cash flow
-6.8%
Cash-on-Cash Return
4.7%
Cap rate
0.6%
Rent to Value Ratio
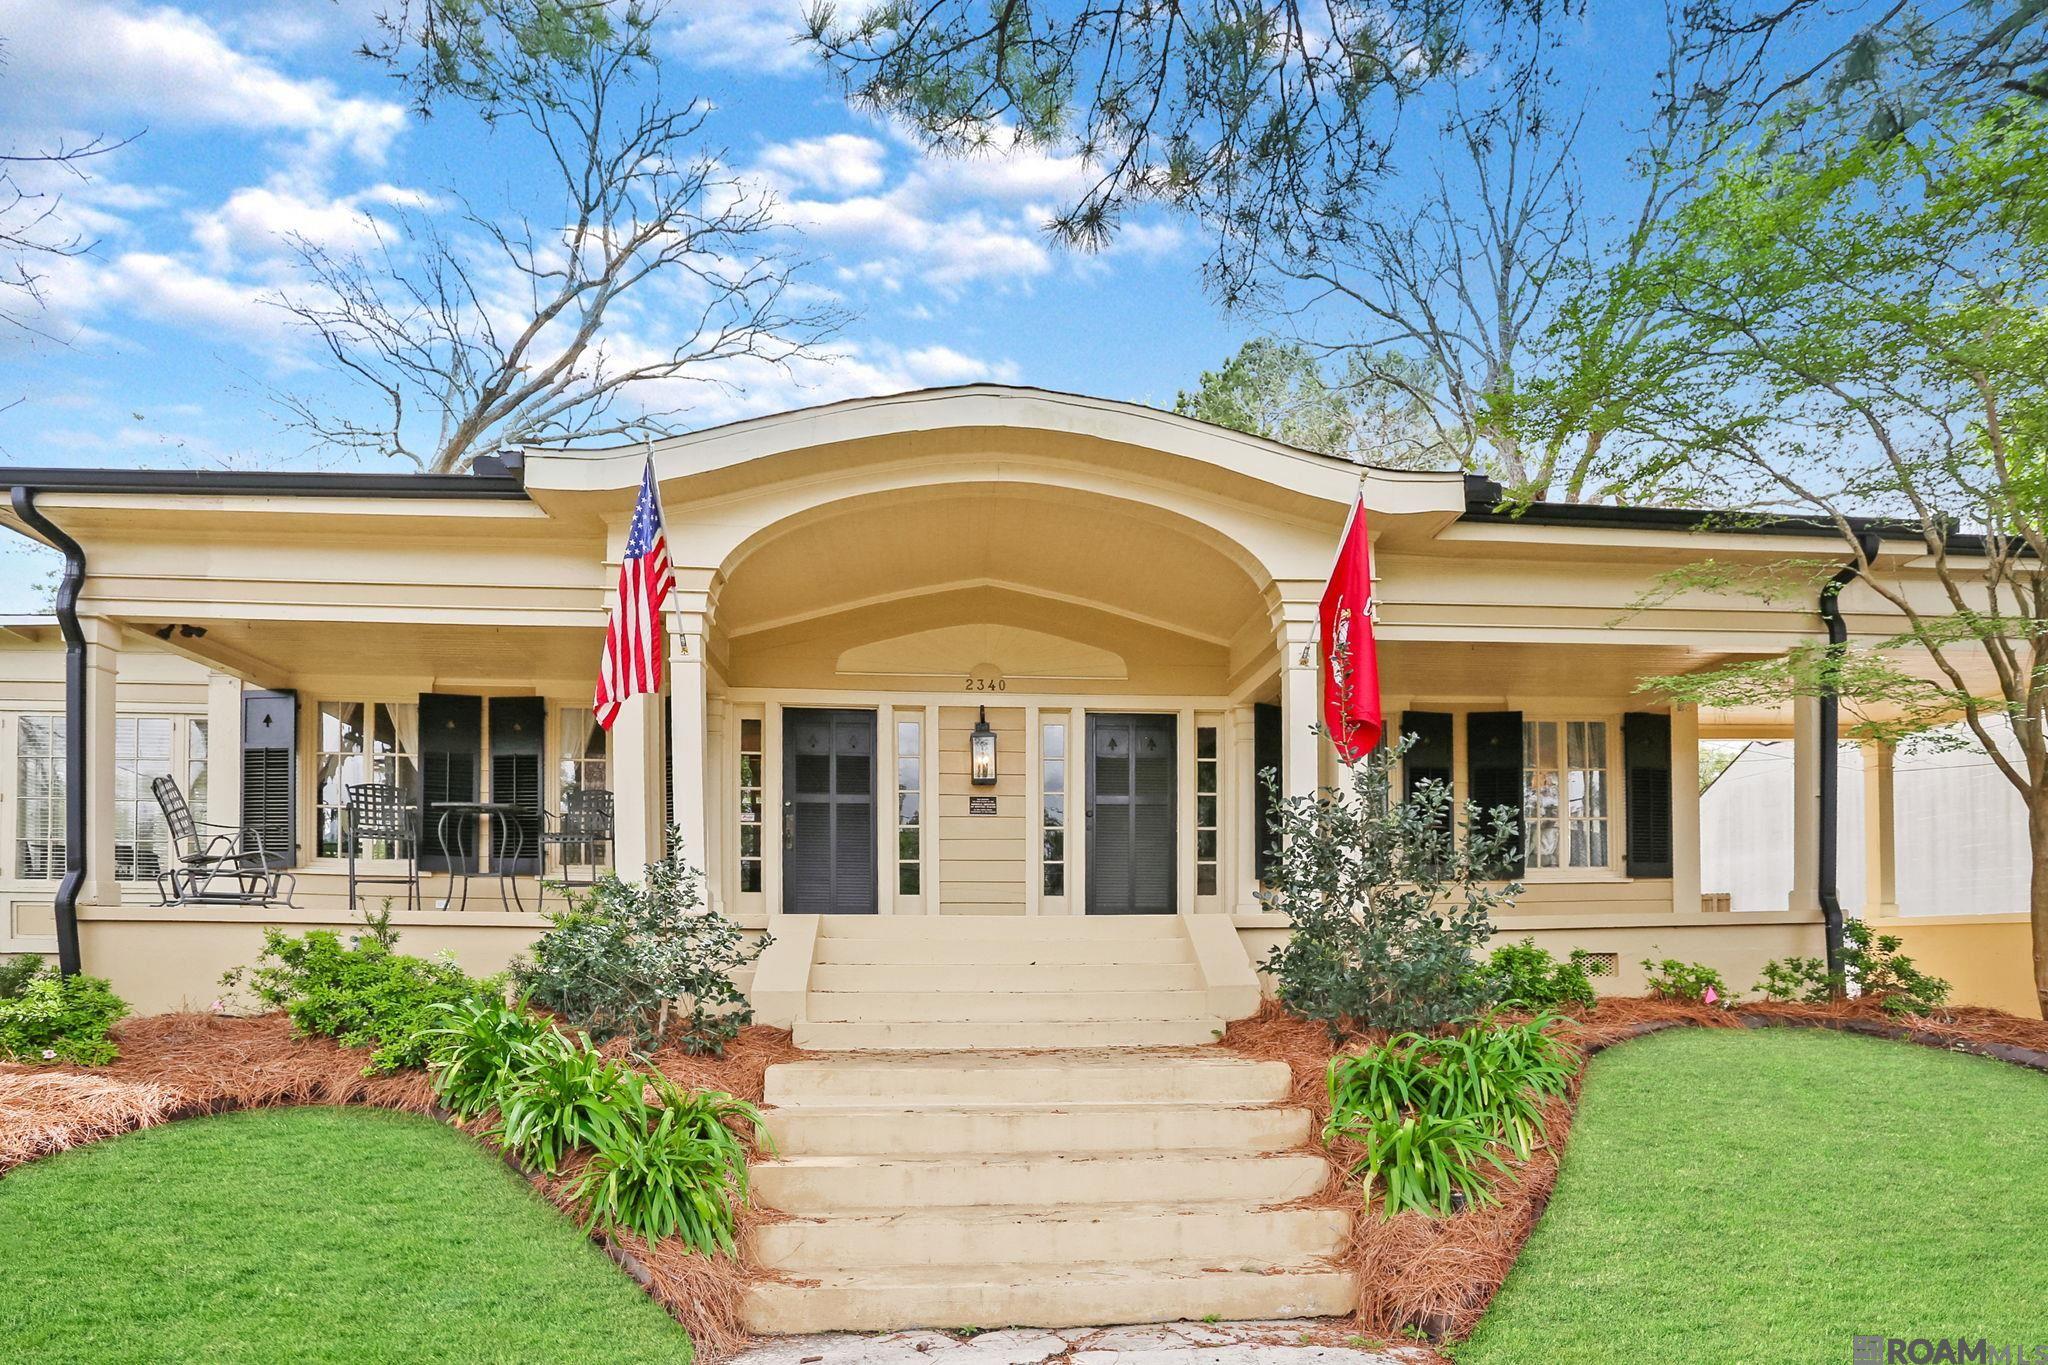
Active
$730,000
4
bds
|
3
ba
|
2,628
sqft
|
built
1921
2340 Government St, Baton Rouge, LA 70806
$-2,098
Cash flow
-15.0%
Cash-on-Cash Return
2.8%
Cap rate
0.3%
Rent to Value Ratio
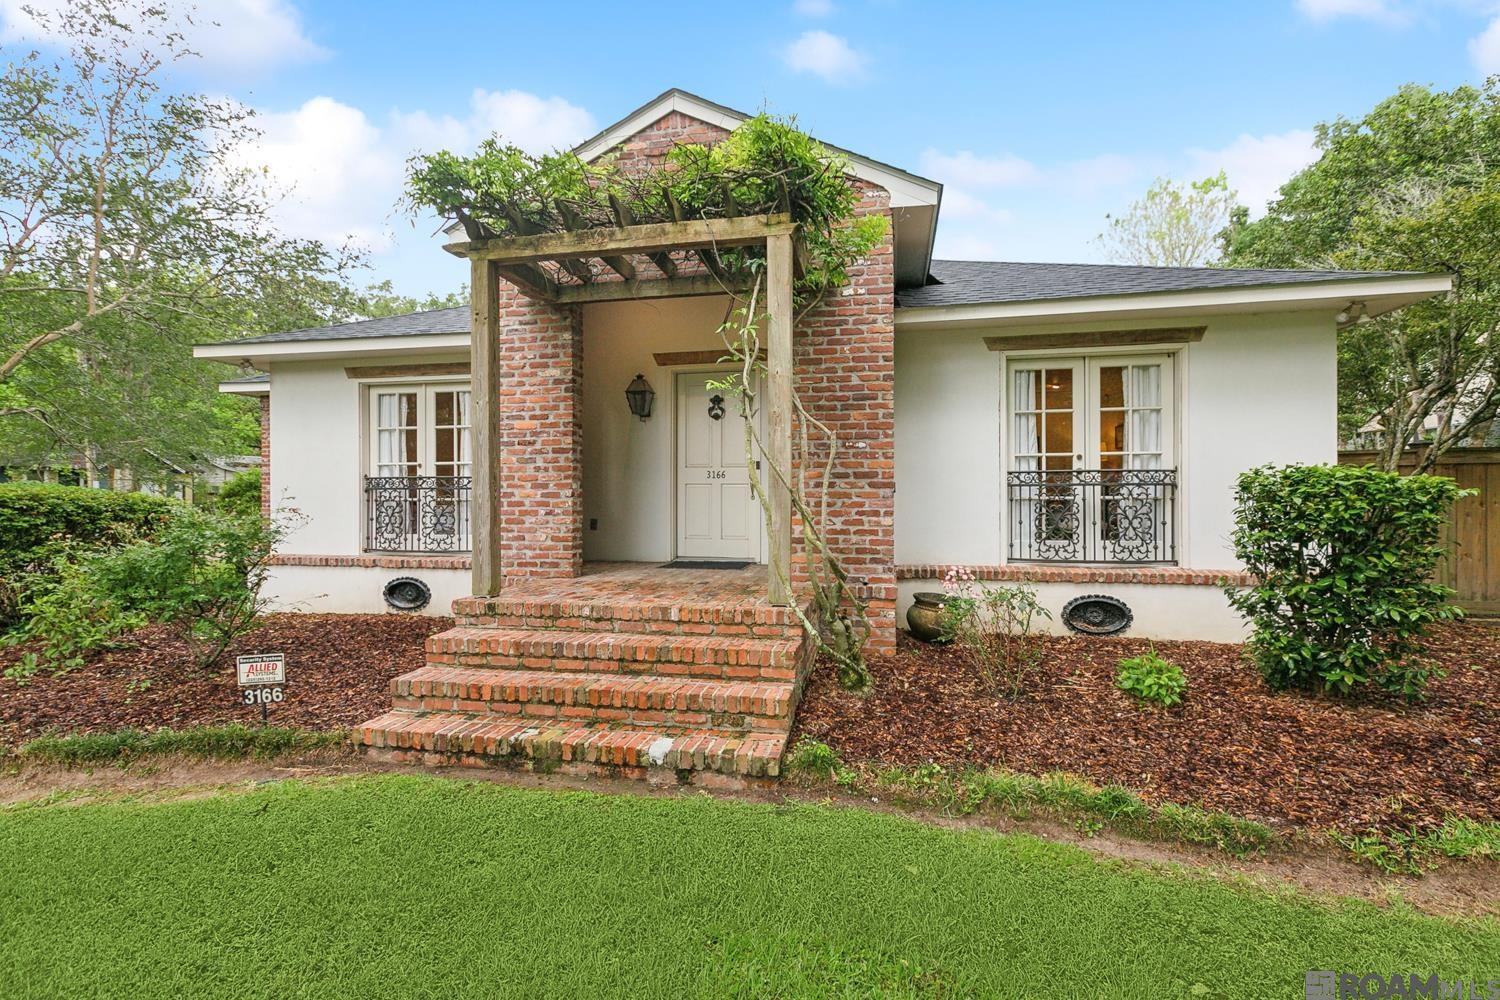
Active
$629,000
4
bds
|
3
ba
|
2,656
sqft
|
built
1999
3166 Tyrone Dr, Baton Rouge, LA 70808
$-603
Cash flow
-5.0%
Cash-on-Cash Return
5.1%
Cap rate
0.6%
Rent to Value Ratio

Active
$259,000
2
bds
|
1
ba
|
1,191
sqft
|
built
1940
144 Hearthstone Dr, Baton Rouge, LA 70806
$-252
Cash flow
-5.1%
Cash-on-Cash Return
5.1%
Cap rate
0.6%
Rent to Value Ratio

Active
$1,695,000
4
bds
|
6
ba
|
5,086
sqft
|
built
2001
1834 Old Carriage Ln, Baton Rouge, LA 70806
$-6,047
Cash flow
-18.6%
Cash-on-Cash Return
2.0%
Cap rate
0.2%
Rent to Value Ratio
Active
$1,290,000
3
bds
|
5
ba
|
4,830
sqft
|
built
2010
10 Country Club Pl, Baton Rouge, LA 70809
$-4,746
Cash flow
-19.2%
Cash-on-Cash Return
1.9%
Cap rate
0.3%
Rent to Value Ratio
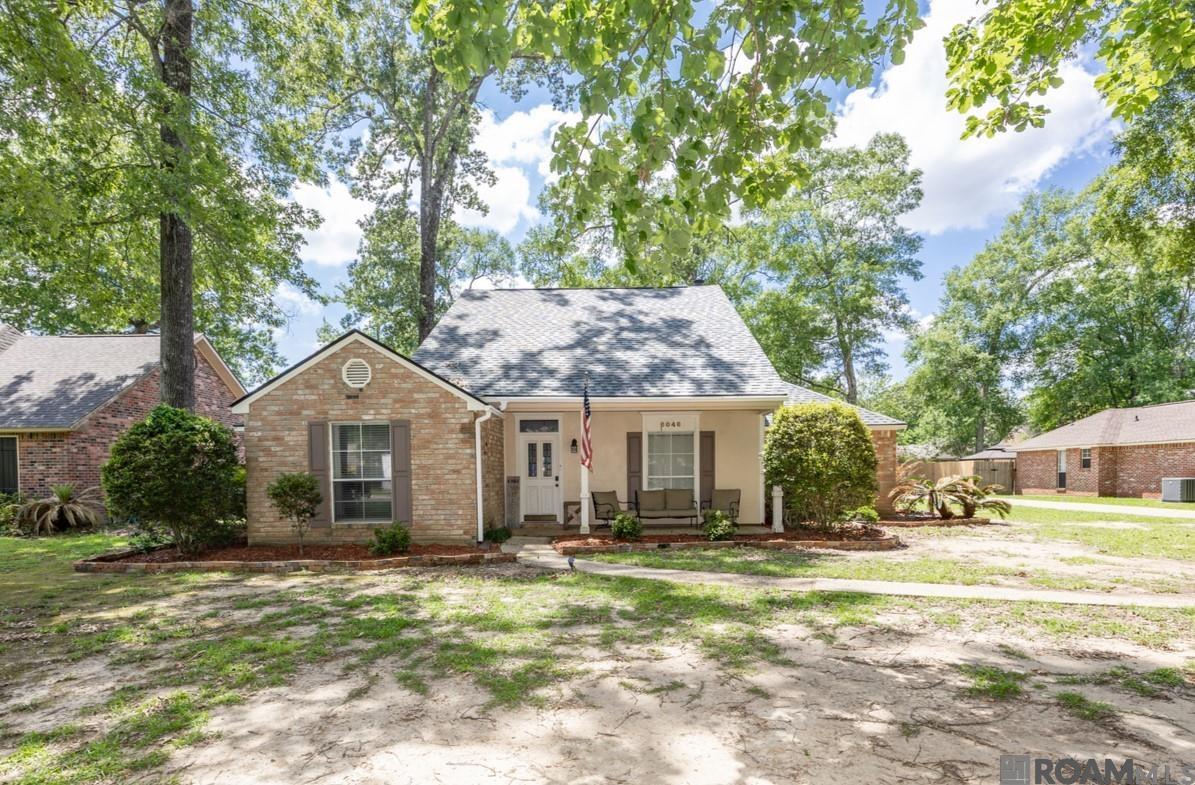
Active
$440,000
4
bds
|
3
ba
|
2,464
sqft
|
built
1986
6046 Hagerstown Dr, Baton Rouge, LA 70817
$-397
Cash flow
-4.7%
Cash-on-Cash Return
5.2%
Cap rate
0.6%
Rent to Value Ratio

Active
$770,000
5
bds
|
3
ba
|
3,773
sqft
|
built
1958
4528 Claycut Rd, Baton Rouge, LA 70806
$-1,272
Cash flow
-8.6%
Cash-on-Cash Return
4.3%
Cap rate
0.5%
Rent to Value Ratio
Active
$35,000
3
bds
|
1
ba
|
756
sqft
|
built
1950
2837 Ozark St, Baton Rouge, LA 70805
$552
Cash flow
18.4%
Cash-on-Cash Return
18.9%
Cap rate
2.3%
Rent to Value Ratio

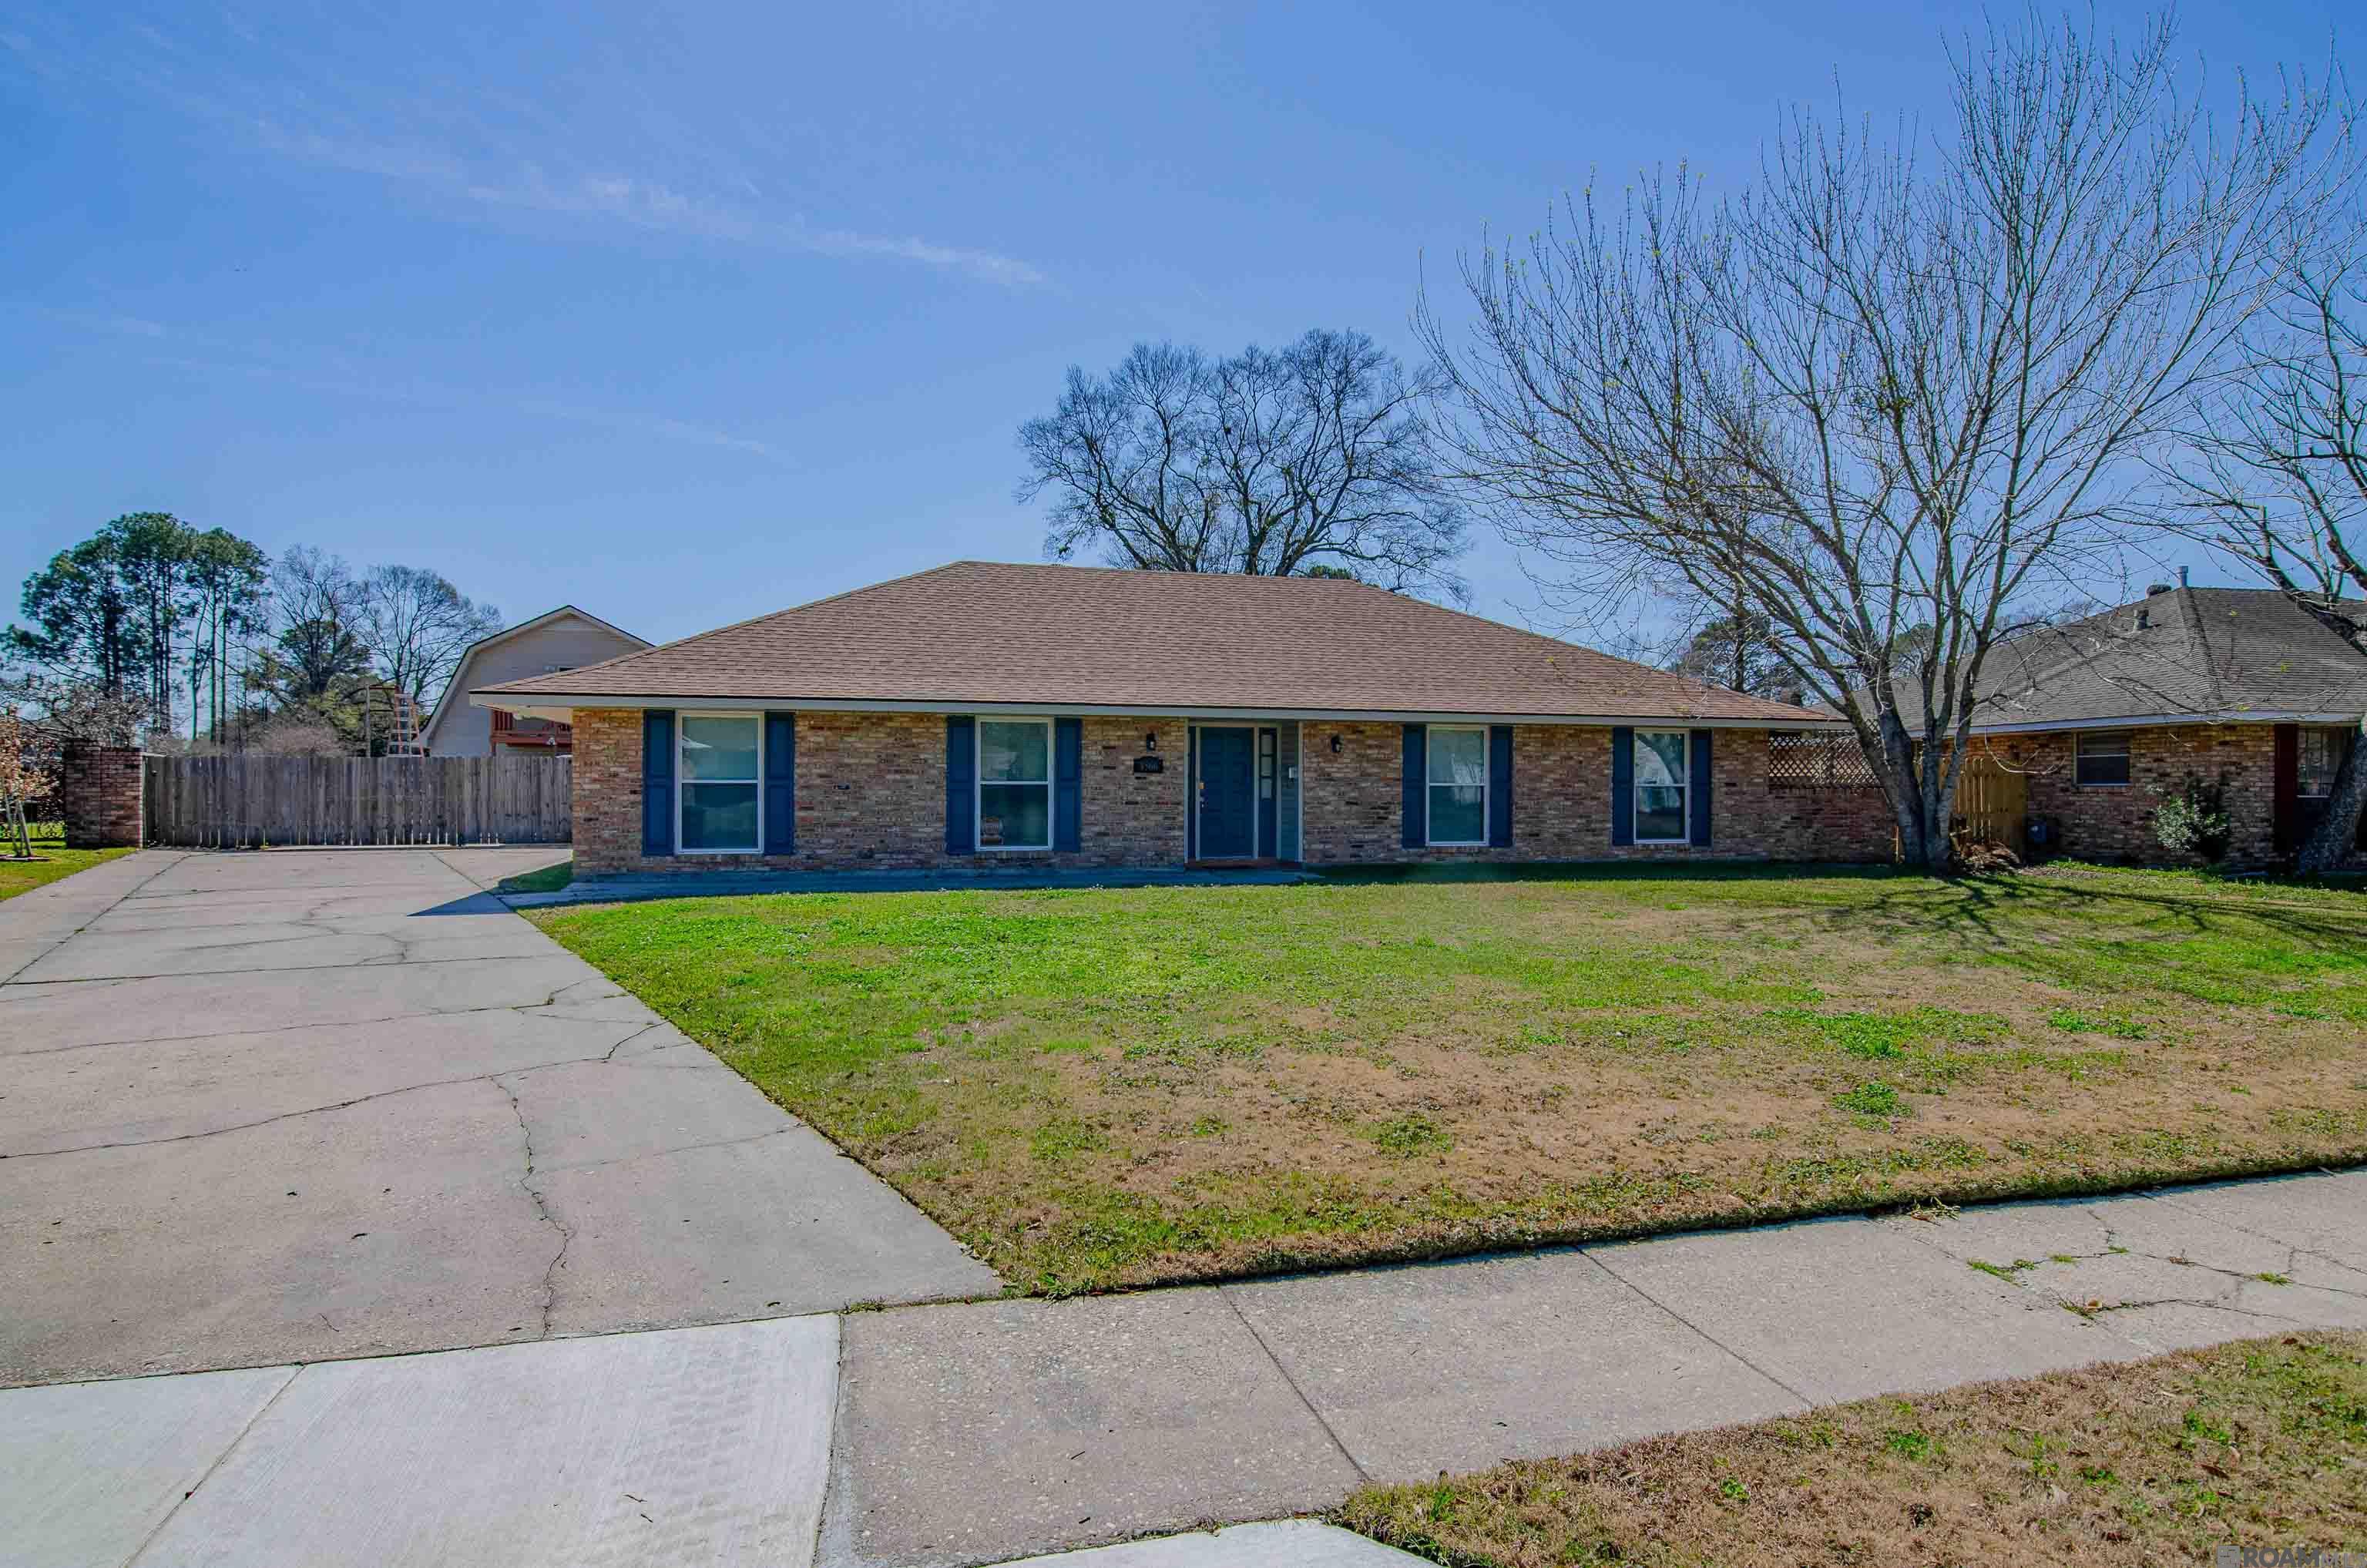
Active
$675,000
4
bds
|
3
ba
|
2,906
sqft
|
built
2011
15233 Summer Park Ln, Baton Rouge, LA 70817
$-1,449
Cash flow
-11.2%
Cash-on-Cash Return
3.7%
Cap rate
0.5%
Rent to Value Ratio
Active
$130,000
2
bds
|
3
ba
|
1,186
sqft
|
built
1983
4352 Stumberg Ln, Baton Rouge, LA 70816
$266
Cash flow
10.7%
Cash-on-Cash Return
8.7%
Cap rate
1.1%
Rent to Value Ratio
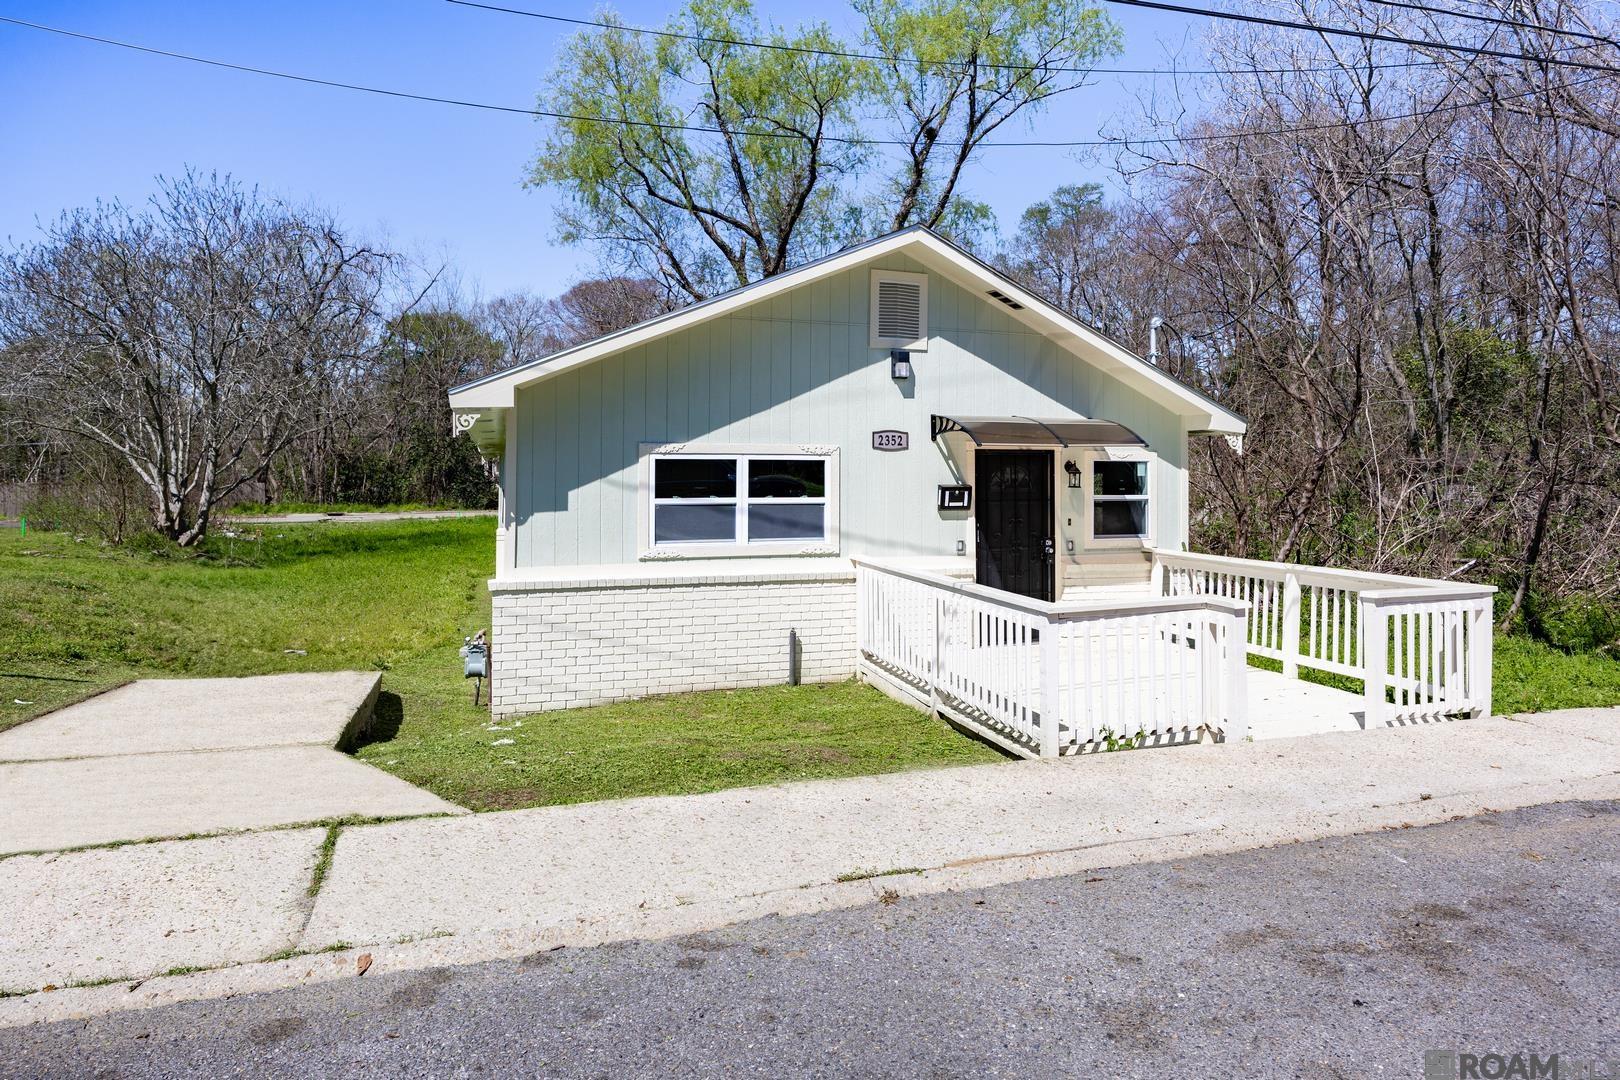
Active
$150,000
3
bds
|
2
ba
|
1,102
sqft
|
built
2352 Carolina St, Baton Rouge, LA 70802
$-96
Cash flow
-3.3%
Cash-on-Cash Return
5.5%
Cap rate
0.7%
Rent to Value Ratio
Active
$255,000
bds
|
0
ba
|
1,500
sqft
|
built
144-146 Beverly Dr, Baton Rouge, LA 70806
$-93
Cash flow
-1.9%
Cash-on-Cash Return
5.8%
Cap rate
0.7%
Rent to Value Ratio
Pending
$350,000
3
bds
|
2
ba
|
1,827
sqft
|
built
2005
10714 Hillbrook Ave, Baton Rouge, LA 70810
$66
Cash flow
1.0%
Cash-on-Cash Return
6.5%
Cap rate
0.8%
Rent to Value Ratio
Active
$339,500
4
bds
|
2
ba
|
1,778
sqft
|
built
2016
14017 Cirrus Dr, Baton Rouge, LA 70810
$-128
Cash flow
-2.0%
Cash-on-Cash Return
5.8%
Cap rate
0.7%
Rent to Value Ratio
Active
$180,000
4
bds
|
2
ba
|
1,300
sqft
|
built
1988
6665 Calumet St, Baton Rouge, LA 70805
$92
Cash flow
2.7%
Cash-on-Cash Return
6.9%
Cap rate
0.8%
Rent to Value Ratio
Active
$320,000
4
bds
|
3
ba
|
2,710
sqft
|
built
2003
3316 Grassy Lake Dr, Baton Rouge, LA 70816
$32
Cash flow
0.5%
Cash-on-Cash Return
6.4%
Cap rate
0.8%
Rent to Value Ratio
Active
$525,000
4
bds
|
4
ba
|
3,793
sqft
|
built
1984
366 Shady Lake Pkwy, Baton Rouge, LA 70810
$-286
Cash flow
-2.8%
Cash-on-Cash Return
5.6%
Cap rate
0.7%
Rent to Value Ratio
Active
$749,000
4
bds
|
3
ba
|
2,965
sqft
|
built
2012
11548 The Gardens Dr, Baton Rouge, LA 70810
$-252
Cash flow
-1.8%
Cash-on-Cash Return
5.9%
Cap rate
0.7%
Rent to Value Ratio
Active
$410,000
4
bds
|
3
ba
|
2,251
sqft
|
built
2018
529 Flycatcher Dr, Baton Rouge, LA 70810
$-179
Cash flow
-2.3%
Cash-on-Cash Return
5.8%
Cap rate
0.7%
Rent to Value Ratio
Active
$125,000
3
bds
|
1
ba
|
1,232
sqft
|
built
1964
2908 Adams Ave, Baton Rouge, LA 70802
$104
Cash flow
4.3%
Cash-on-Cash Return
7.3%
Cap rate
0.9%
Rent to Value Ratio

Active
$134,500
2
bds
|
3
ba
|
1,116
sqft
|
built
1983
4398 Stumberg Ln, Baton Rouge, LA 70816
$47
Cash flow
1.8%
Cash-on-Cash Return
6.7%
Cap rate
1.0%
Rent to Value Ratio
Active
$315,000
3
bds
|
2
ba
|
2,060
sqft
|
built
1969
9010 Gail Dr, Baton Rouge, LA 70809
$75
Cash flow
1.2%
Cash-on-Cash Return
6.6%
Cap rate
0.8%
Rent to Value Ratio
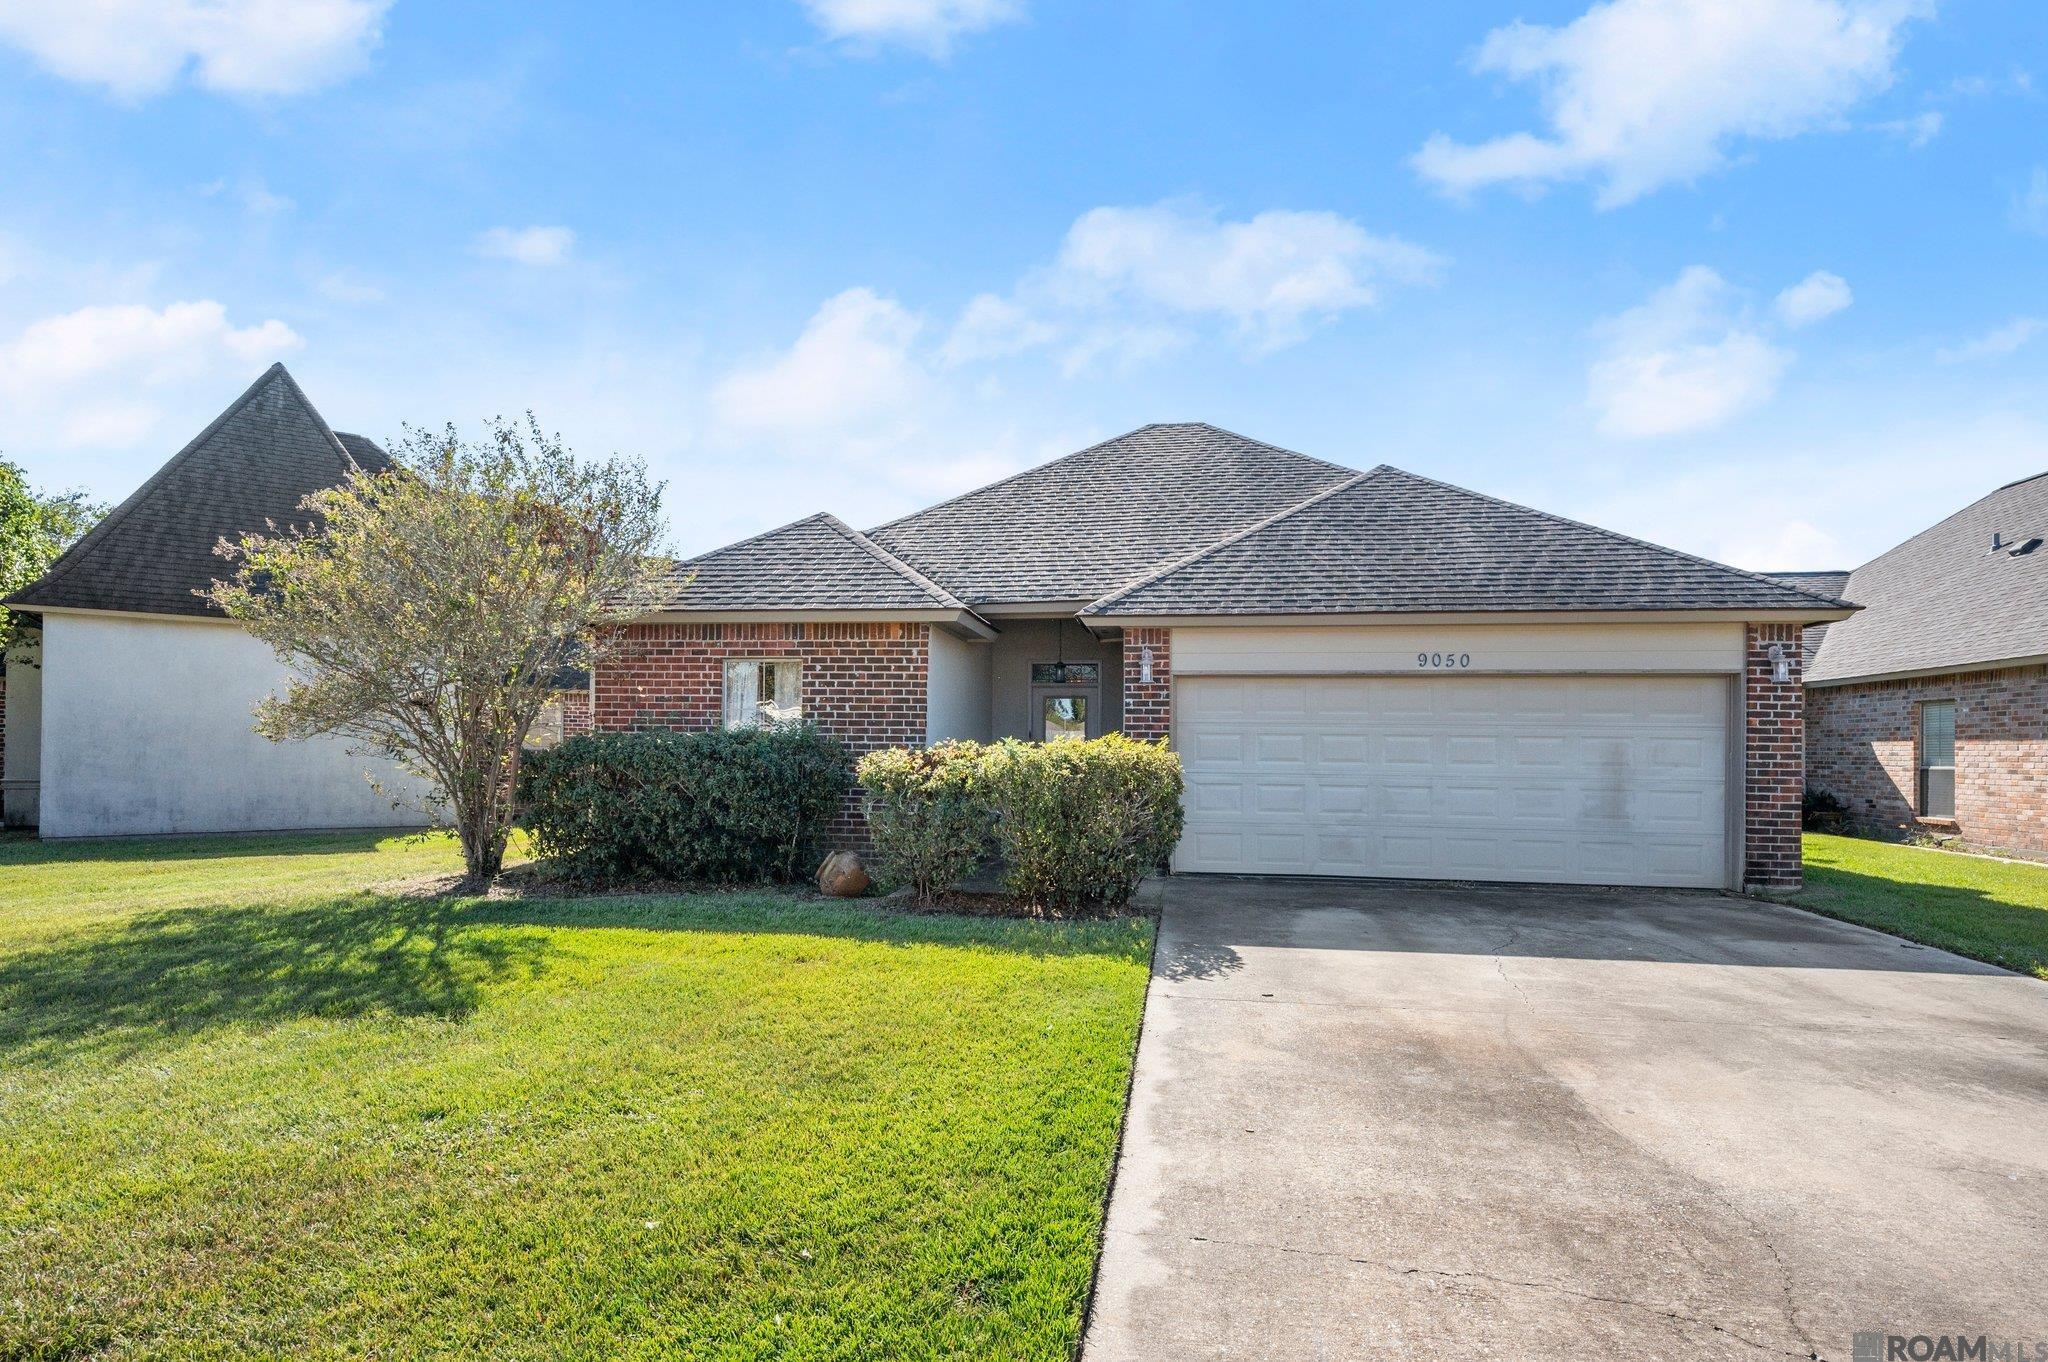
Active
$243,900
3
bds
|
2
ba
|
1,553
sqft
|
built
2005
9050 Eastbank Ave, Baton Rouge, LA 70810
$61
Cash flow
1.3%
Cash-on-Cash Return
6.6%
Cap rate
0.8%
Rent to Value Ratio
Active
$389,000
3
bds
|
2
ba
|
2,075
sqft
|
built
1998
753 Wordsworth Dr, Baton Rouge, LA 70810
$-329
Cash flow
-4.4%
Cash-on-Cash Return
5.3%
Cap rate
0.6%
Rent to Value Ratio

Active
$255,000
4
bds
|
3
ba
|
2,433
sqft
|
built
1998
866 S Burgess Dr, Baton Rouge, LA 70815
$183
Cash flow
3.7%
Cash-on-Cash Return
7.1%
Cap rate
0.9%
Rent to Value Ratio
Active
$228,500
3
bds
|
2
ba
|
1,251
sqft
|
built
1965
8278 Argosy Ct, Baton Rouge, LA 70809
$45
Cash flow
1.0%
Cash-on-Cash Return
6.5%
Cap rate
0.8%
Rent to Value Ratio
Active
$289,000
3
bds
|
2
ba
|
1,449
sqft
|
built
1935
426 Evergreen Dr, Baton Rouge, LA 70806
$-133
Cash flow
-2.4%
Cash-on-Cash Return
5.7%
Cap rate
0.7%
Rent to Value Ratio

Pending
$255,000
3
bds
|
2
ba
|
1,360
sqft
|
built
1963
501 Wylie Dr, Baton Rouge, LA 70808
$-162
Cash flow
-3.3%
Cash-on-Cash Return
5.5%
Cap rate
0.7%
Rent to Value Ratio