Baton Rouge, LA Investment Properties for Sale
Browse homes for sale and investment properties in Baton Rouge, LA. Refine your search by price, property type, or more.
Best cash flowing properties in Baton Rouge, LA

Active
$32,000
2
bds
|
1
ba
|
890
sqft
|
built
1975
4014 Dalton St, Baton Rouge, LA 70805
$828
Cash flow
30.1%
Cash-on-Cash Return
31.1%
Cap rate
3.8%
Rent to Value Ratio

Active
$35,000
2
bds
|
1
ba
|
964
sqft
|
built
1955
3969 Chippewa St, Baton Rouge, LA 70805
$828
Cash flow
27.6%
Cash-on-Cash Return
28.4%
Cap rate
3.4%
Rent to Value Ratio
997 out of 1,285 properties for sale in Baton Rouge, LA
Limited Results Shown
Create a free account, or log in to reveal all property listings and enjoy the complete experience.

Active
$675,000
4
bds
|
3
ba
|
2,906
sqft
|
built
2011
15233 Summer Park Ln, Baton Rouge, LA 70817
$-1,108
Cash flow
-8.6%
Cash-on-Cash Return
3.7%
Cap rate
0.5%
Rent to Value Ratio
Active
$579,900
6
bds
|
4
ba
|
3,645
sqft
|
built
1986
10610 Old Lodge Ct, Baton Rouge, LA 70817
$-837
Cash flow
-7.5%
Cash-on-Cash Return
3.9%
Cap rate
0.5%
Rent to Value Ratio
Active
$315,000
4
bds
|
2
ba
|
1,700
sqft
|
built
2022
4615 Grenache Dr, Baton Rouge, LA 70817
$190
Cash flow
3.1%
Cash-on-Cash Return
6.4%
Cap rate
0.8%
Rent to Value Ratio
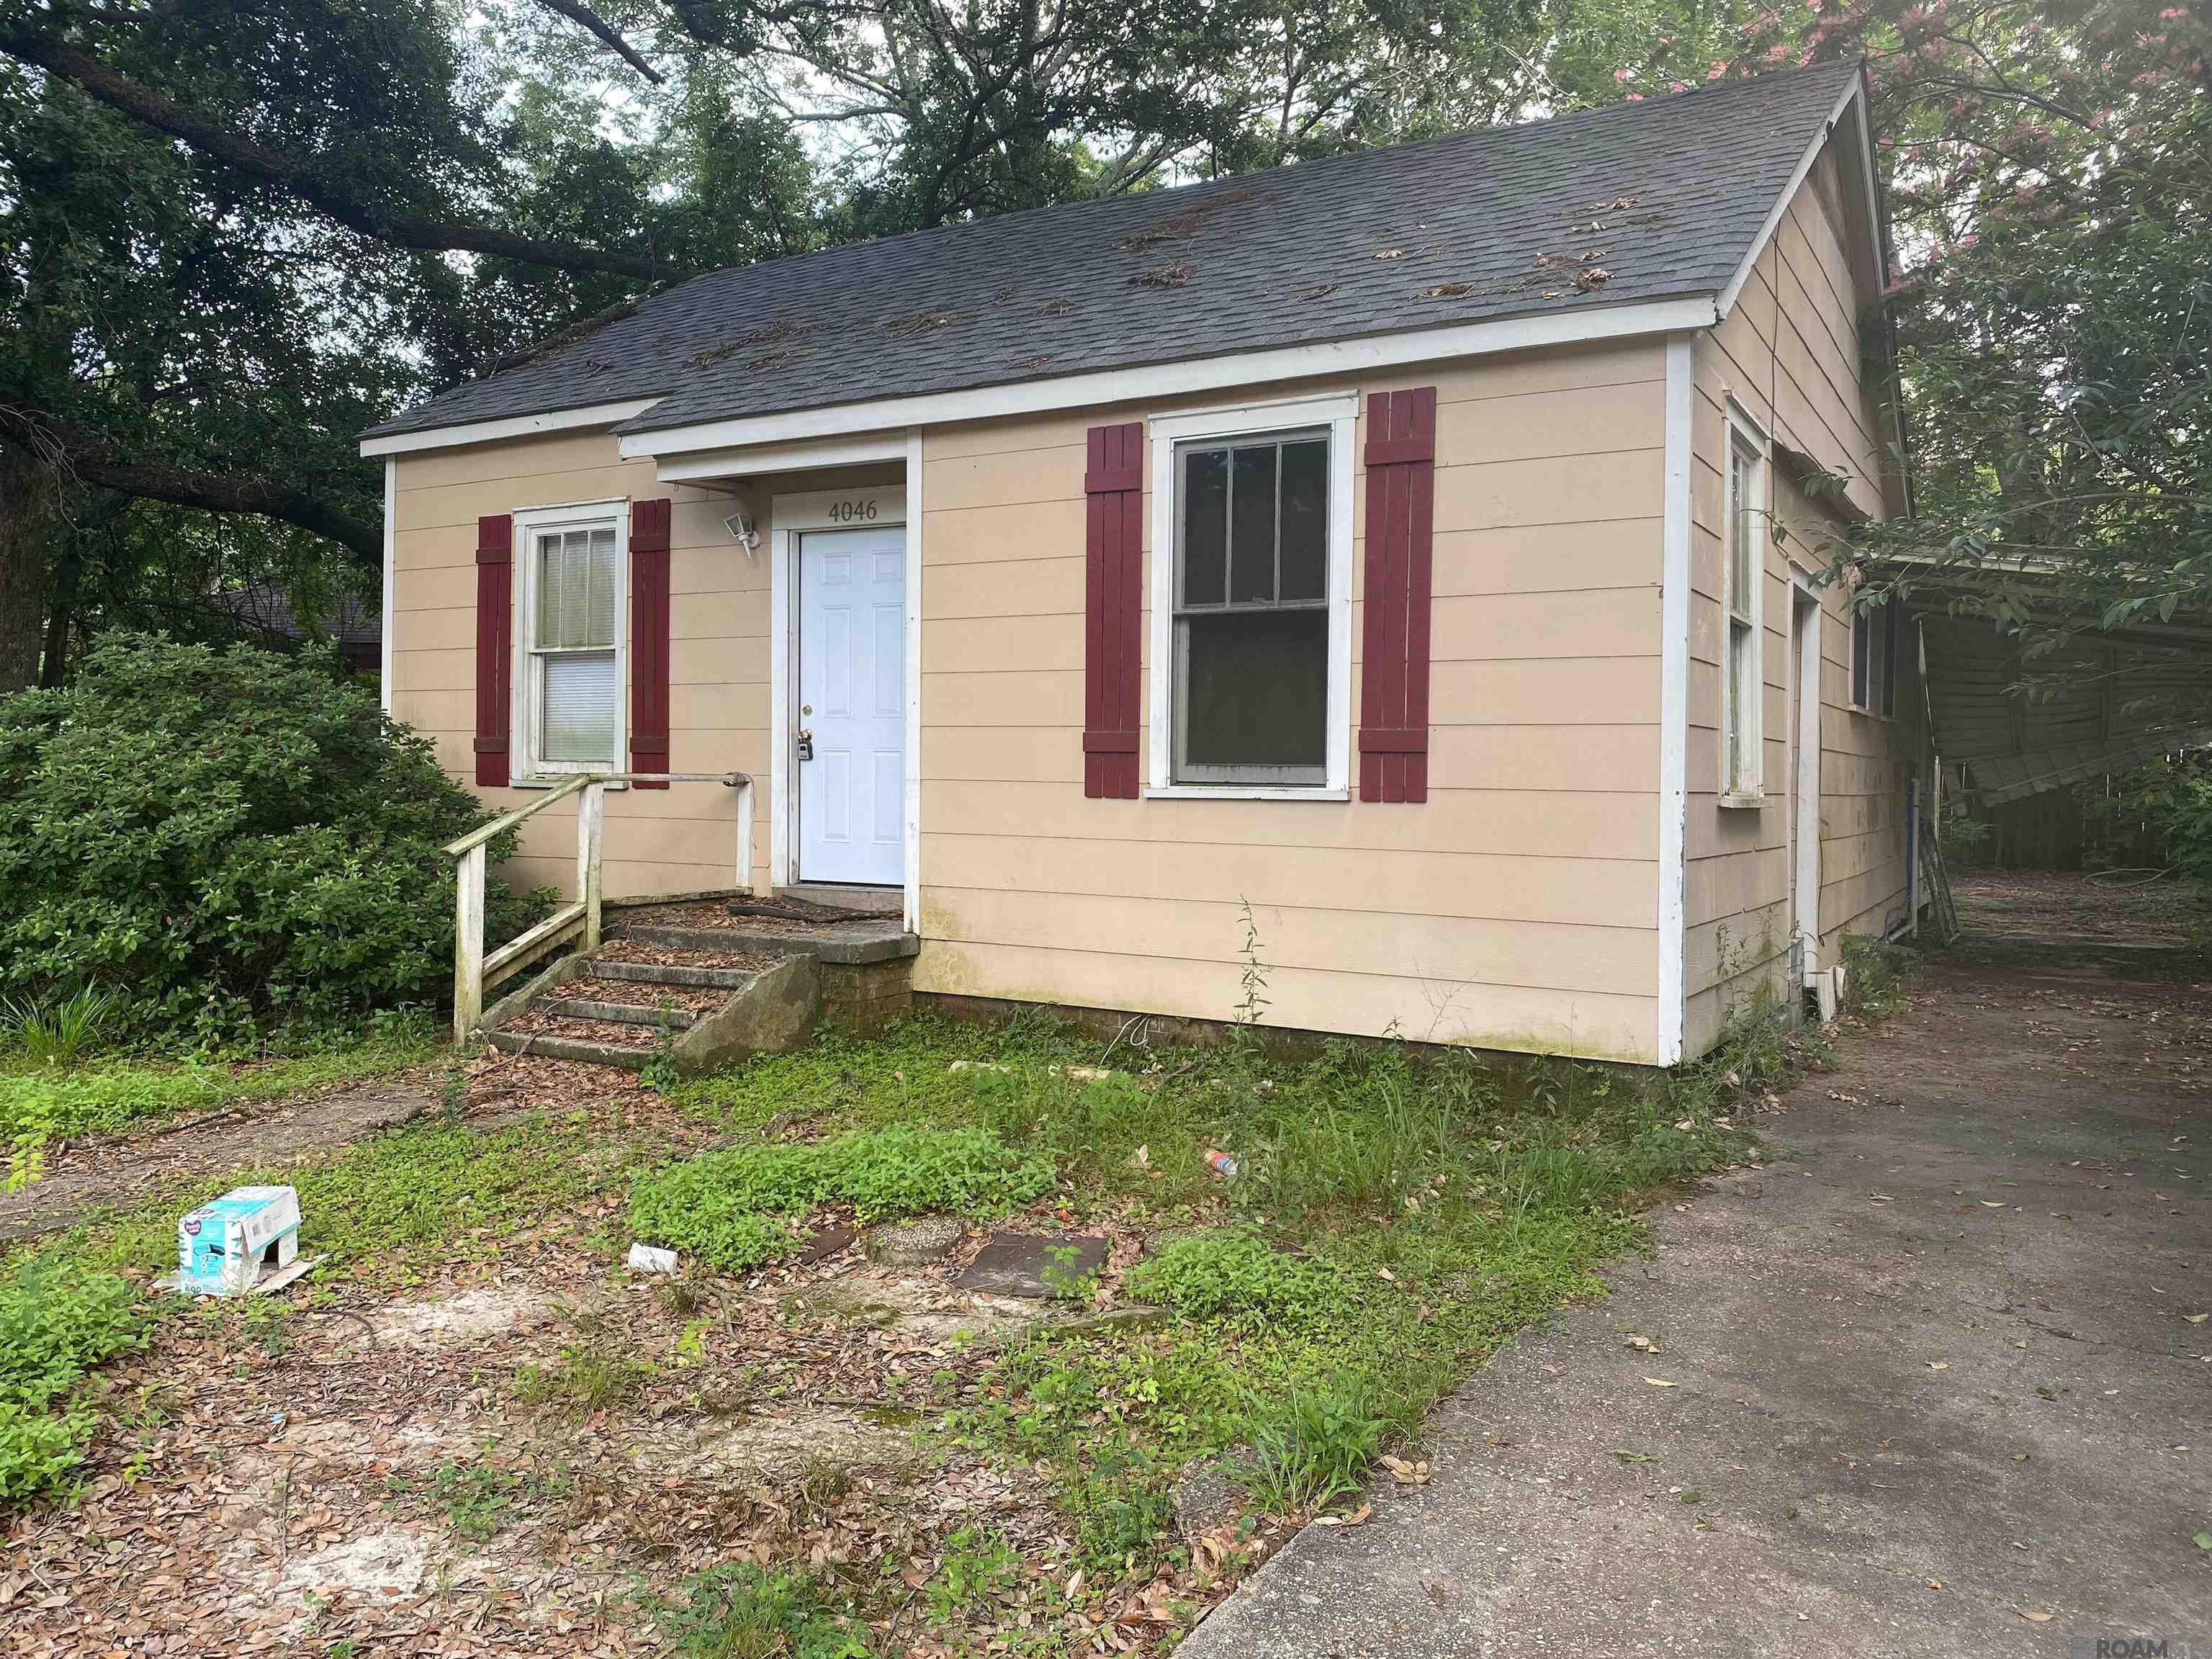
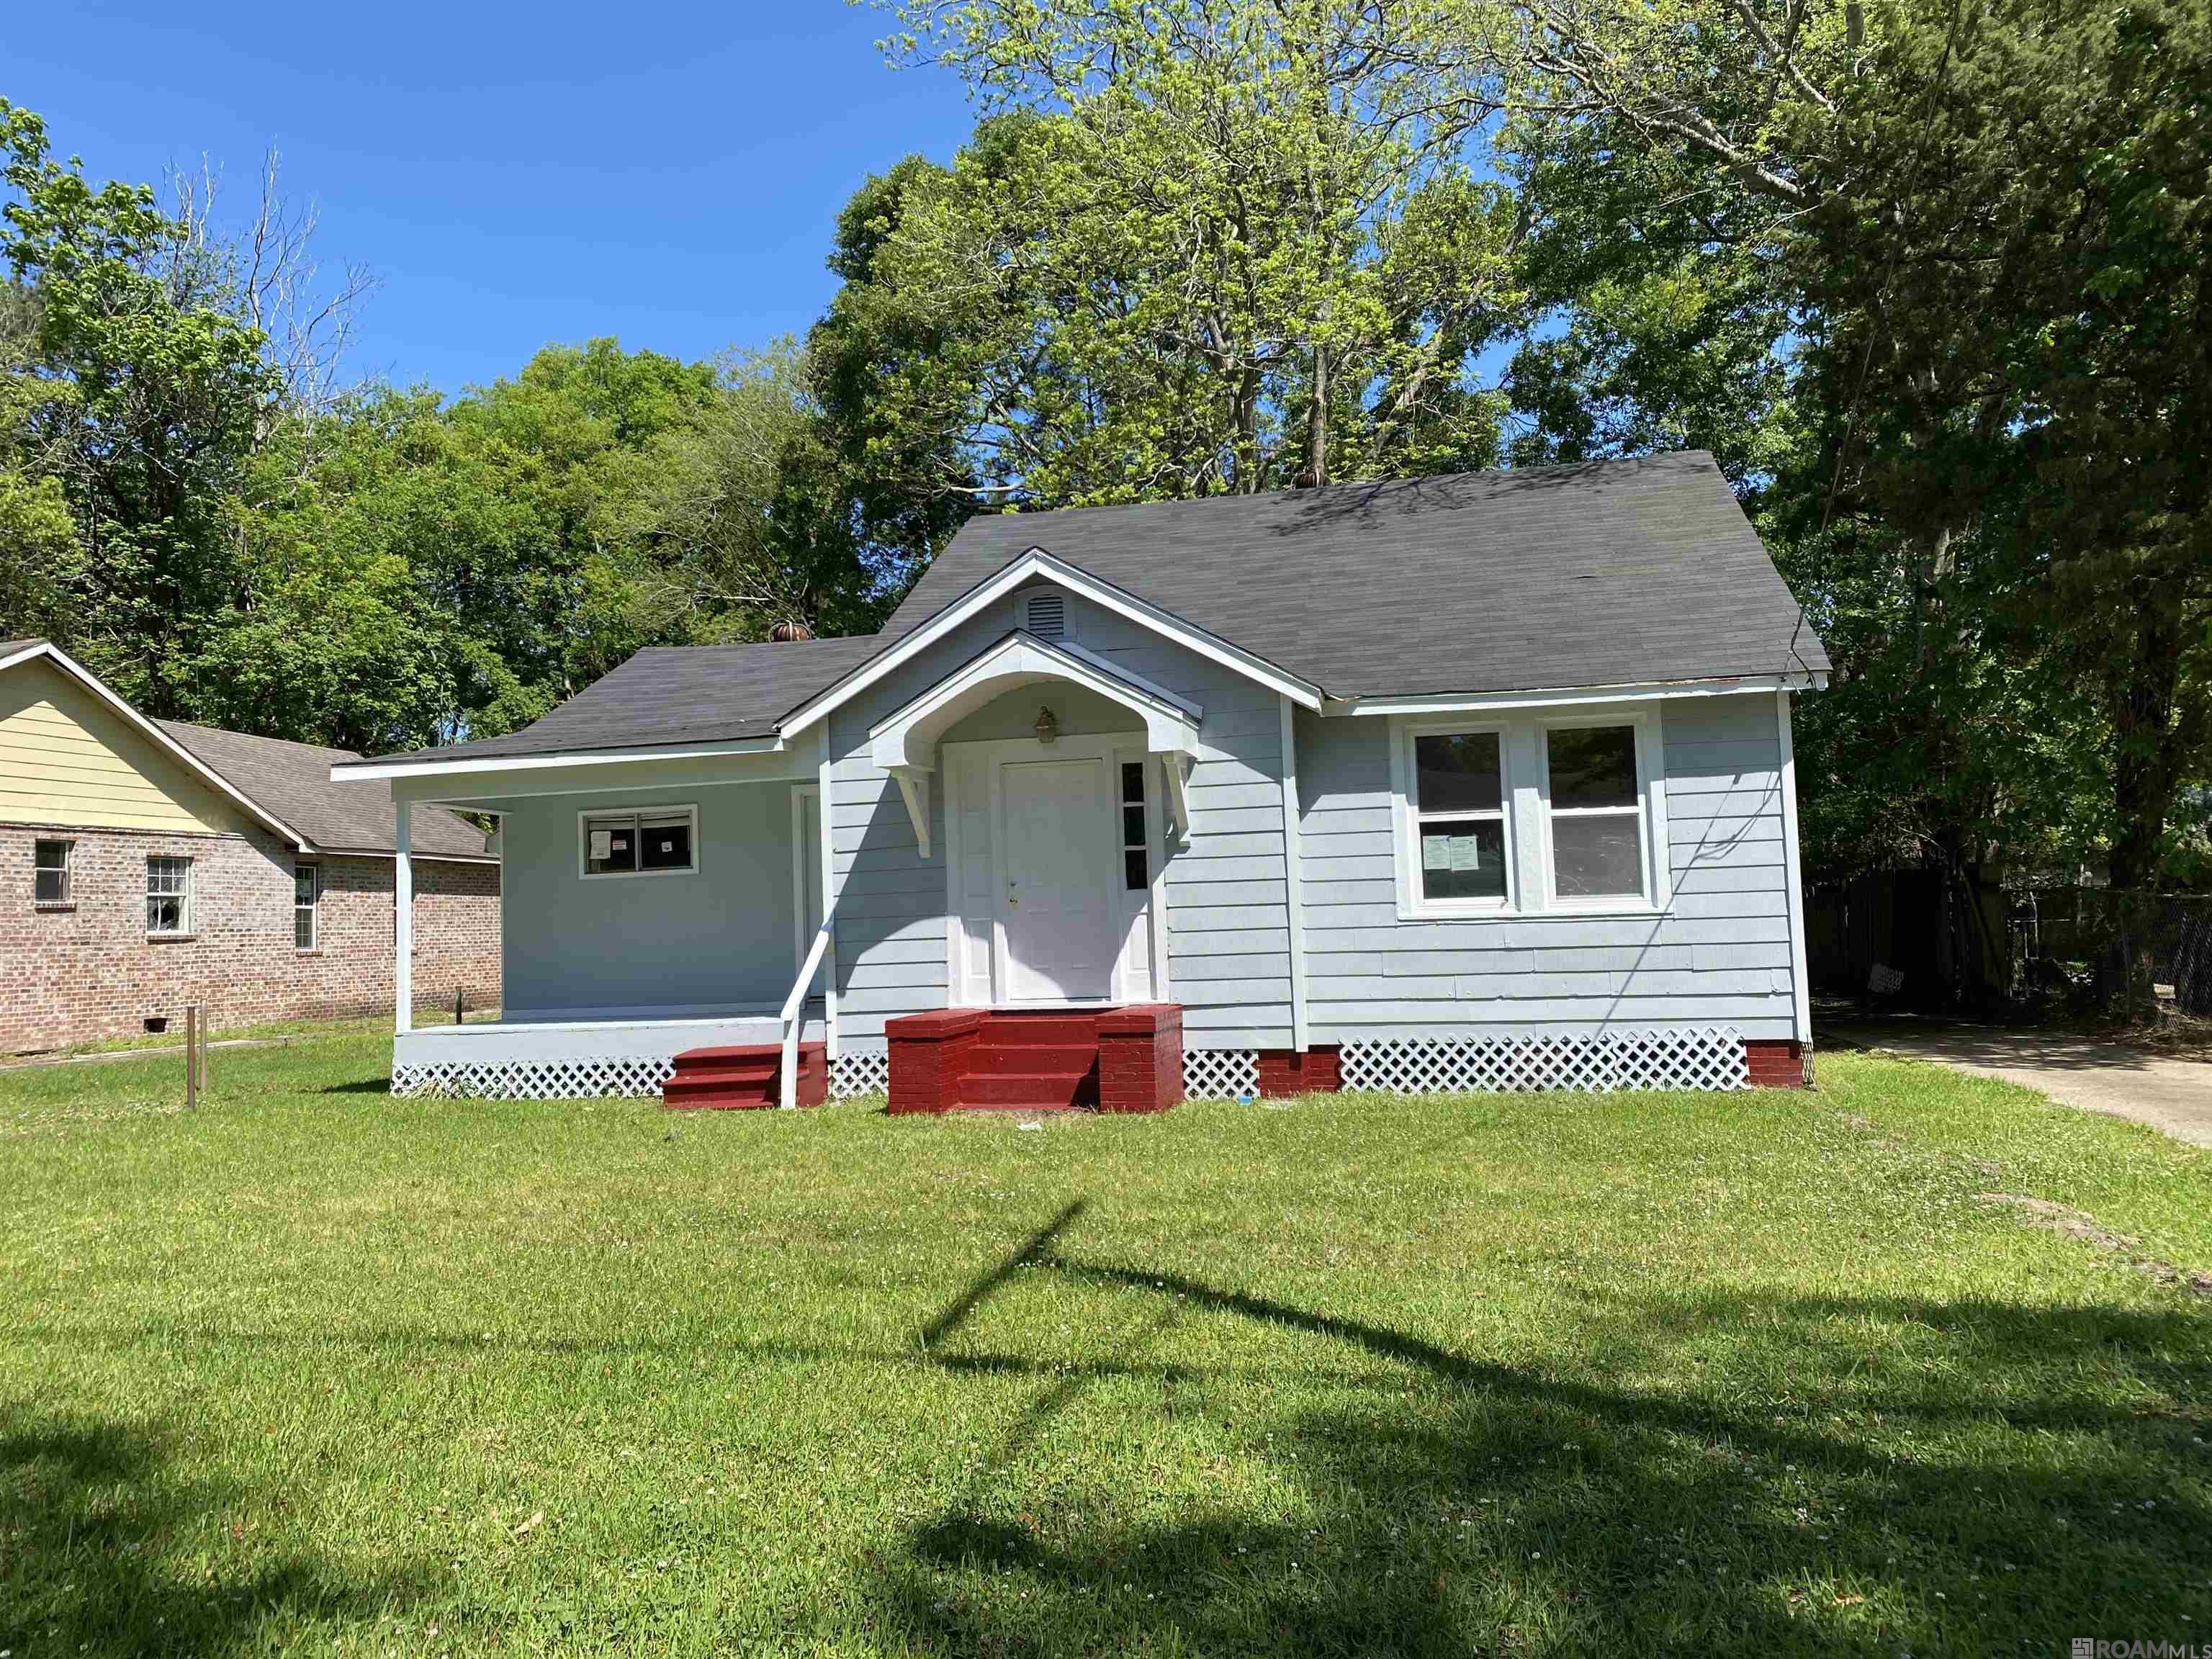
Active
$65,000
3
bds
|
1
ba
|
1,092
sqft
|
built
1975
4046 Adams Ave, Baton Rouge, LA 70802
$690
Cash flow
12.4%
Cash-on-Cash Return
12.7%
Cap rate
1.5%
Rent to Value Ratio
Active
$105,000
5
bds
|
2
ba
|
1,615
sqft
|
built
1949
3835 Sherwood St, Baton Rouge, LA 70805
$607
Cash flow
30.2%
Cash-on-Cash Return
12.6%
Cap rate
1.5%
Rent to Value Ratio
Active
$349,900
3
bds
|
2
ba
|
1,812
sqft
|
built
2020
9016 Stonecroft Ave, Baton Rouge, LA 70810
$21
Cash flow
0.3%
Cash-on-Cash Return
5.8%
Cap rate
0.7%
Rent to Value Ratio
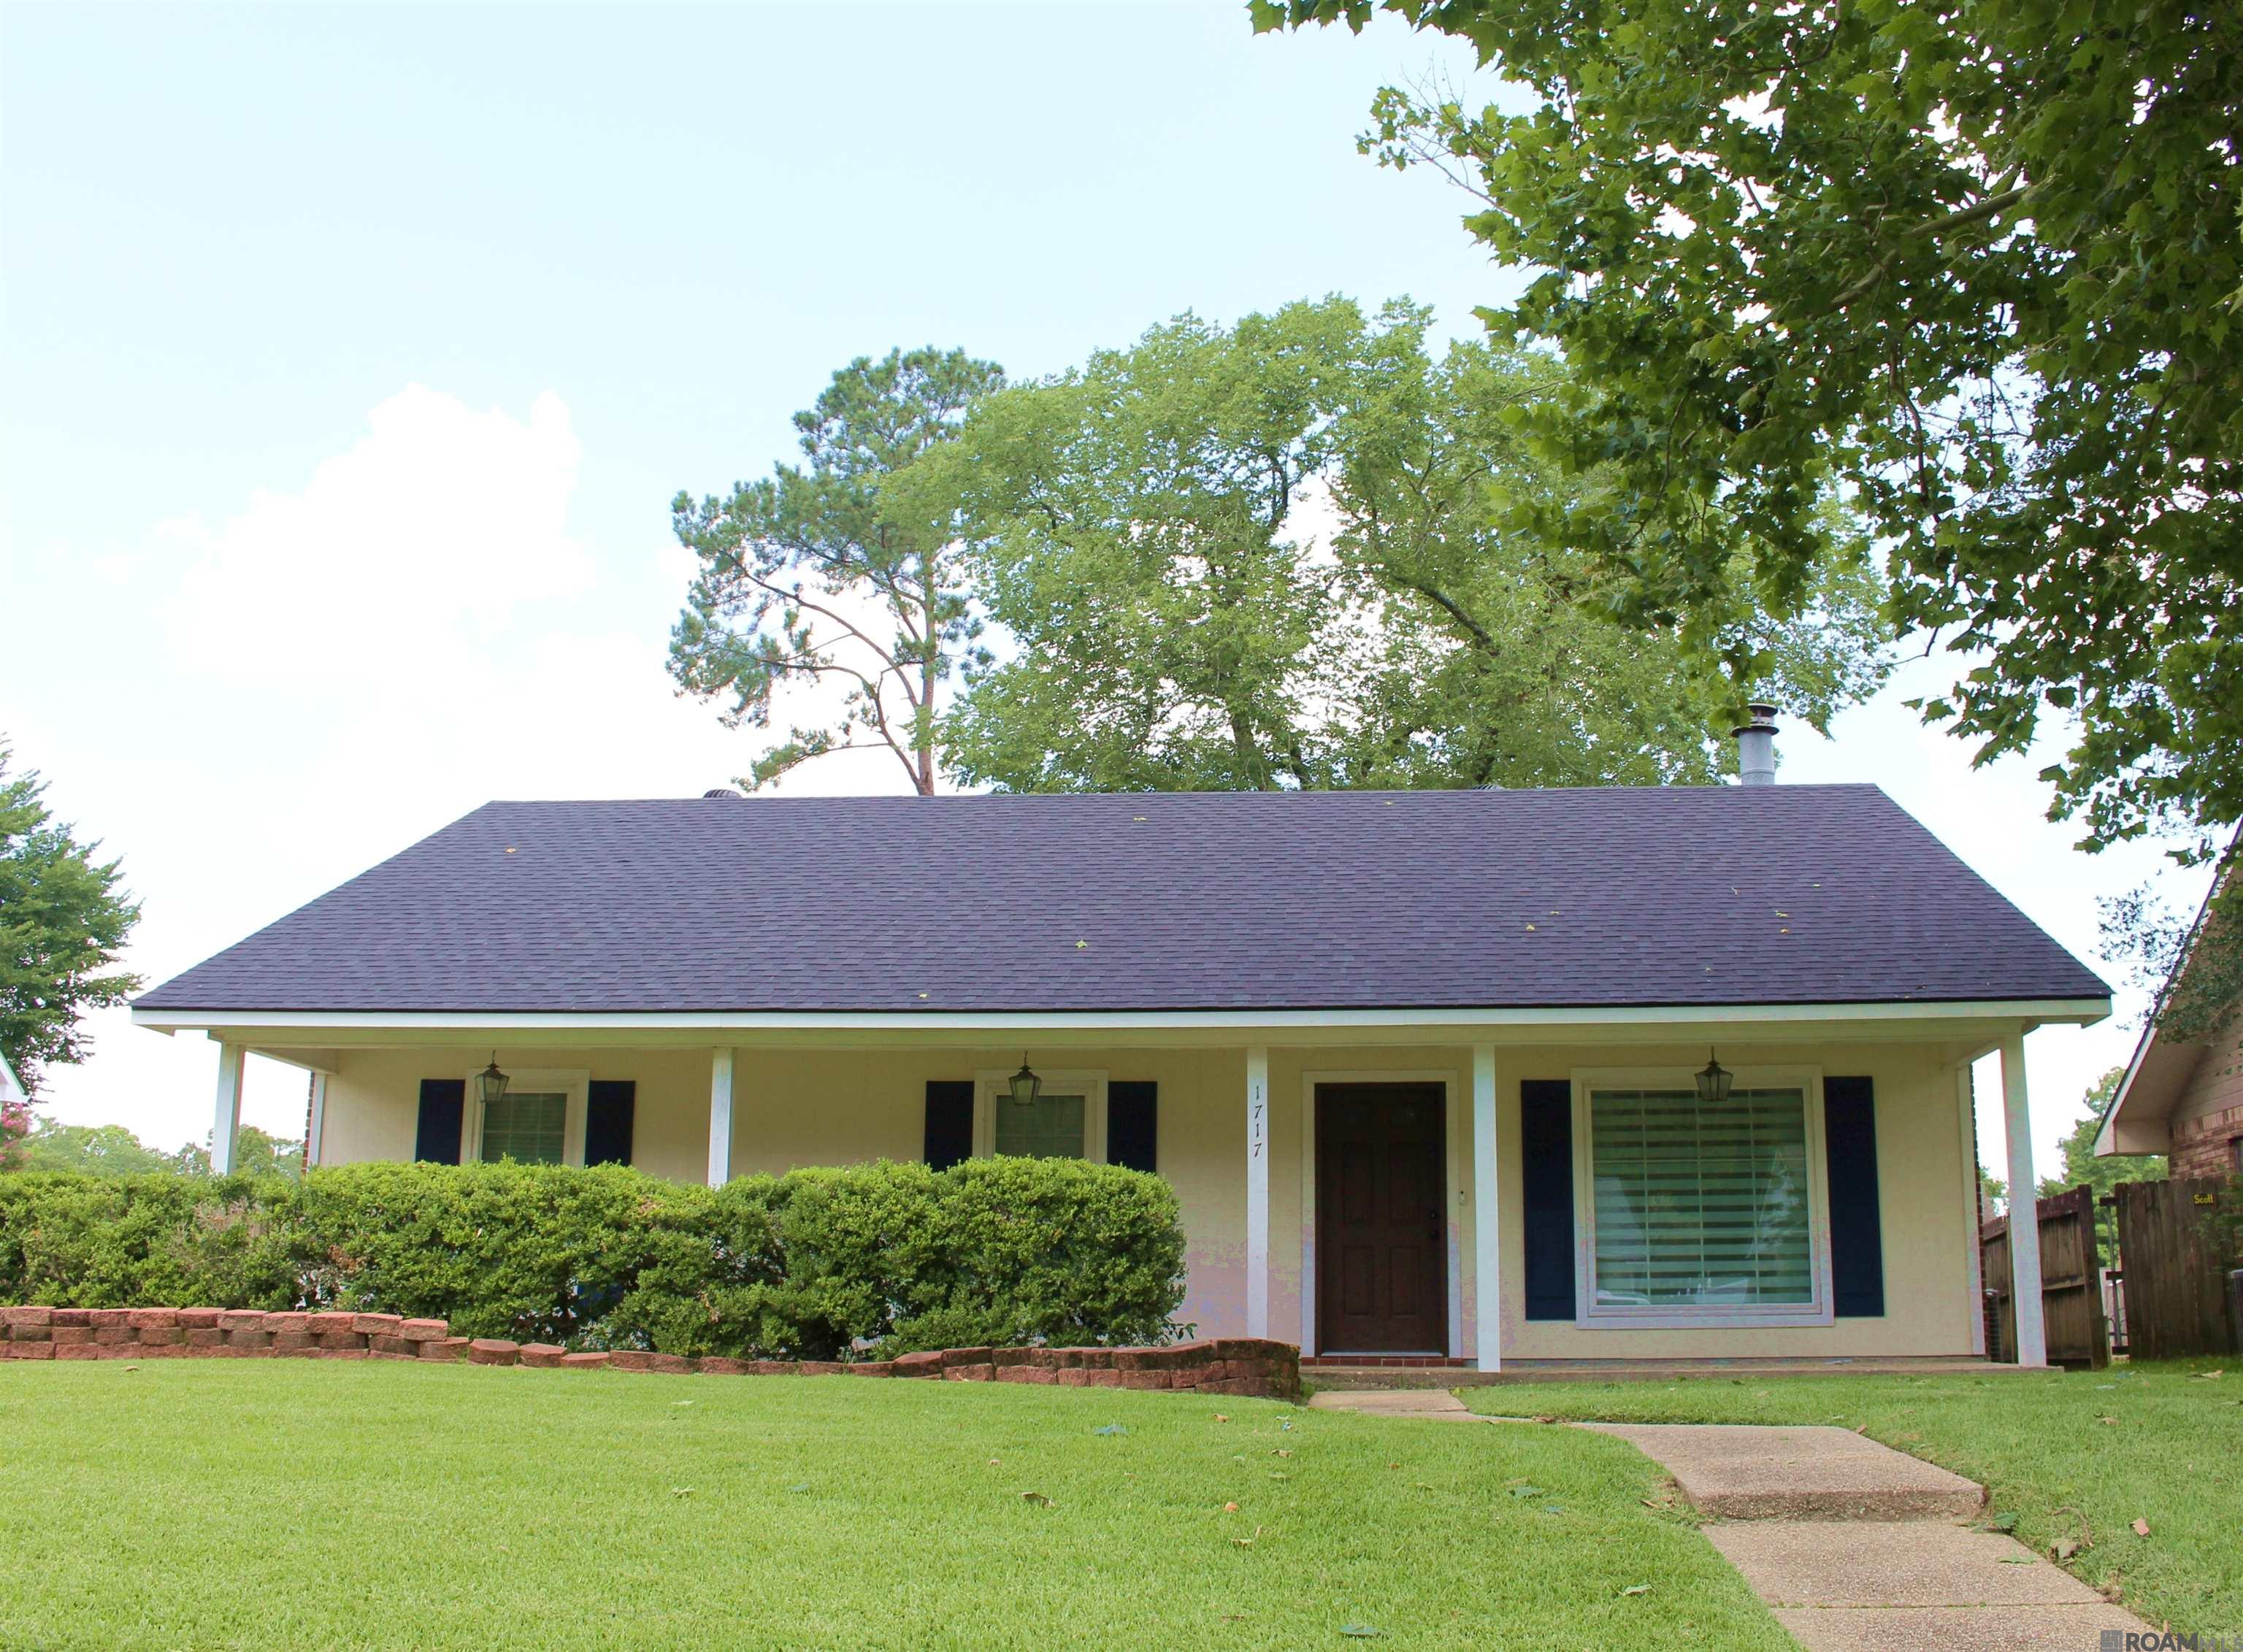
Active
$260,000
3
bds
|
2
ba
|
1,551
sqft
|
built
1984
1717 Hobbiton Rd, Baton Rouge, LA 70810
$10
Cash flow
0.2%
Cash-on-Cash Return
5.7%
Cap rate
0.7%
Rent to Value Ratio
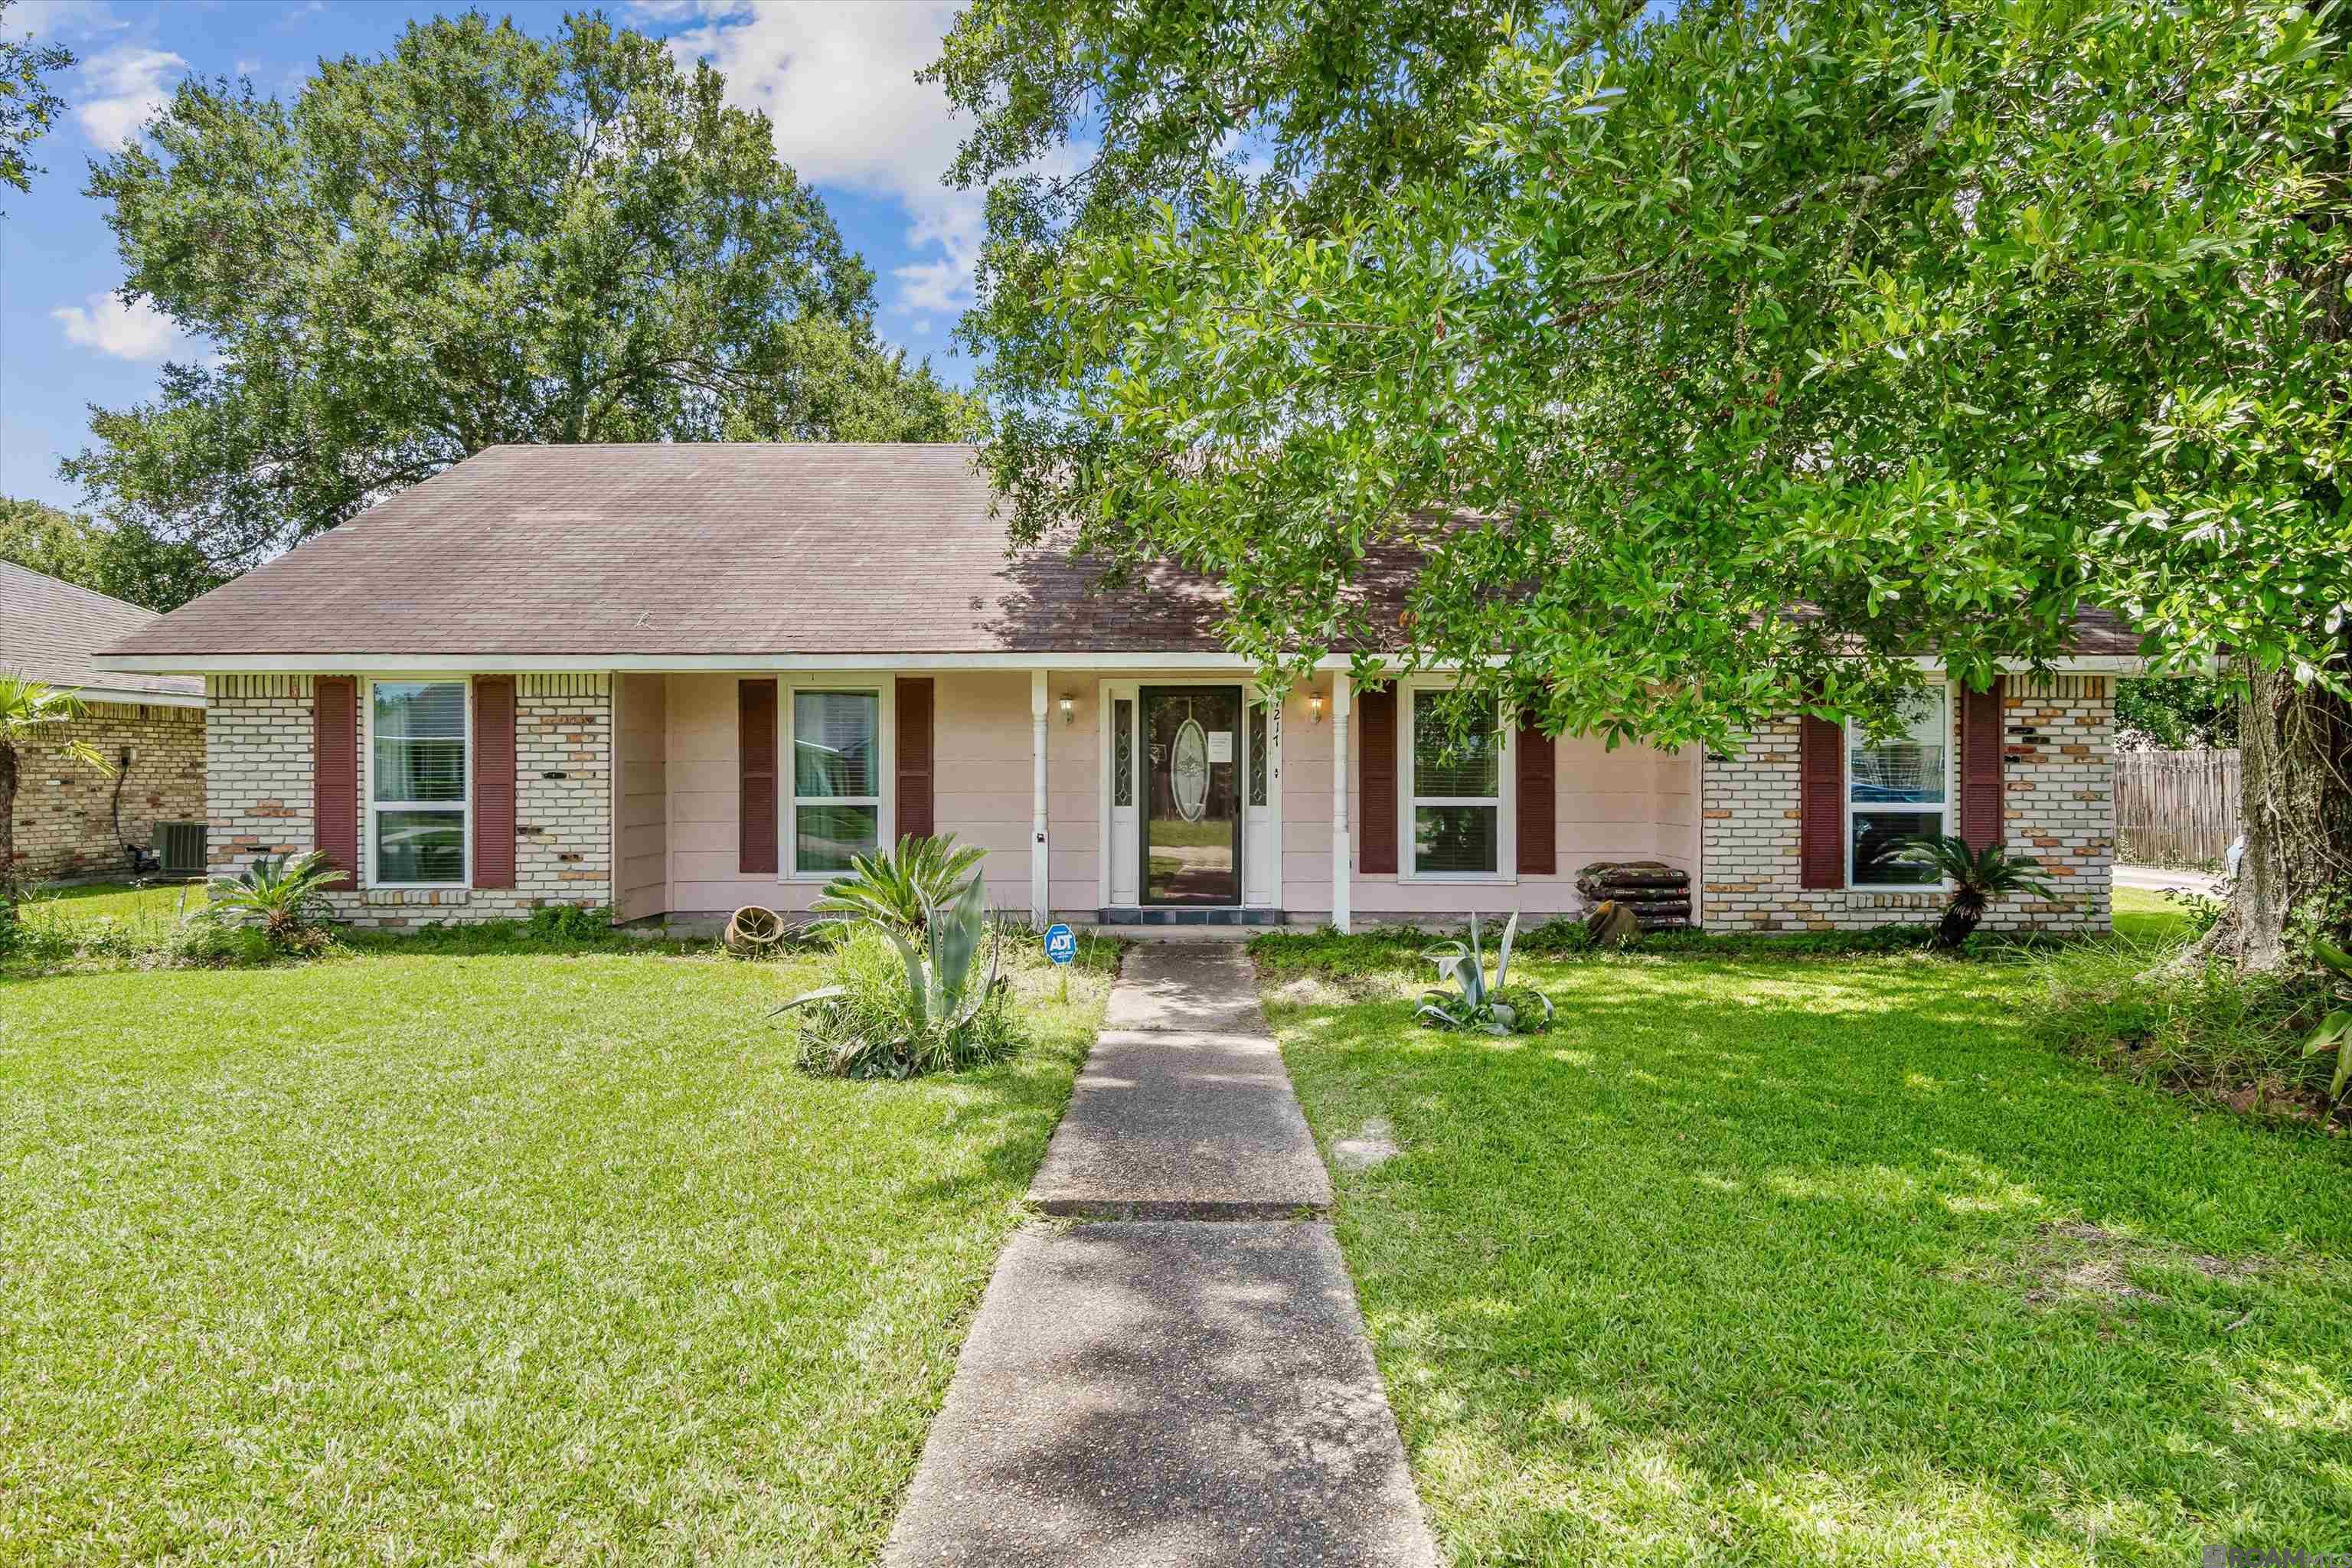
Pending
$200,000
3
bds
|
2
ba
|
1,470
sqft
|
built
1980
4217 Norwich Dr, Baton Rouge, LA 70814
$296
Cash flow
7.7%
Cash-on-Cash Return
7.5%
Cap rate
0.9%
Rent to Value Ratio
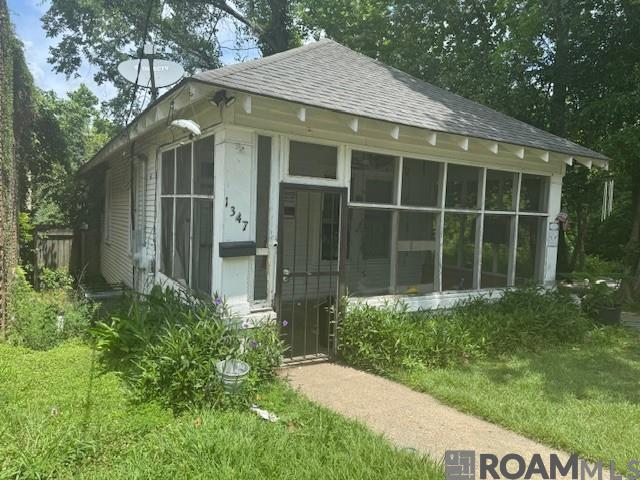
Active
$49,900
2
bds
|
1
ba
|
1,041
sqft
|
built
1970
1347 North St, Baton Rouge, LA 70802
$759
Cash flow
17.7%
Cash-on-Cash Return
18.3%
Cap rate
2.2%
Rent to Value Ratio
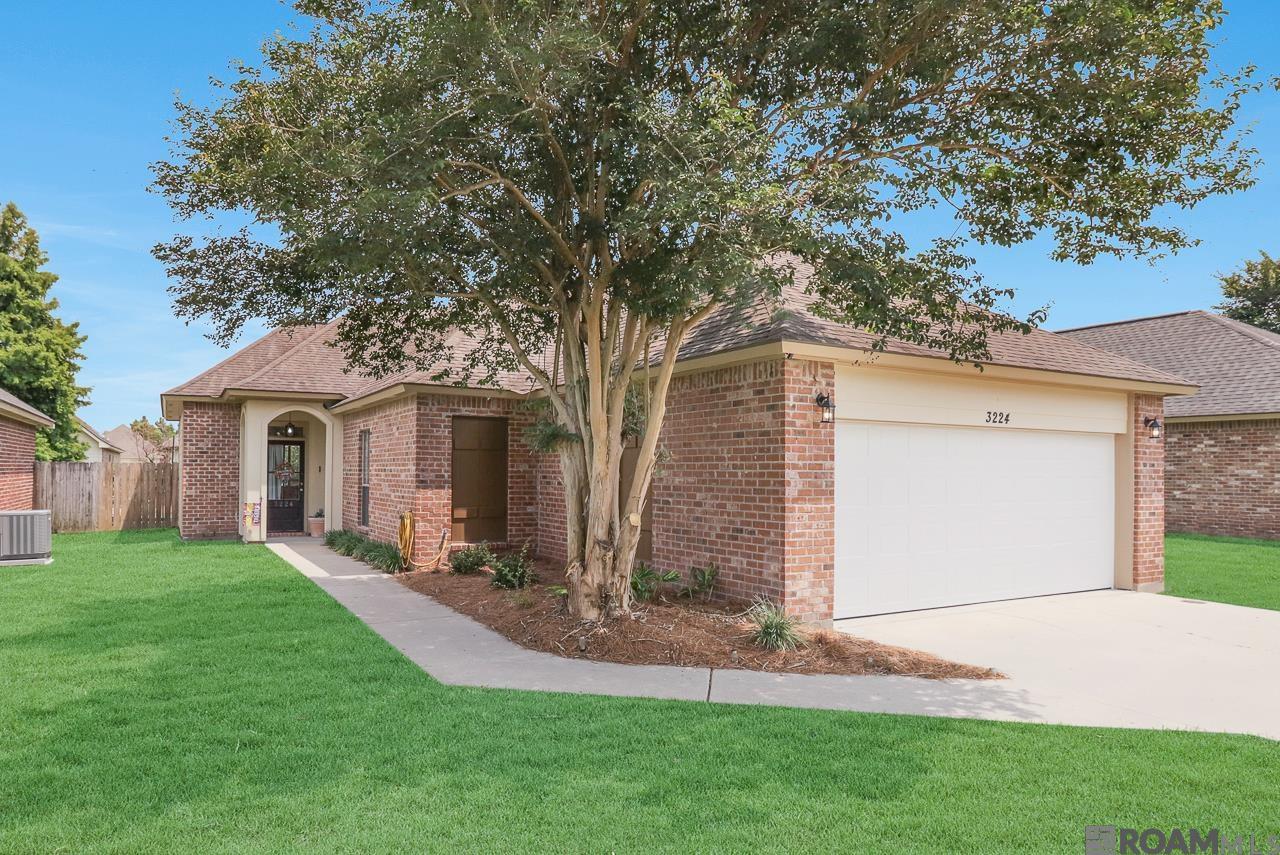
Pending
$260,000
3
bds
|
2
ba
|
1,411
sqft
|
built
2006
3224 Nicholson Lake Dr, Baton Rouge, LA 70810
$-30
Cash flow
-0.6%
Cash-on-Cash Return
5.5%
Cap rate
0.7%
Rent to Value Ratio
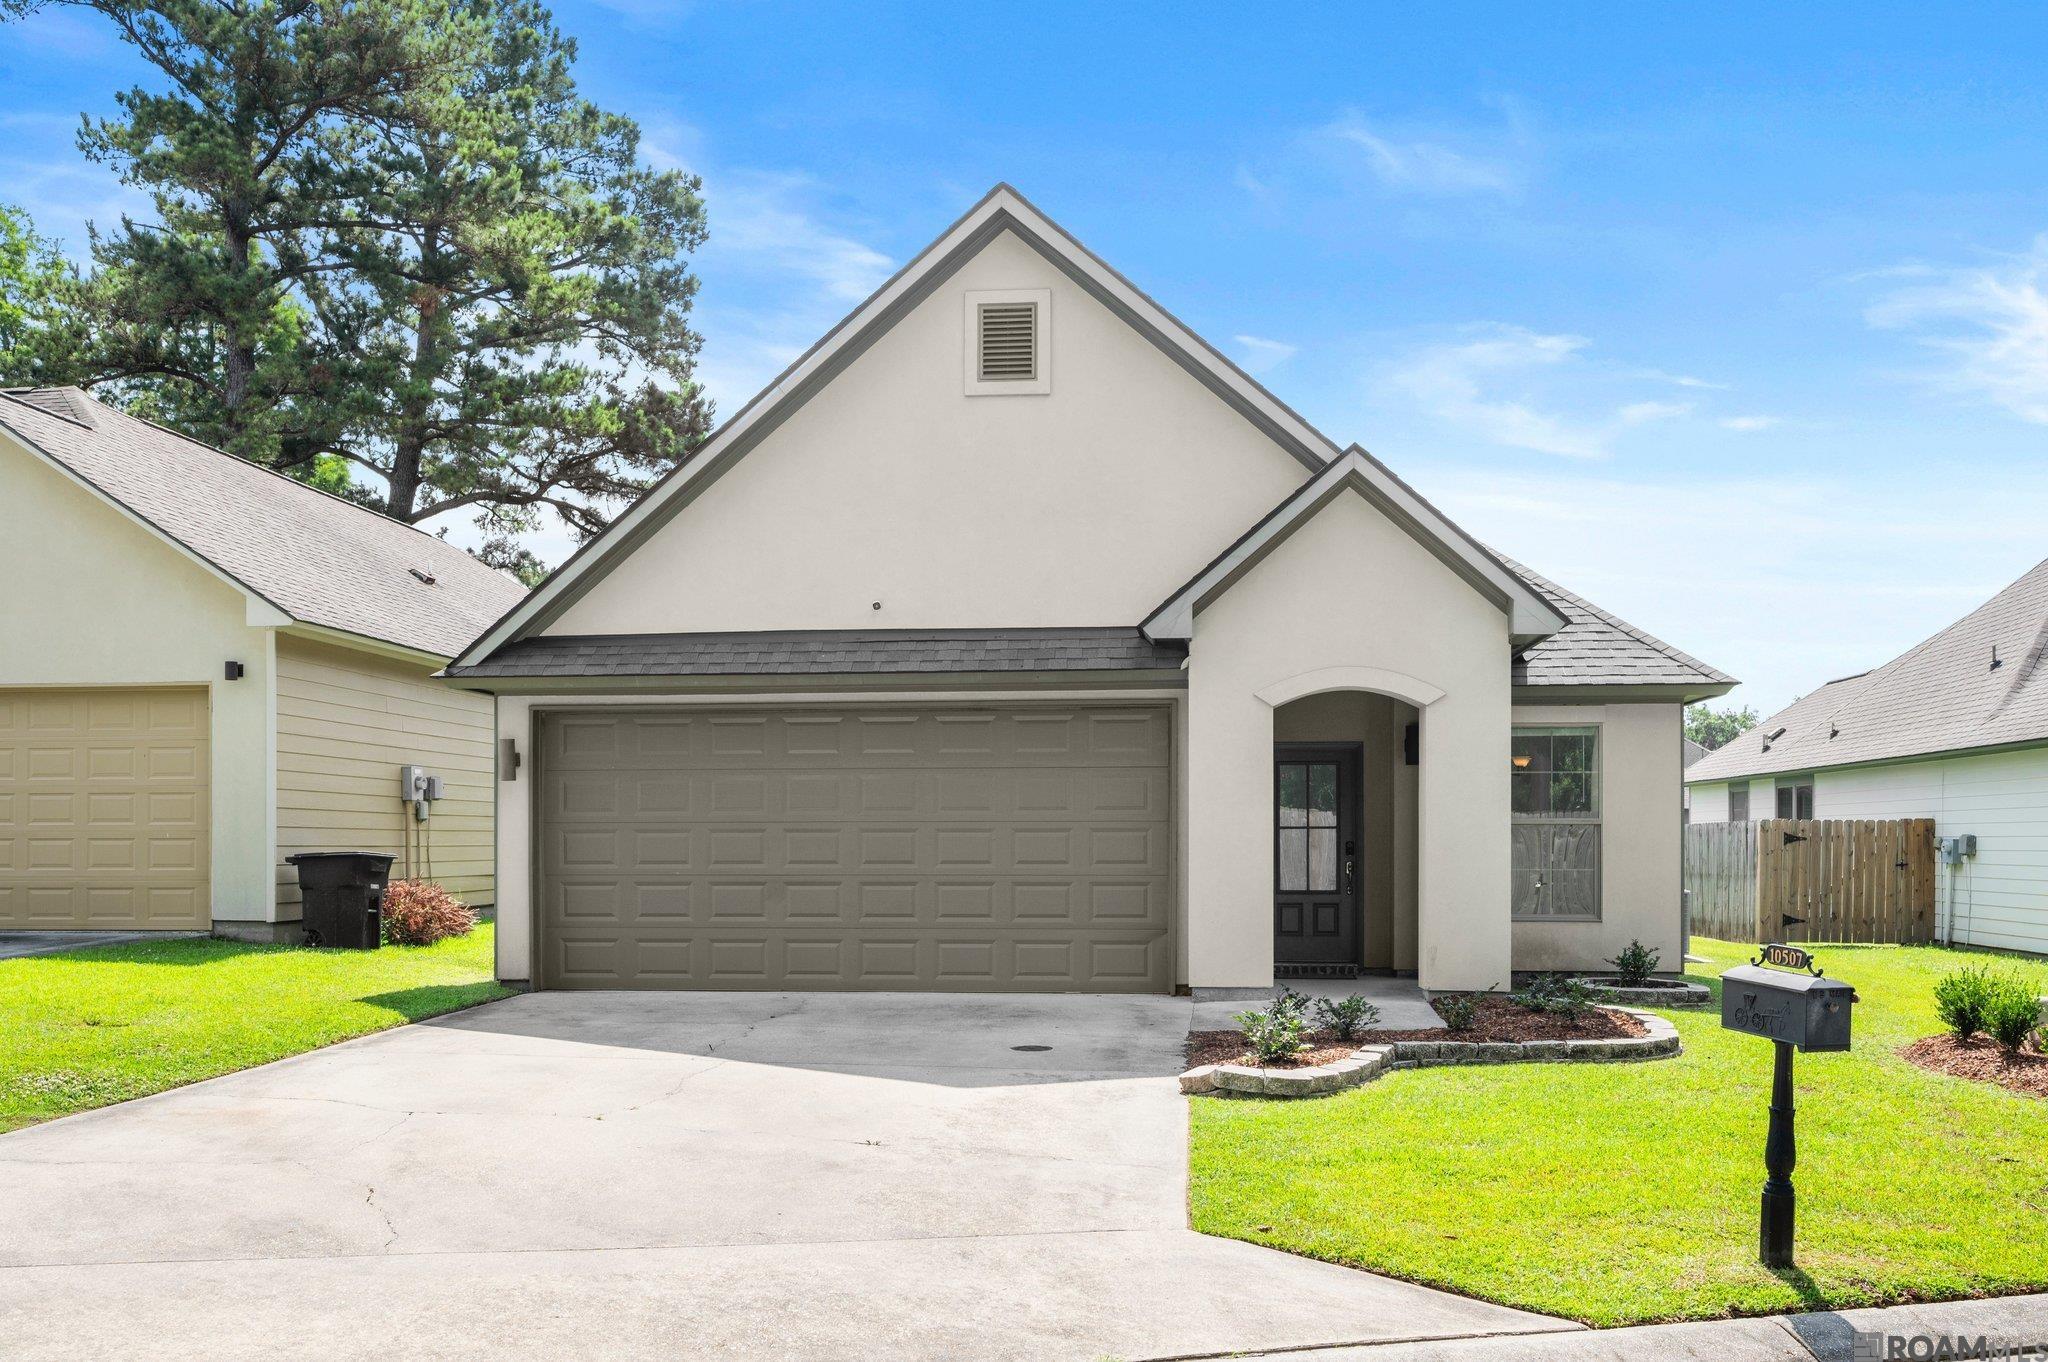
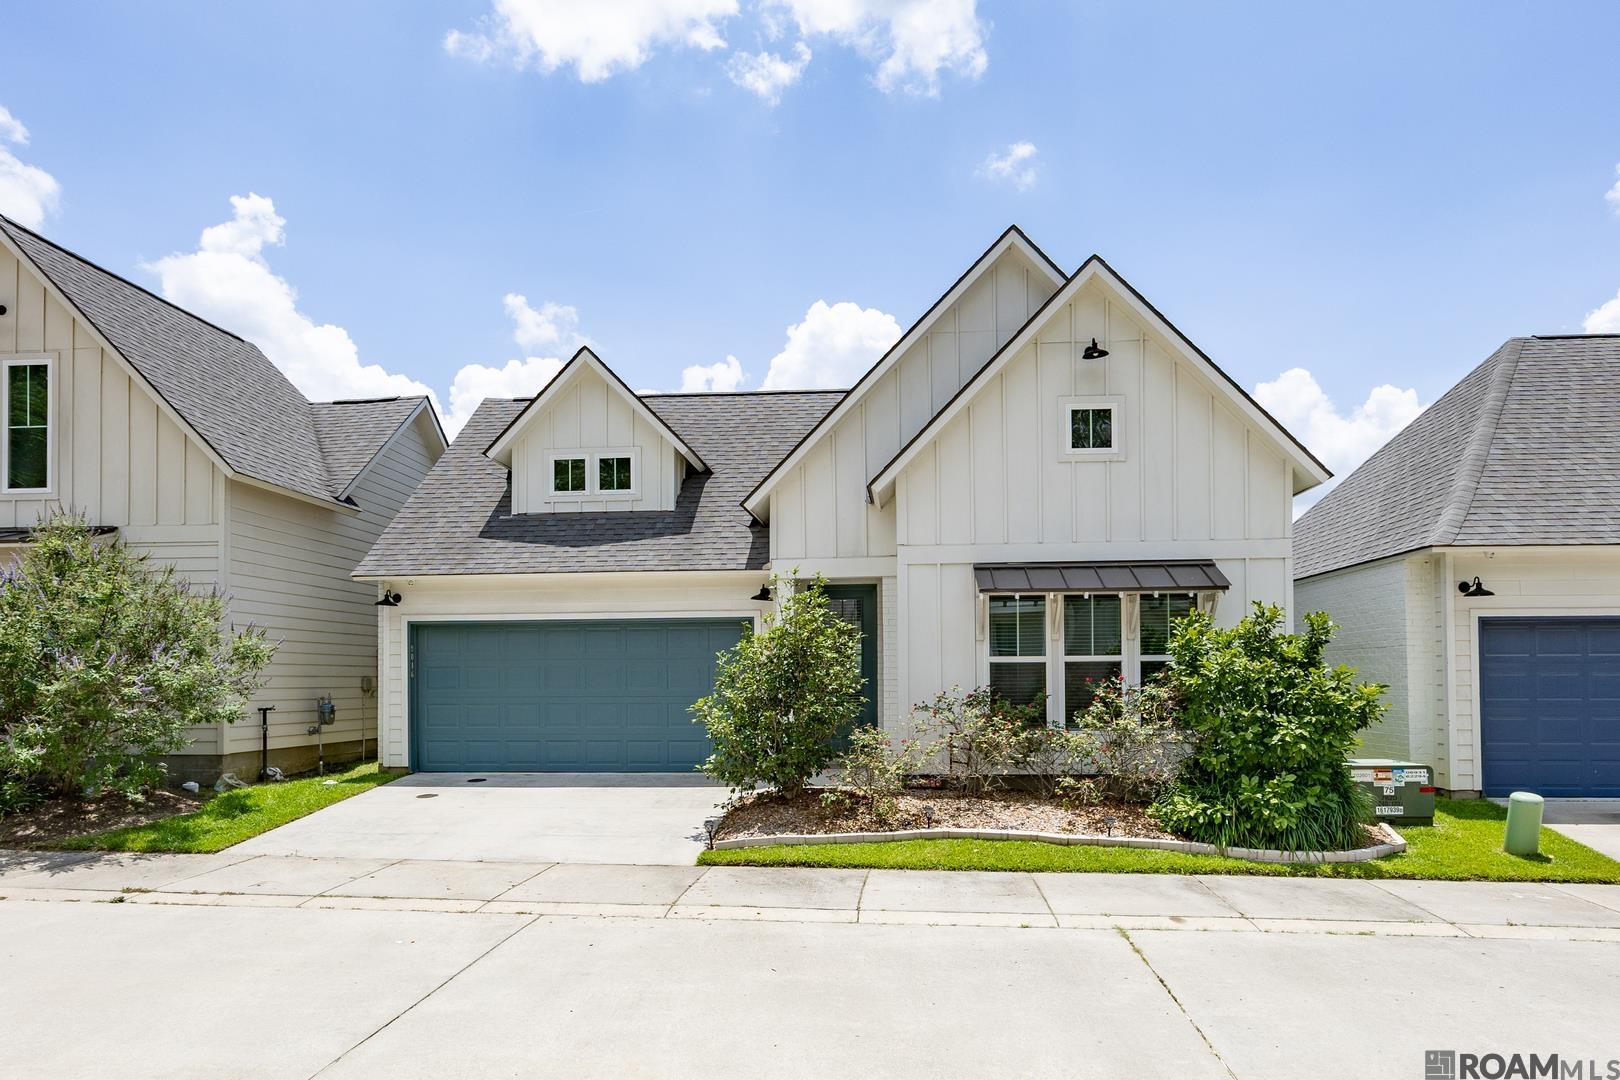
Active
$279,000
3
bds
|
2
ba
|
1,604
sqft
|
built
2012
10507 Grace Ln, Baton Rouge, LA 70817
$-20
Cash flow
-0.4%
Cash-on-Cash Return
5.6%
Cap rate
0.7%
Rent to Value Ratio
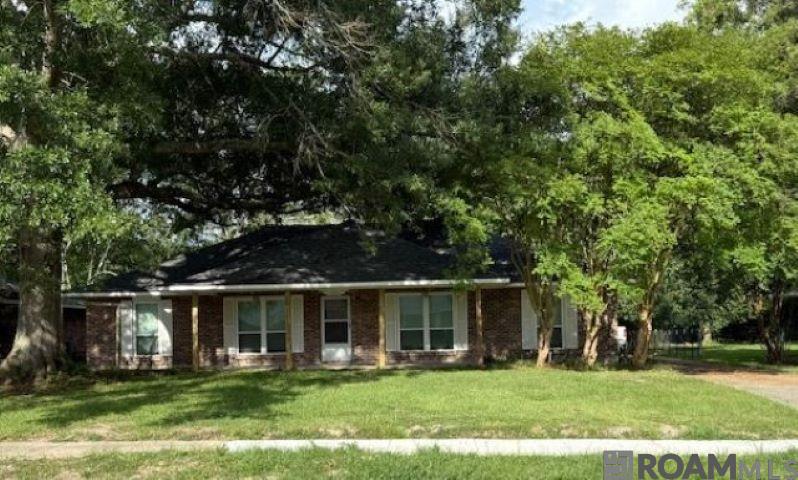
Active
$259,900
3
bds
|
2
ba
|
1,728
sqft
|
built
1971
12064 Post Dr, Baton Rouge, LA 70818
$-57
Cash flow
-1.1%
Cash-on-Cash Return
5.4%
Cap rate
0.7%
Rent to Value Ratio

Active
$170,000
3
bds
|
2
ba
|
1,515
sqft
|
built
1950
1828 Gracie St, Baton Rouge, LA 70802
$-45
Cash flow
-1.4%
Cash-on-Cash Return
5.4%
Cap rate
0.6%
Rent to Value Ratio
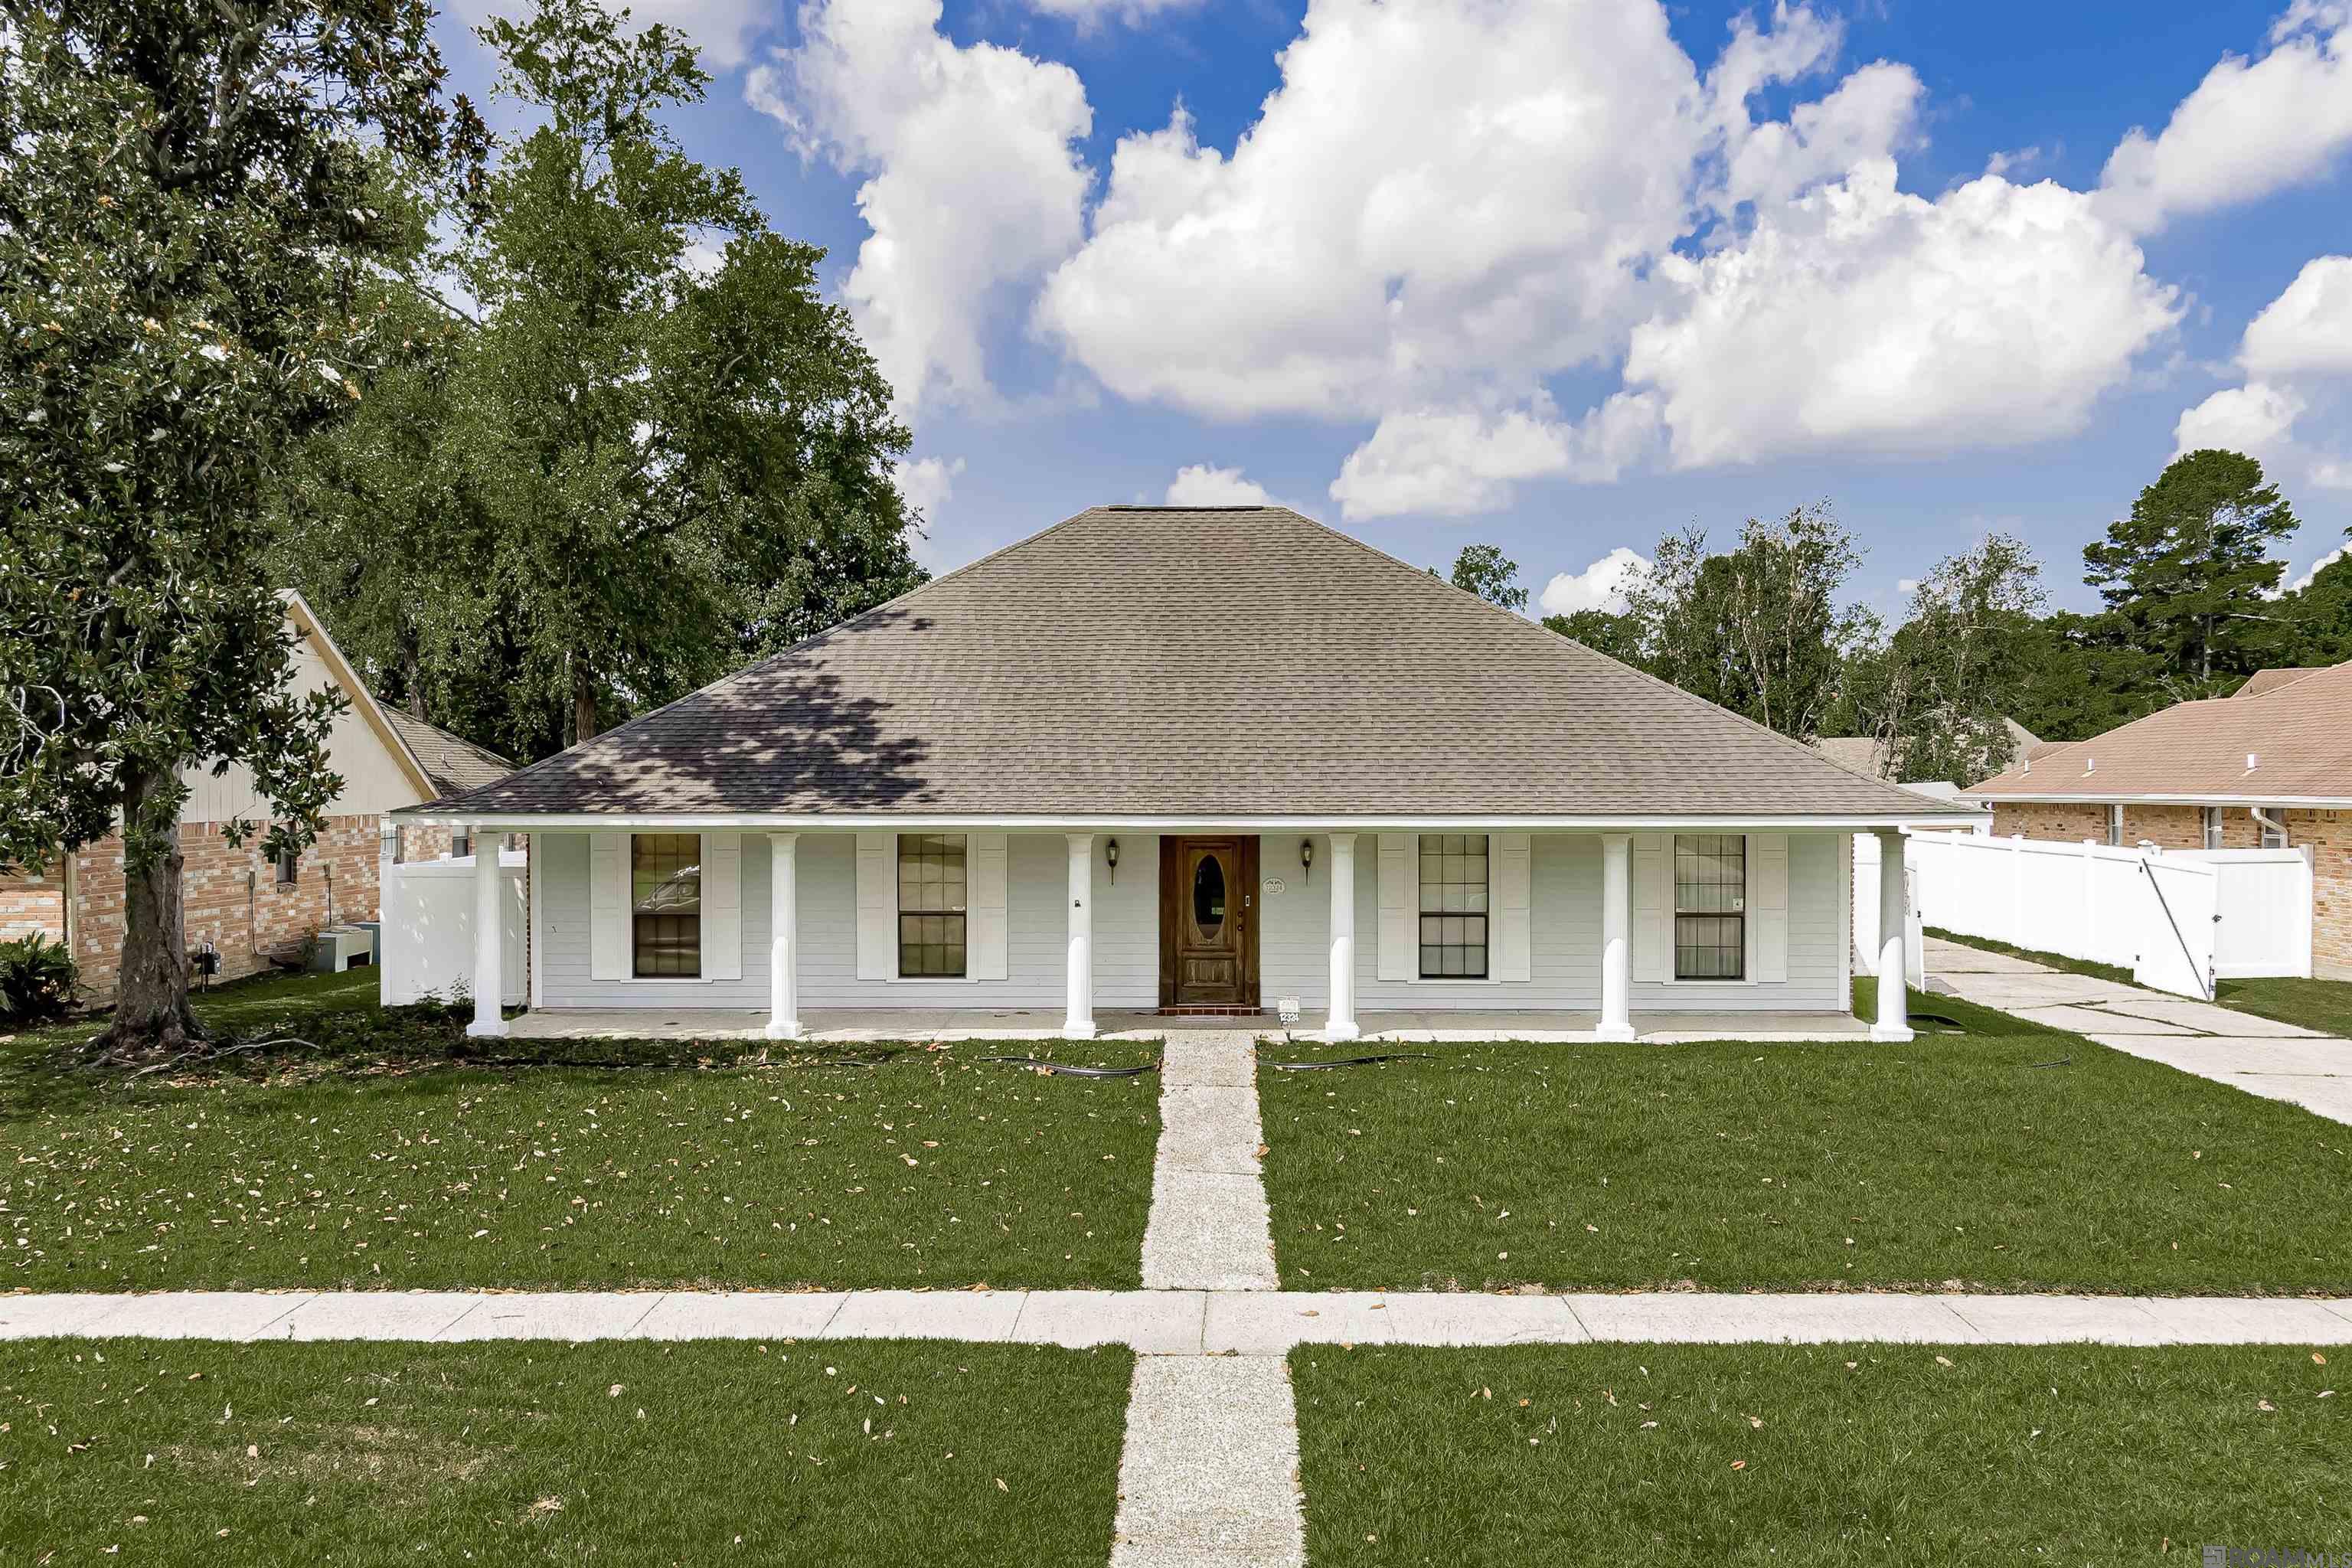
Pending
$299,900
4
bds
|
3
ba
|
2,384
sqft
|
built
1981
12324 Schlayer Ave, Baton Rouge, LA 70816
$54
Cash flow
0.9%
Cash-on-Cash Return
5.9%
Cap rate
0.7%
Rent to Value Ratio
Active
$230,000
3
bds
|
2
ba
|
1,441
sqft
|
built
2006
15064 Banff Ct, Baton Rouge, LA 70819
$144
Cash flow
3.3%
Cash-on-Cash Return
6.4%
Cap rate
0.8%
Rent to Value Ratio
Active
$880,000
4
bds
|
5
ba
|
4,354
sqft
|
built
2003
12119 Lake Estates Ave, Baton Rouge, LA 70810
$-2,069
Cash flow
-12.3%
Cash-on-Cash Return
2.9%
Cap rate
0.4%
Rent to Value Ratio
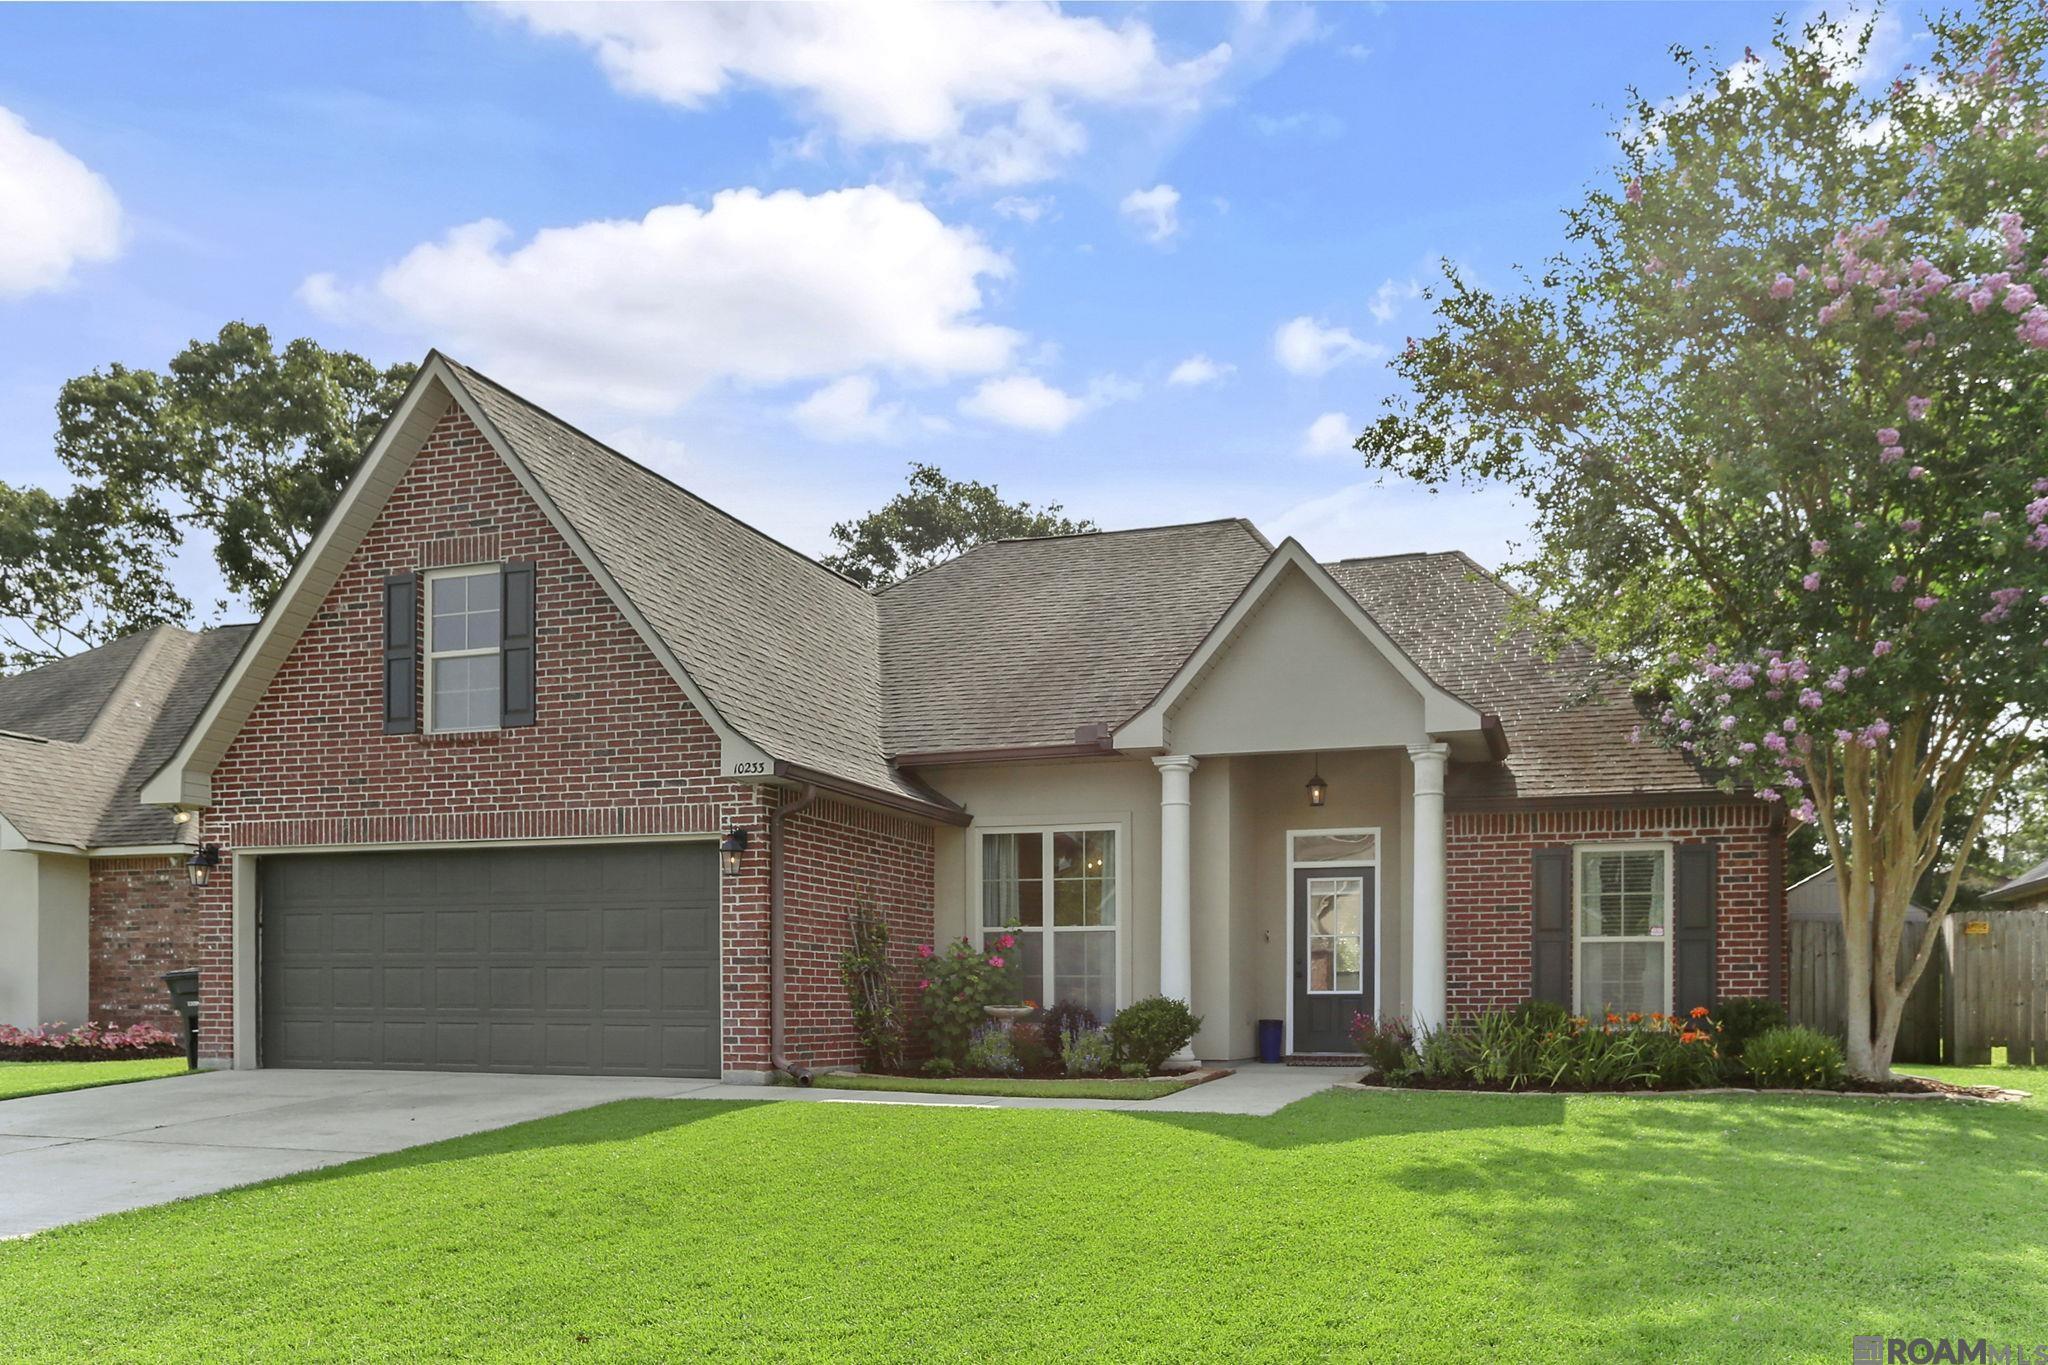
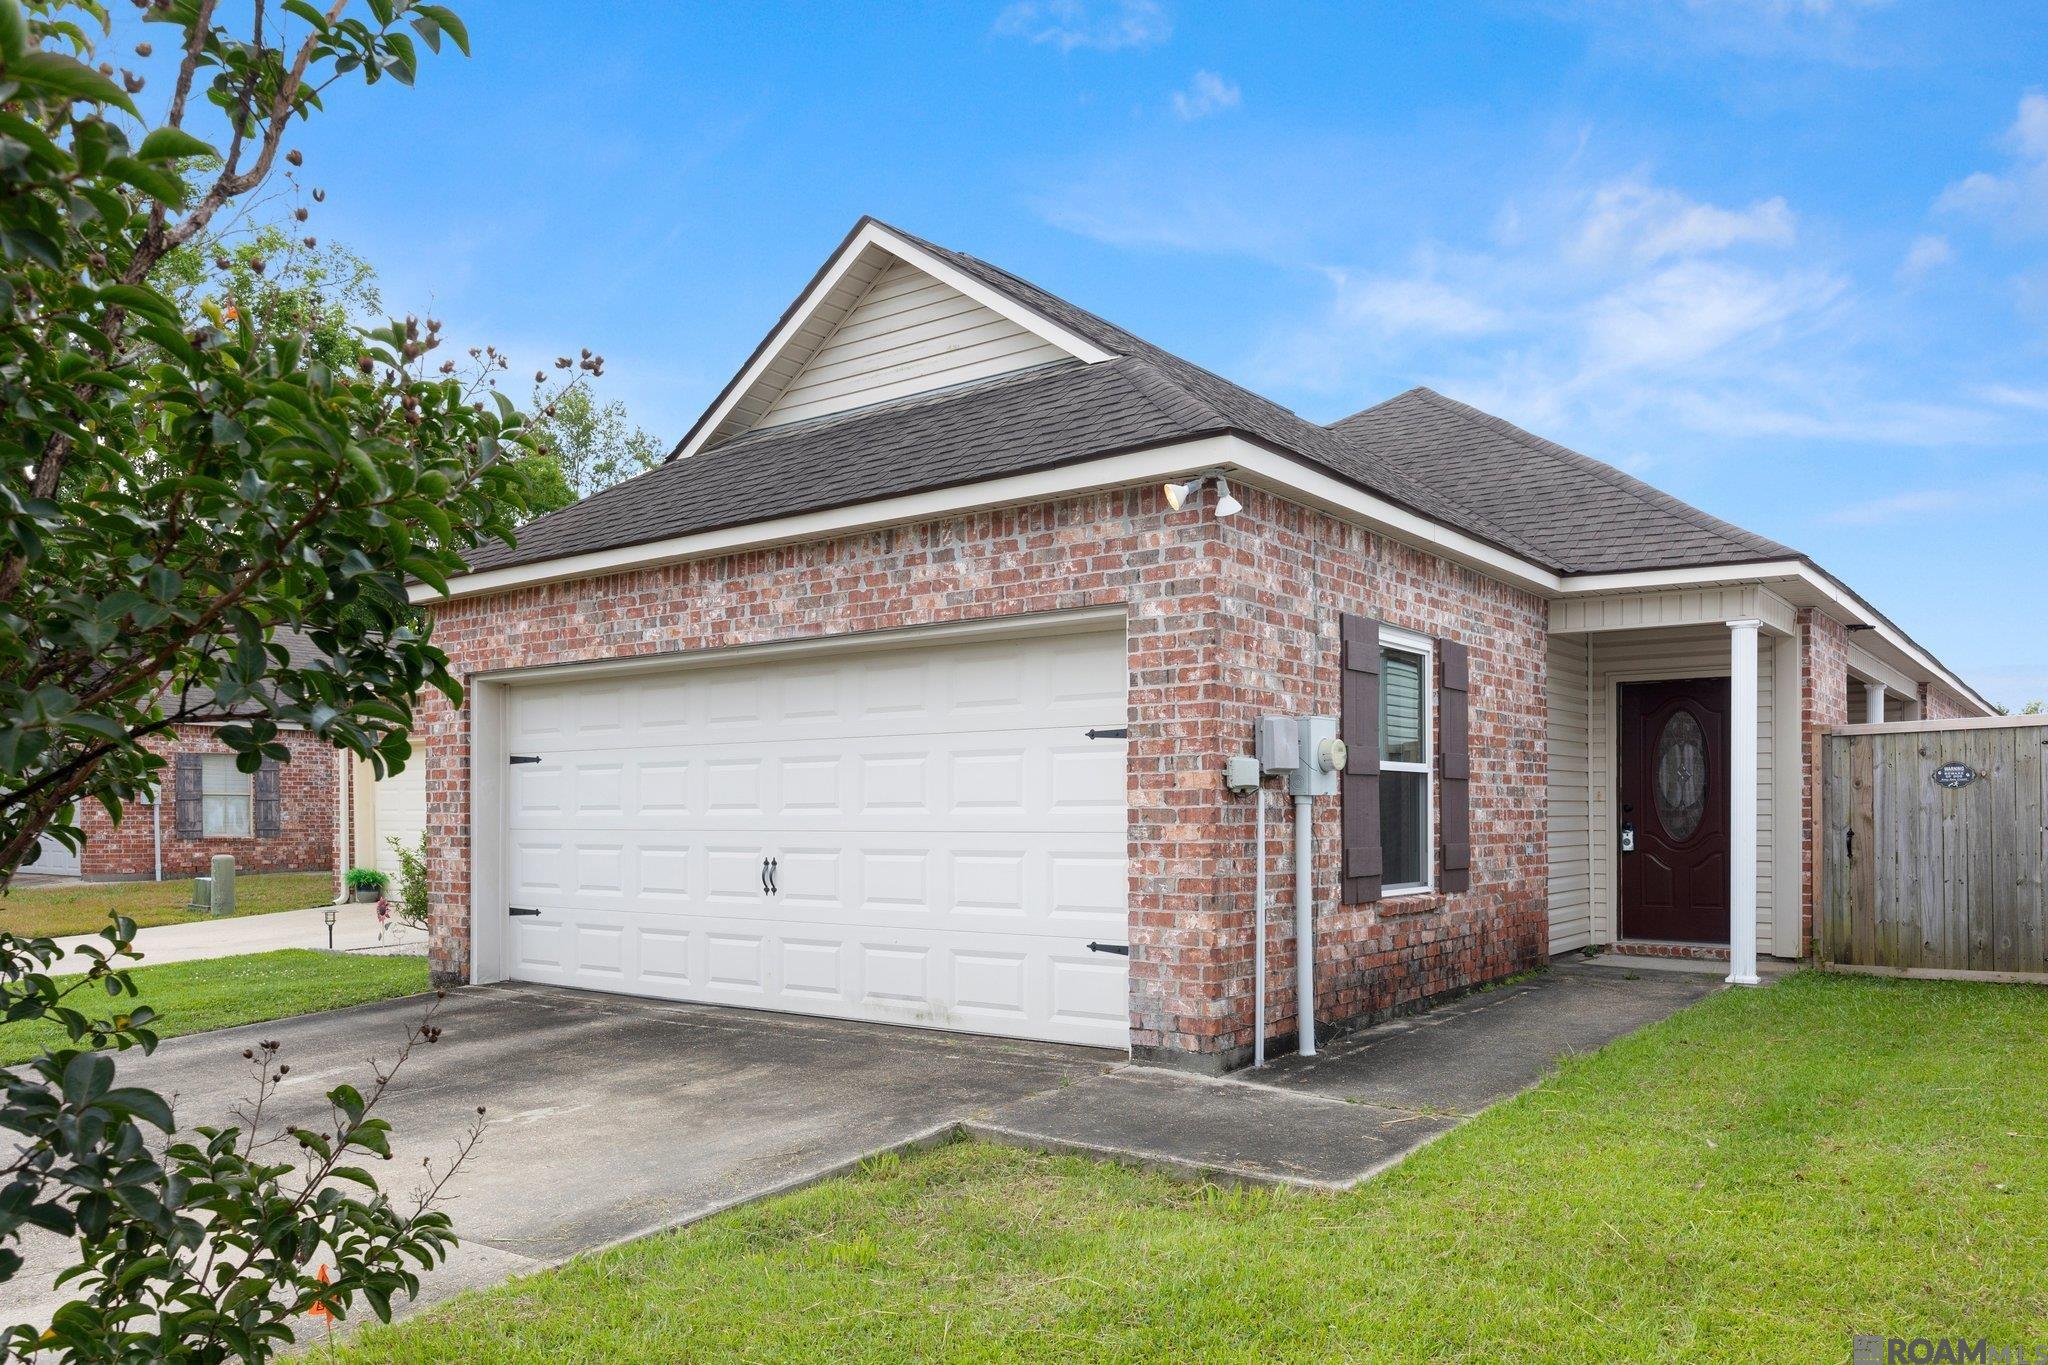
Active
$314,900
3
bds
|
2
ba
|
1,887
sqft
|
built
2012
10233 Savannah Jane Ln, Baton Rouge, LA 70817
$-1
Cash flow
0.0%
Cash-on-Cash Return
5.7%
Cap rate
0.7%
Rent to Value Ratio
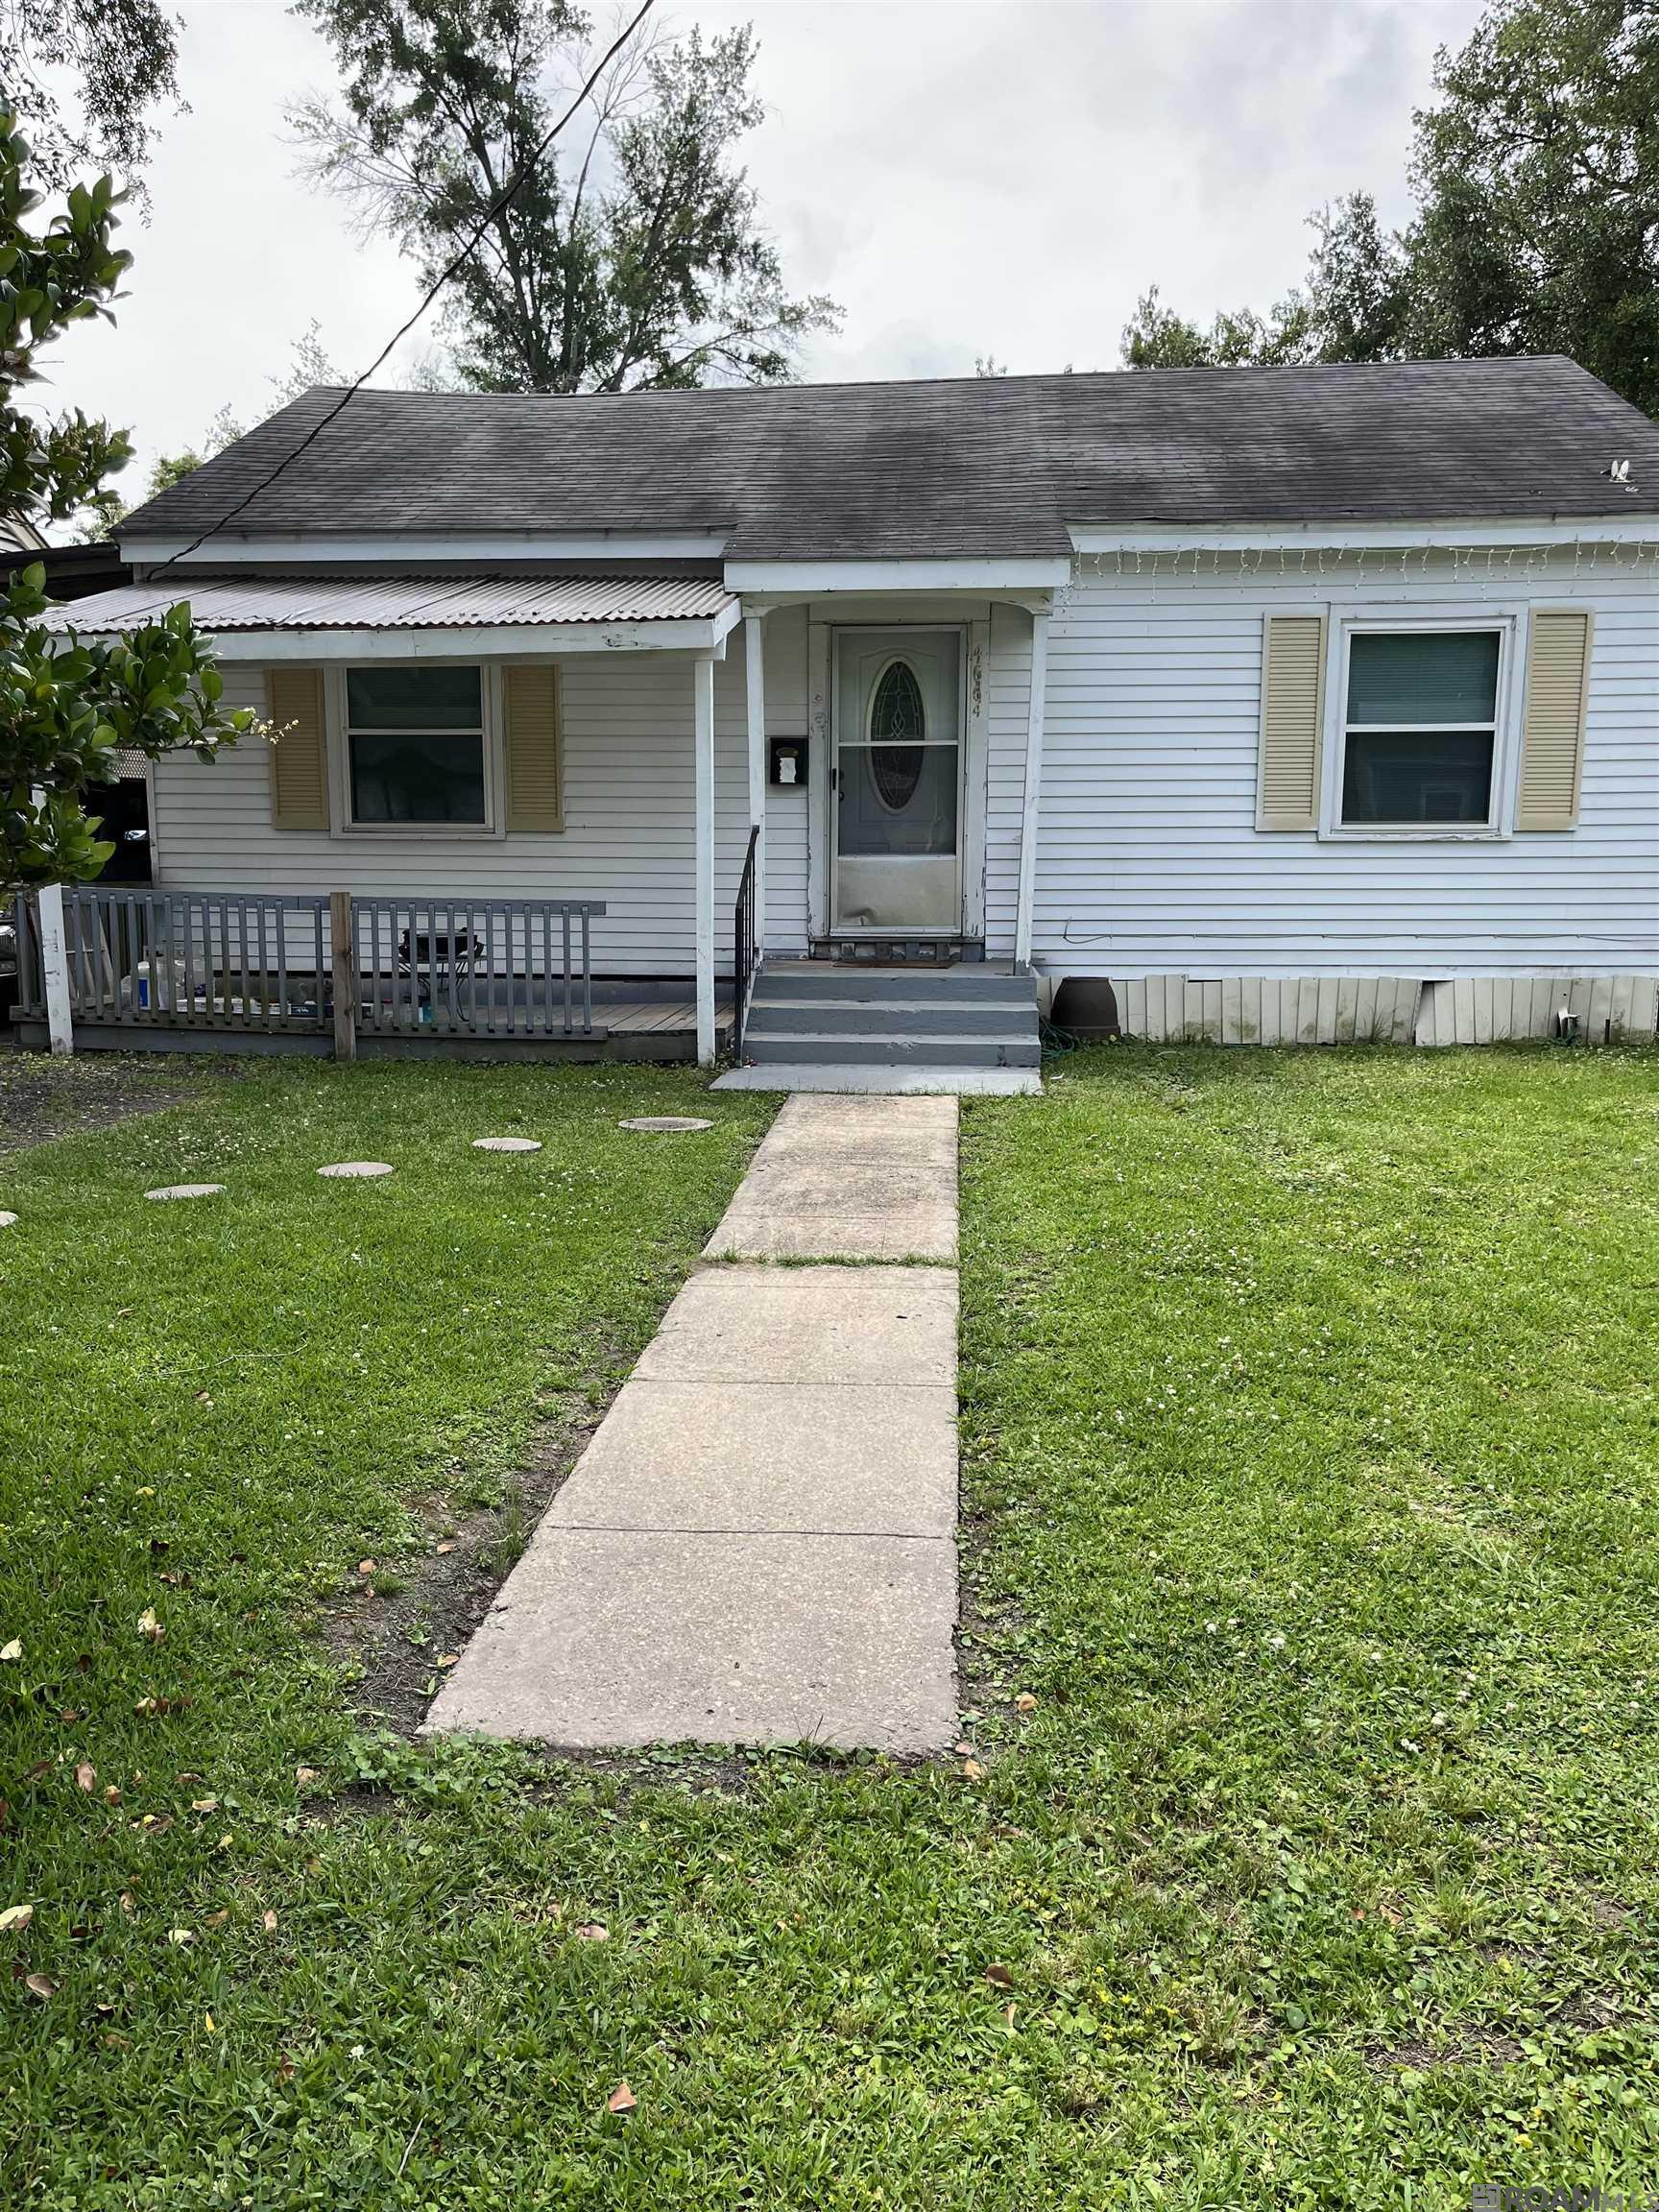
Active
$75,000
3
bds
|
1
ba
|
1,498
sqft
|
built
1995
4664 Osborne Ave, Baton Rouge, LA 70805
$473
Cash flow
32.9%
Cash-on-Cash Return
13.2%
Cap rate
1.6%
Rent to Value Ratio
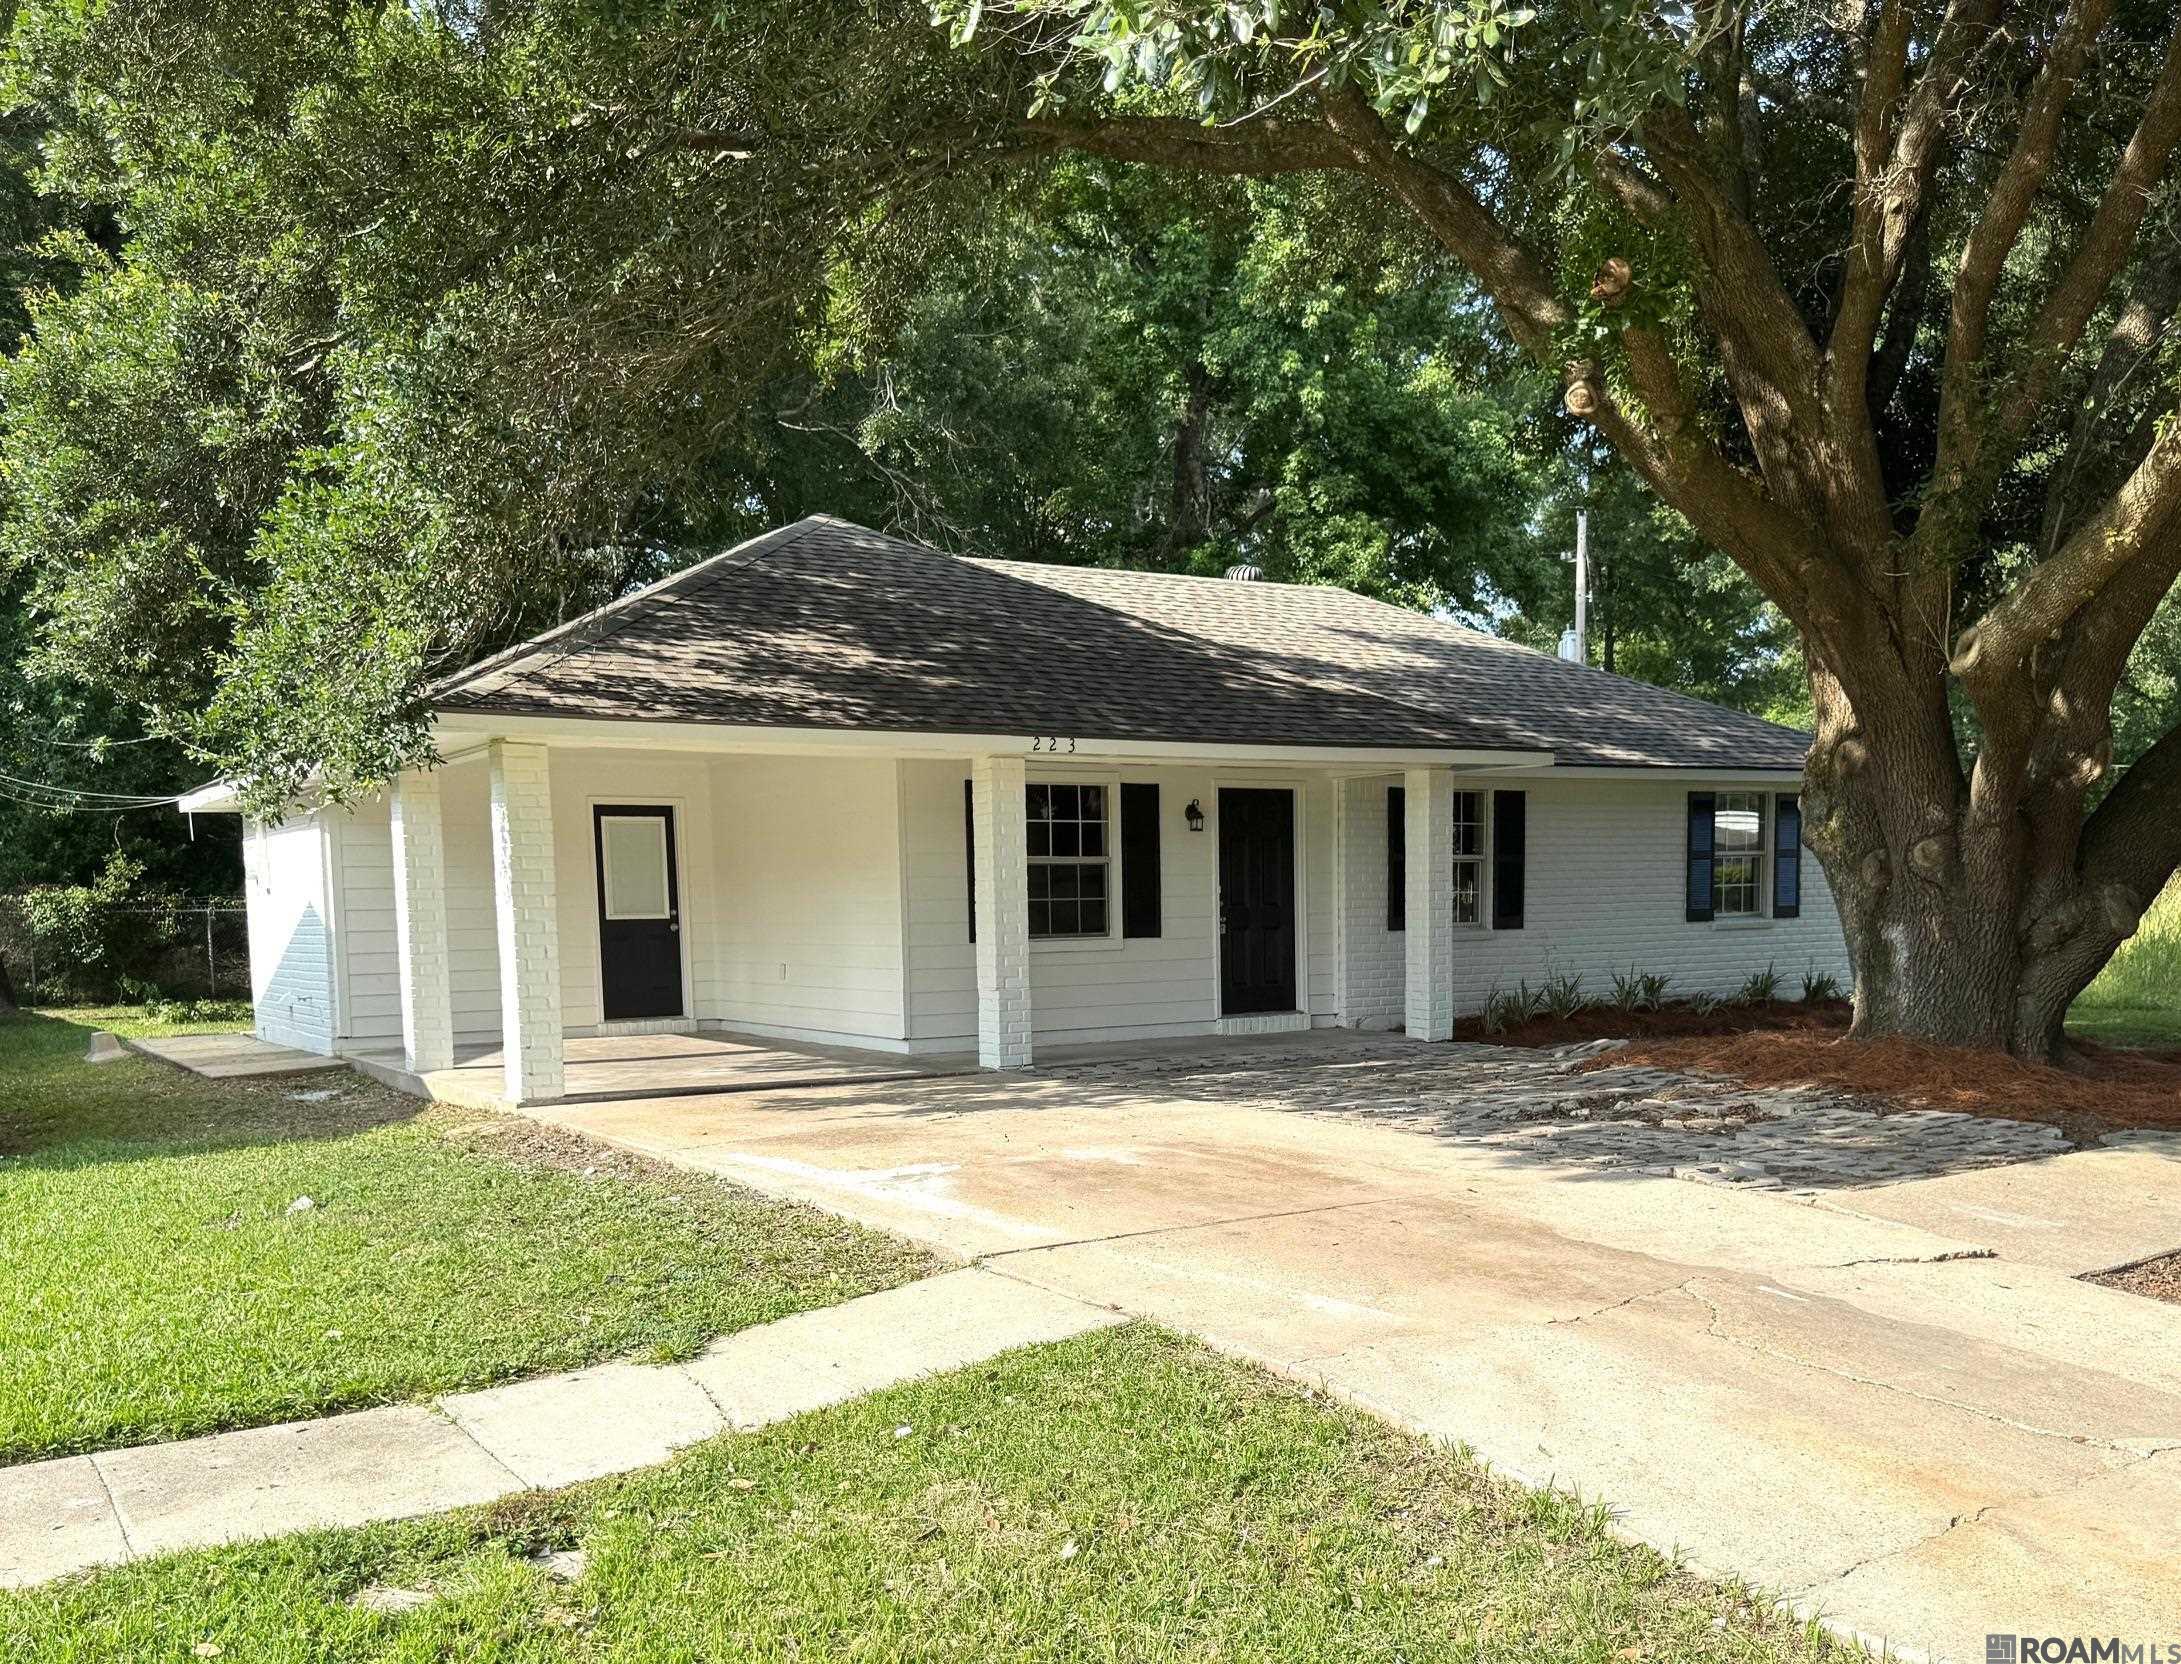
Pending
$159,000
3
bds
|
2
ba
|
1,150
sqft
|
built
1980
223 Gatebriar St, Baton Rouge, LA 70807
$76
Cash flow
2.5%
Cash-on-Cash Return
6.2%
Cap rate
0.8%
Rent to Value Ratio
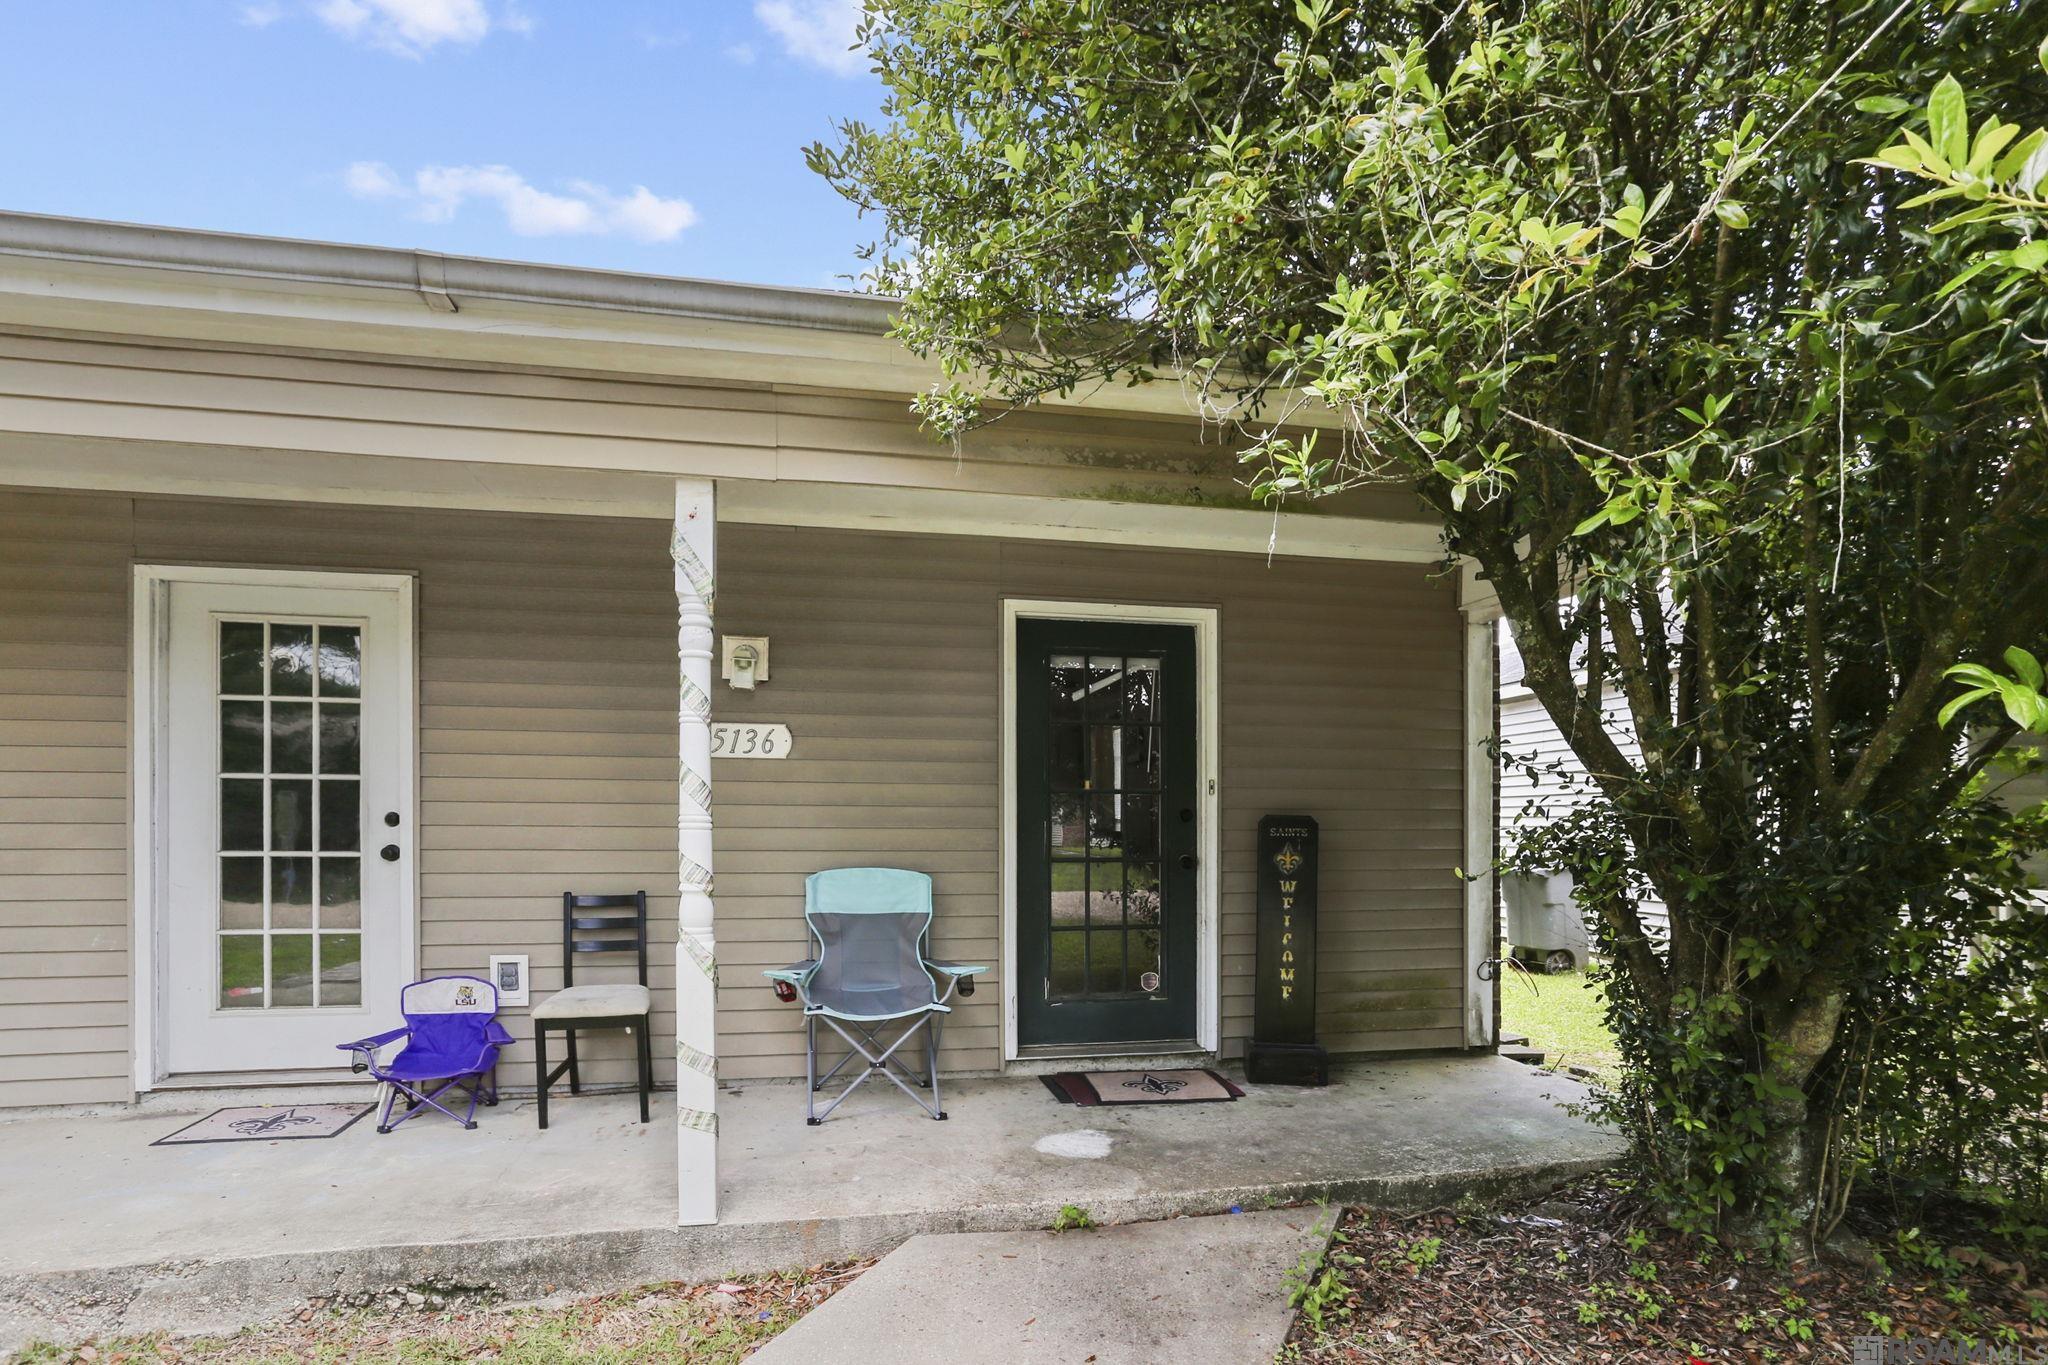
Active
$129,900
2
bds
|
1
ba
|
982
sqft
|
built
1982
5136 Cumberland Cove Dr, Baton Rouge, LA 70817
$144
Cash flow
5.8%
Cash-on-Cash Return
7.0%
Cap rate
0.8%
Rent to Value Ratio
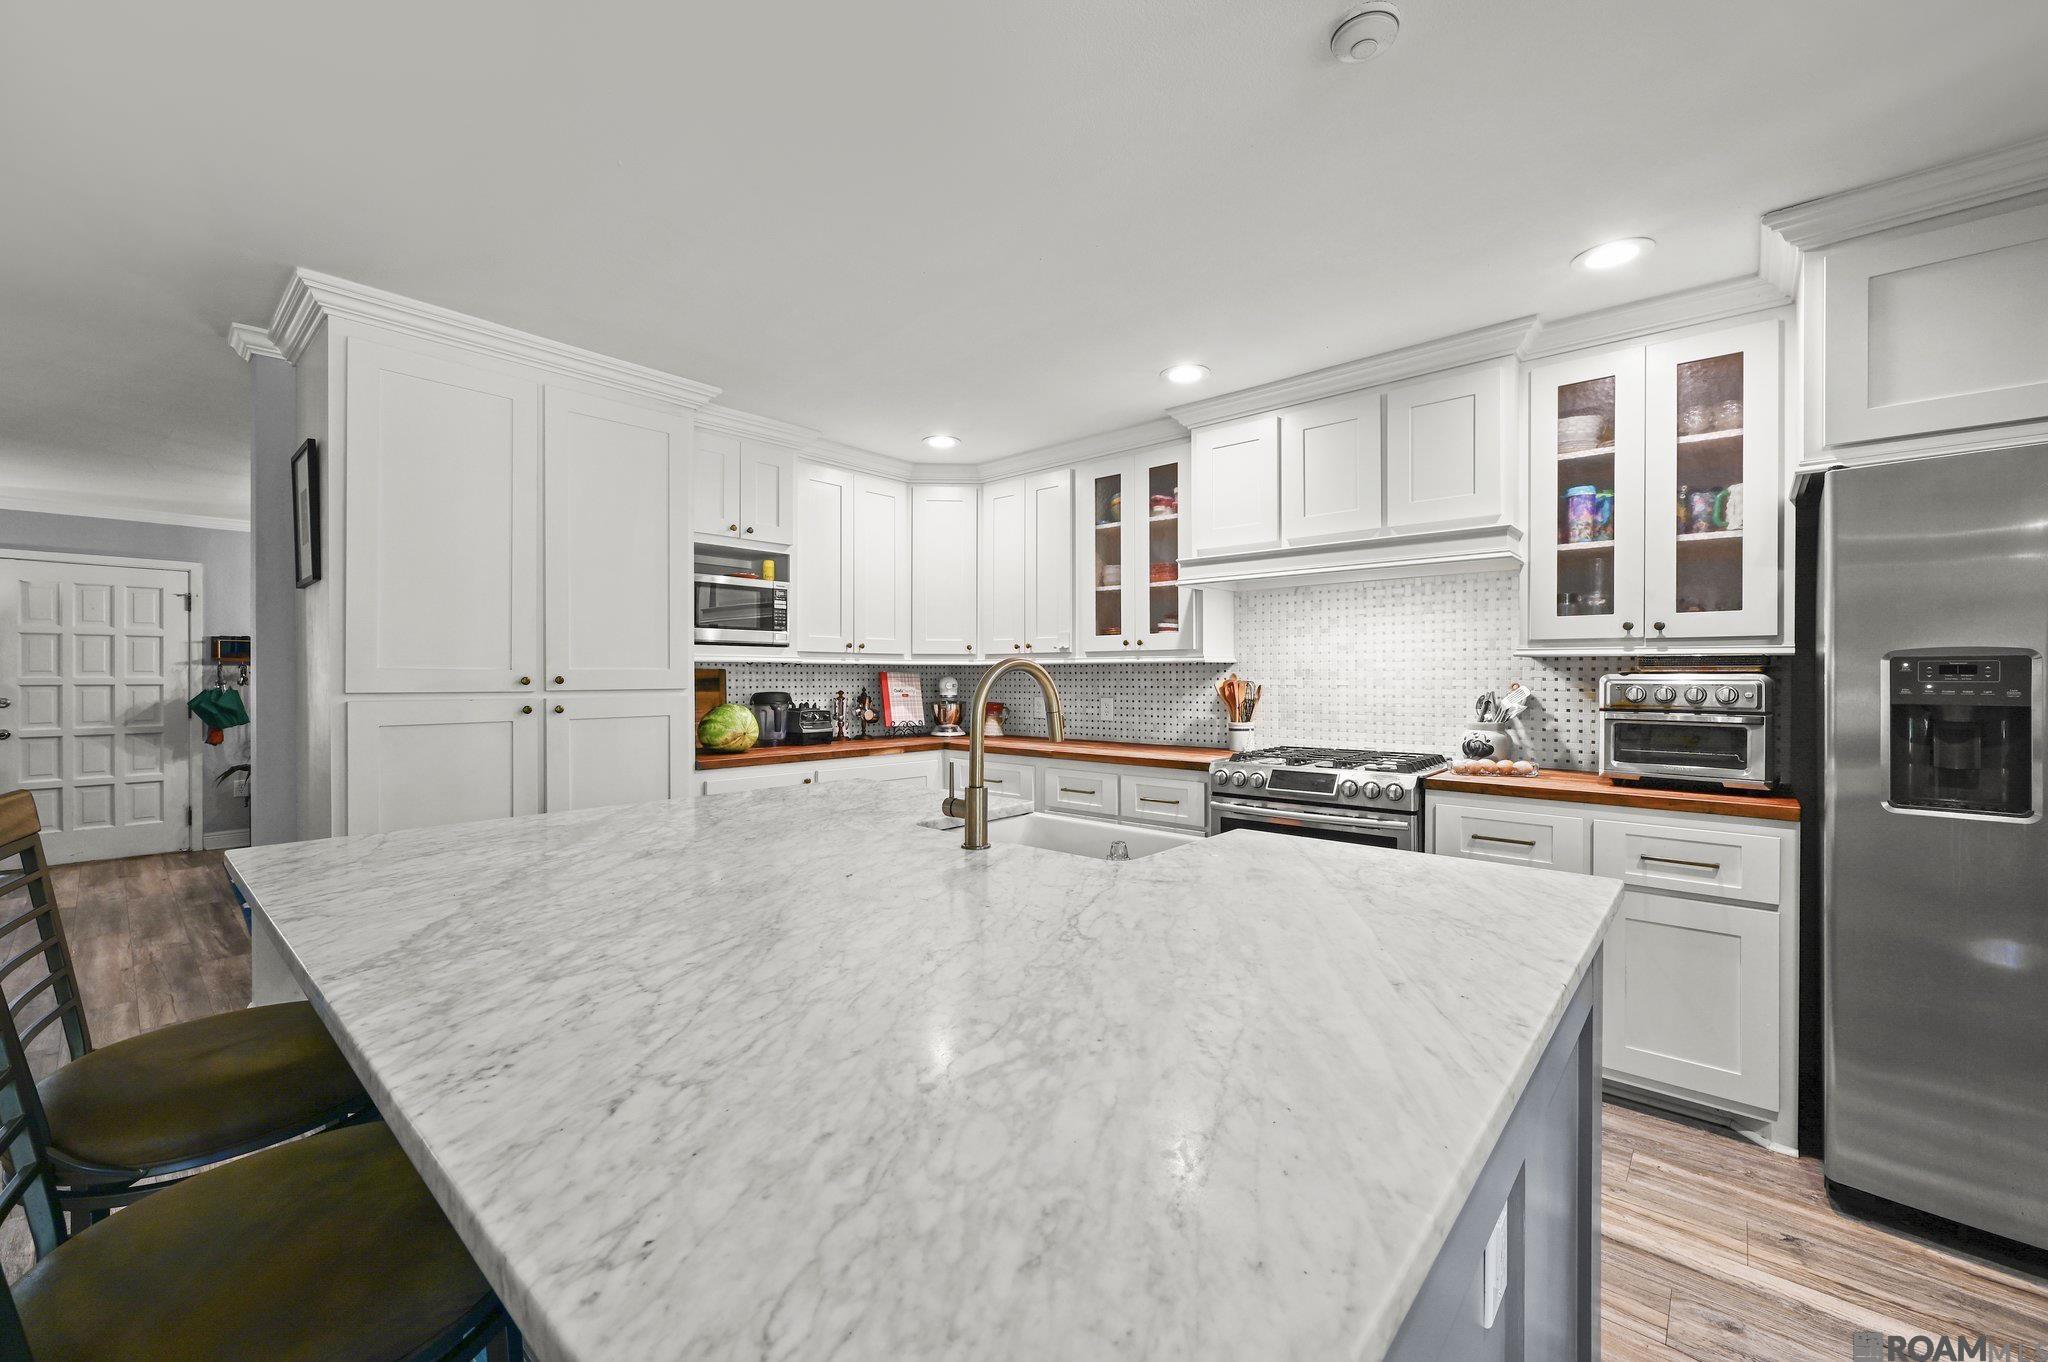
Active
$475,000
5
bds
|
3
ba
|
2,870
sqft
|
built
1960
460 Bancroft Way, Baton Rouge, LA 70808
$167
Cash flow
1.8%
Cash-on-Cash Return
6.1%
Cap rate
0.7%
Rent to Value Ratio
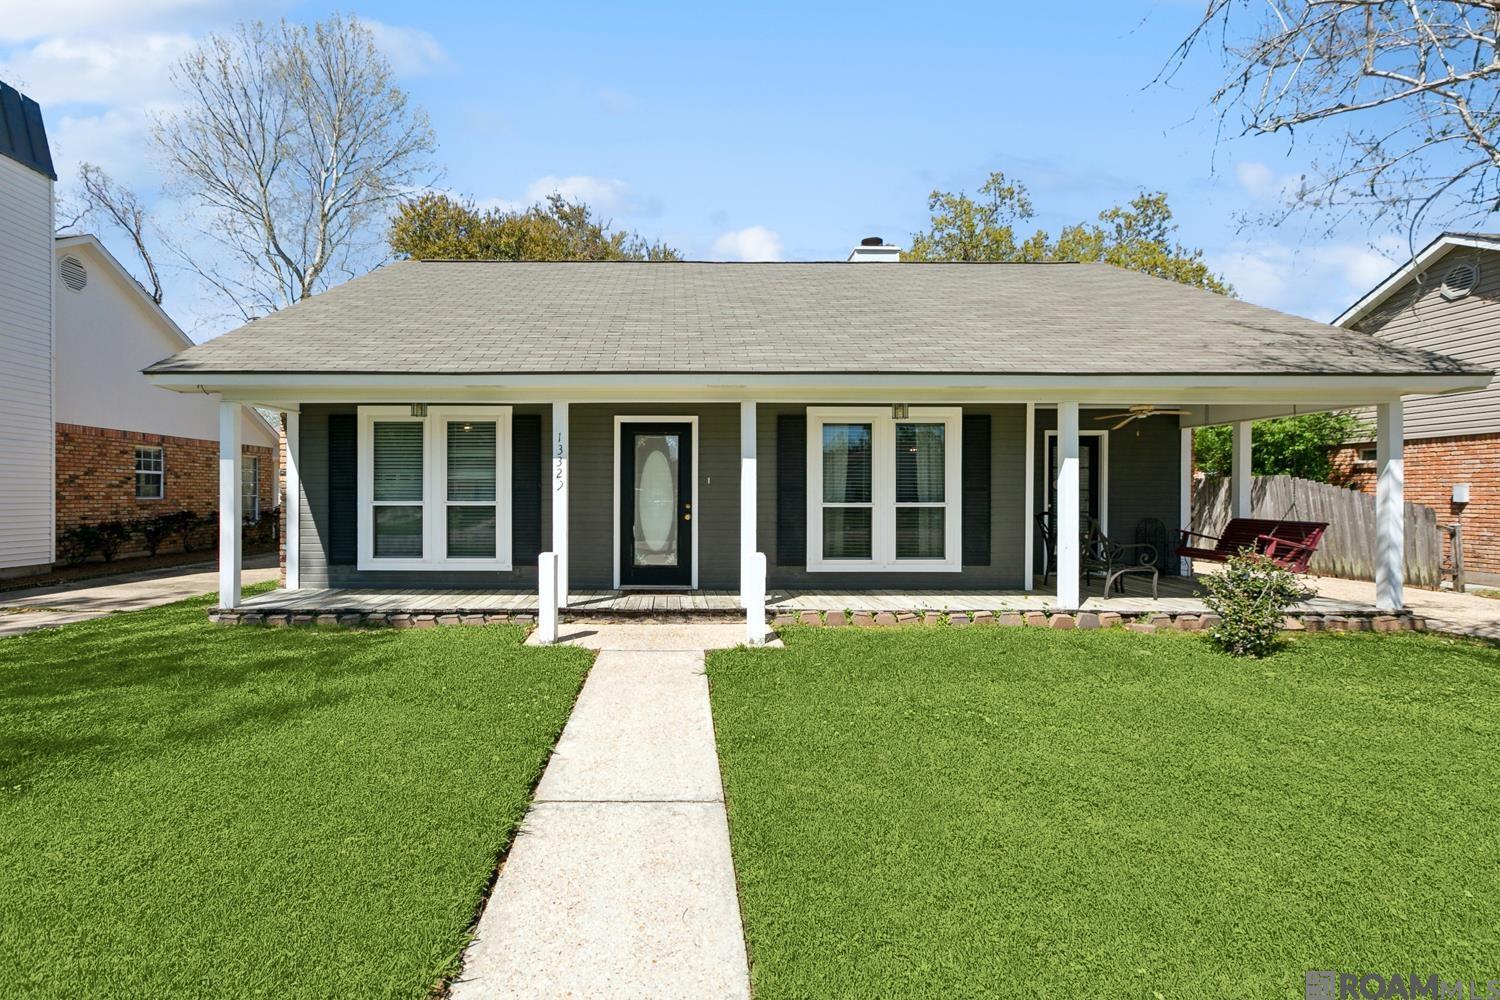
Pending
$230,000
3
bds
|
2
ba
|
1,631
sqft
|
built
1986
13329 Country Meadow Ave, Baton Rouge, LA 70816
$154
Cash flow
3.5%
Cash-on-Cash Return
6.5%
Cap rate
0.8%
Rent to Value Ratio
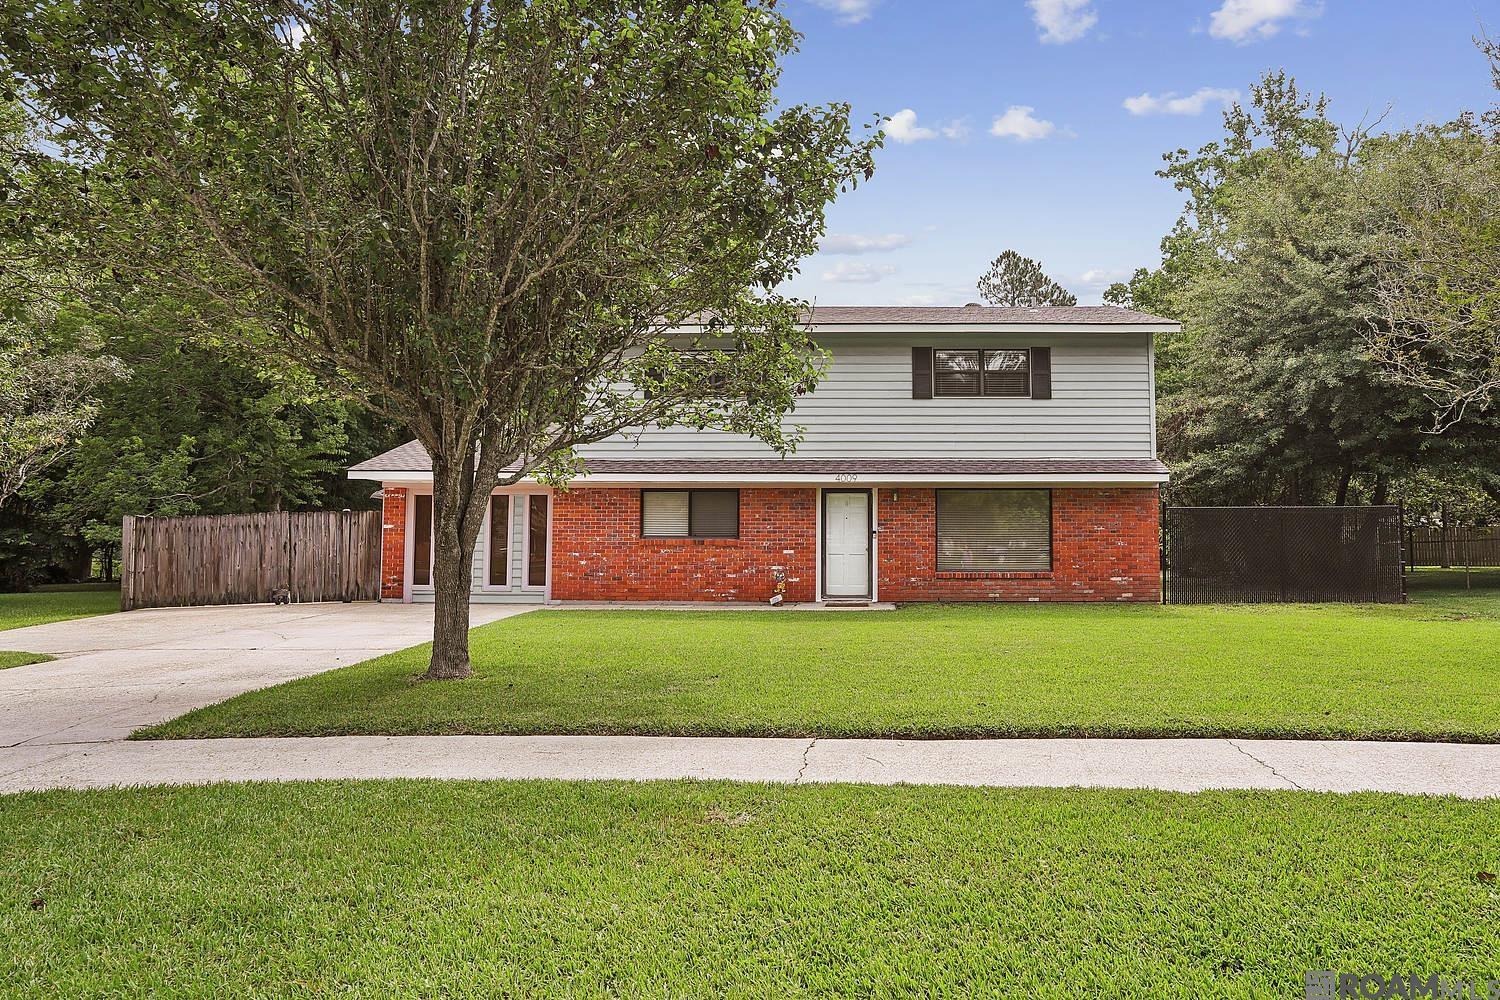
Active
$310,000
3
bds
|
3
ba
|
2,250
sqft
|
built
1987
4009 Downing Dr, Baton Rouge, LA 70809
$-225
Cash flow
-3.8%
Cash-on-Cash Return
4.8%
Cap rate
0.6%
Rent to Value Ratio
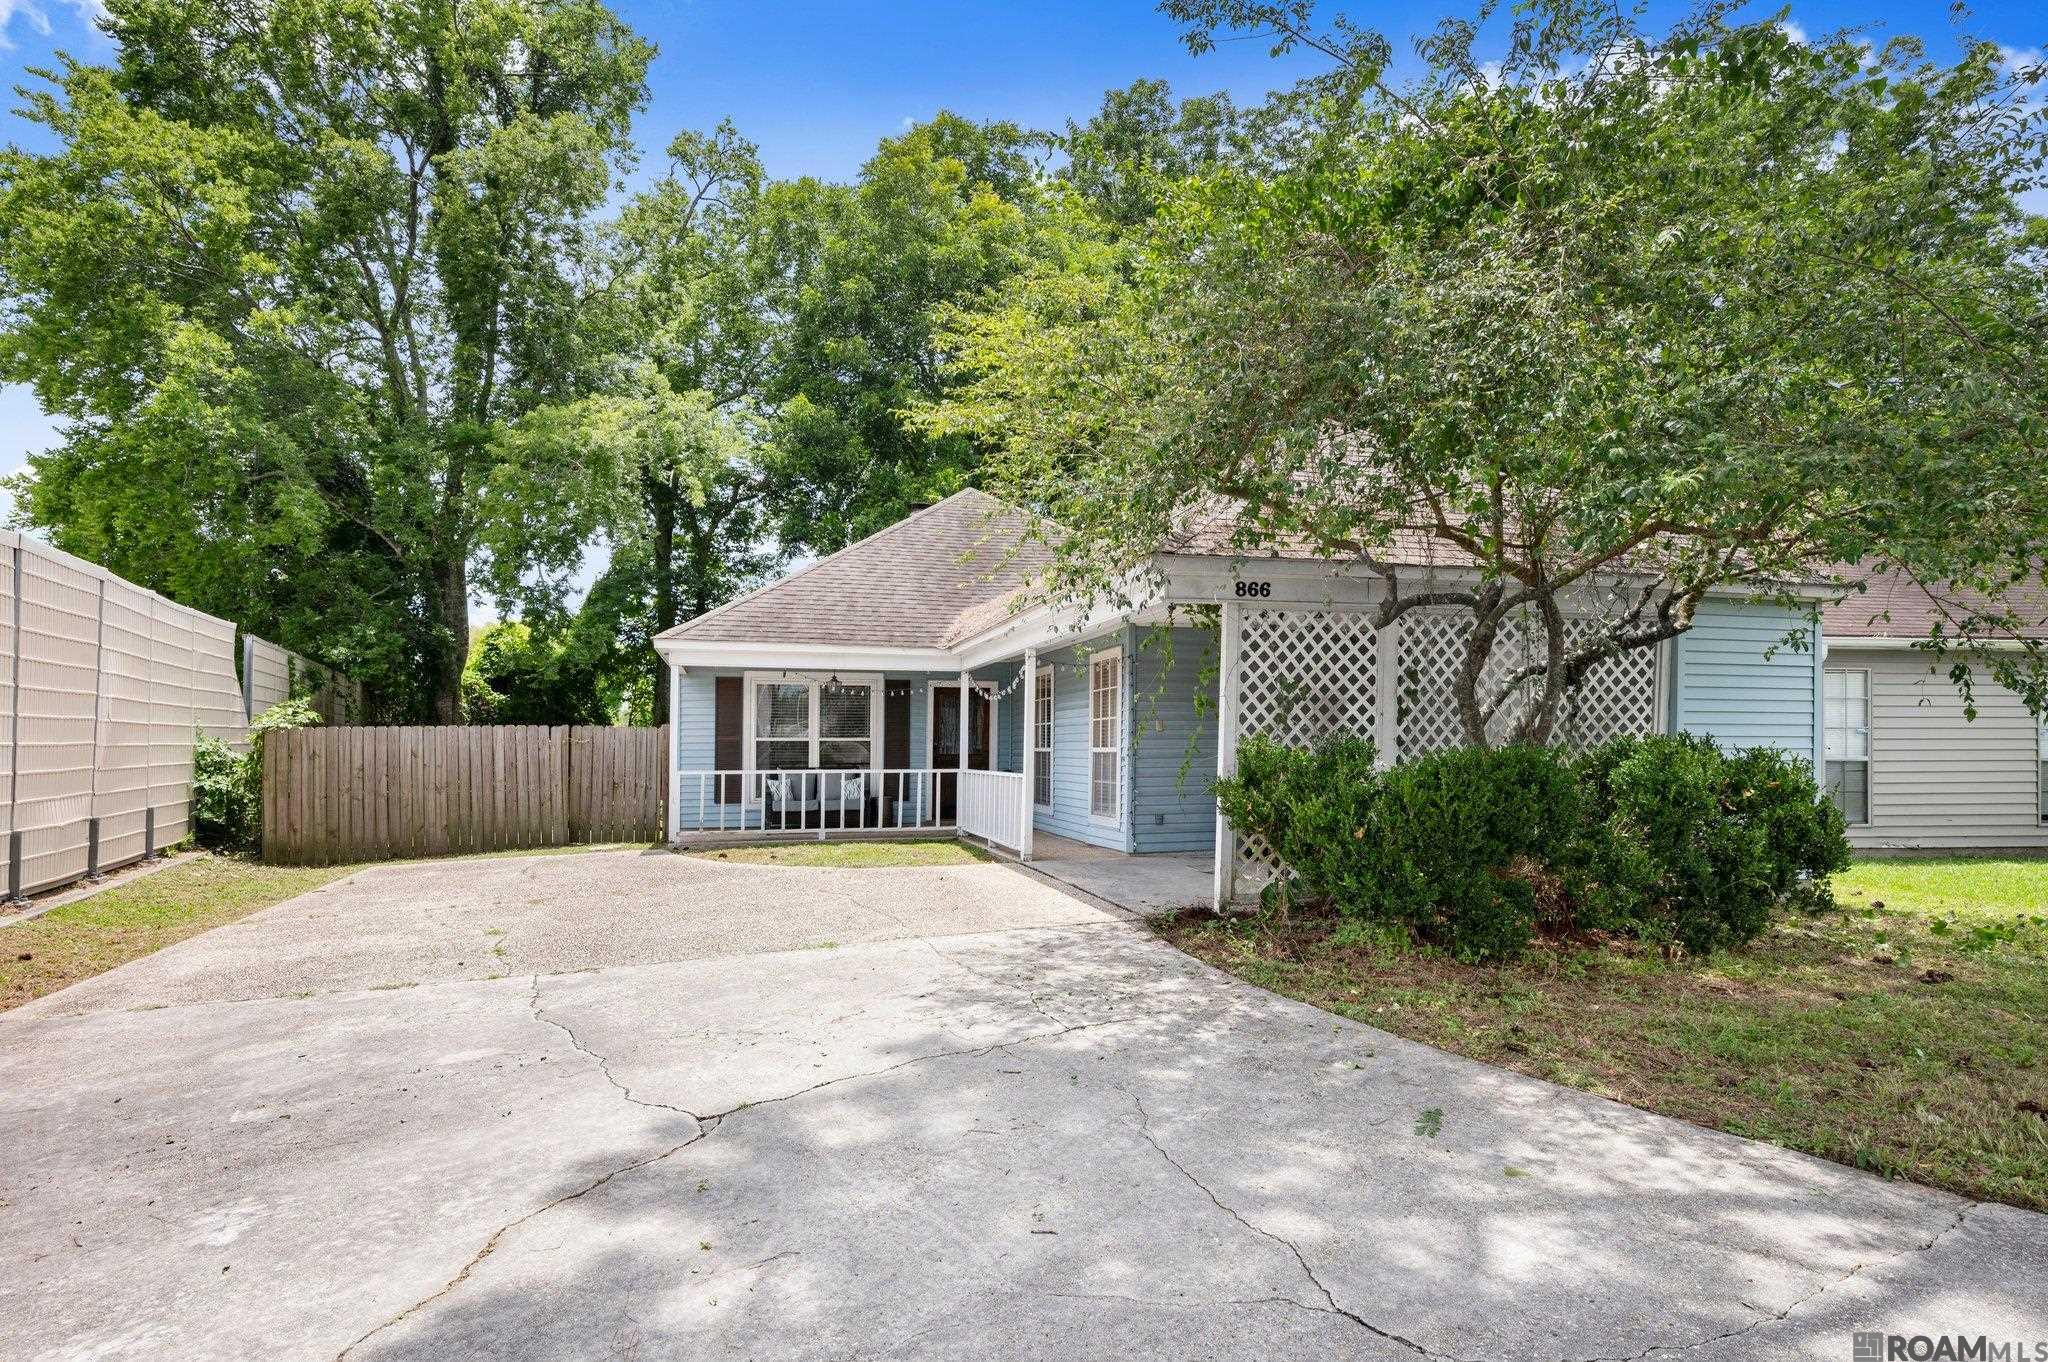
Active
$185,000
2
bds
|
2
ba
|
1,296
sqft
|
built
1983
866 Stoney Creek Ave, Baton Rouge, LA 70808
$-116
Cash flow
-3.3%
Cash-on-Cash Return
4.9%
Cap rate
0.6%
Rent to Value Ratio
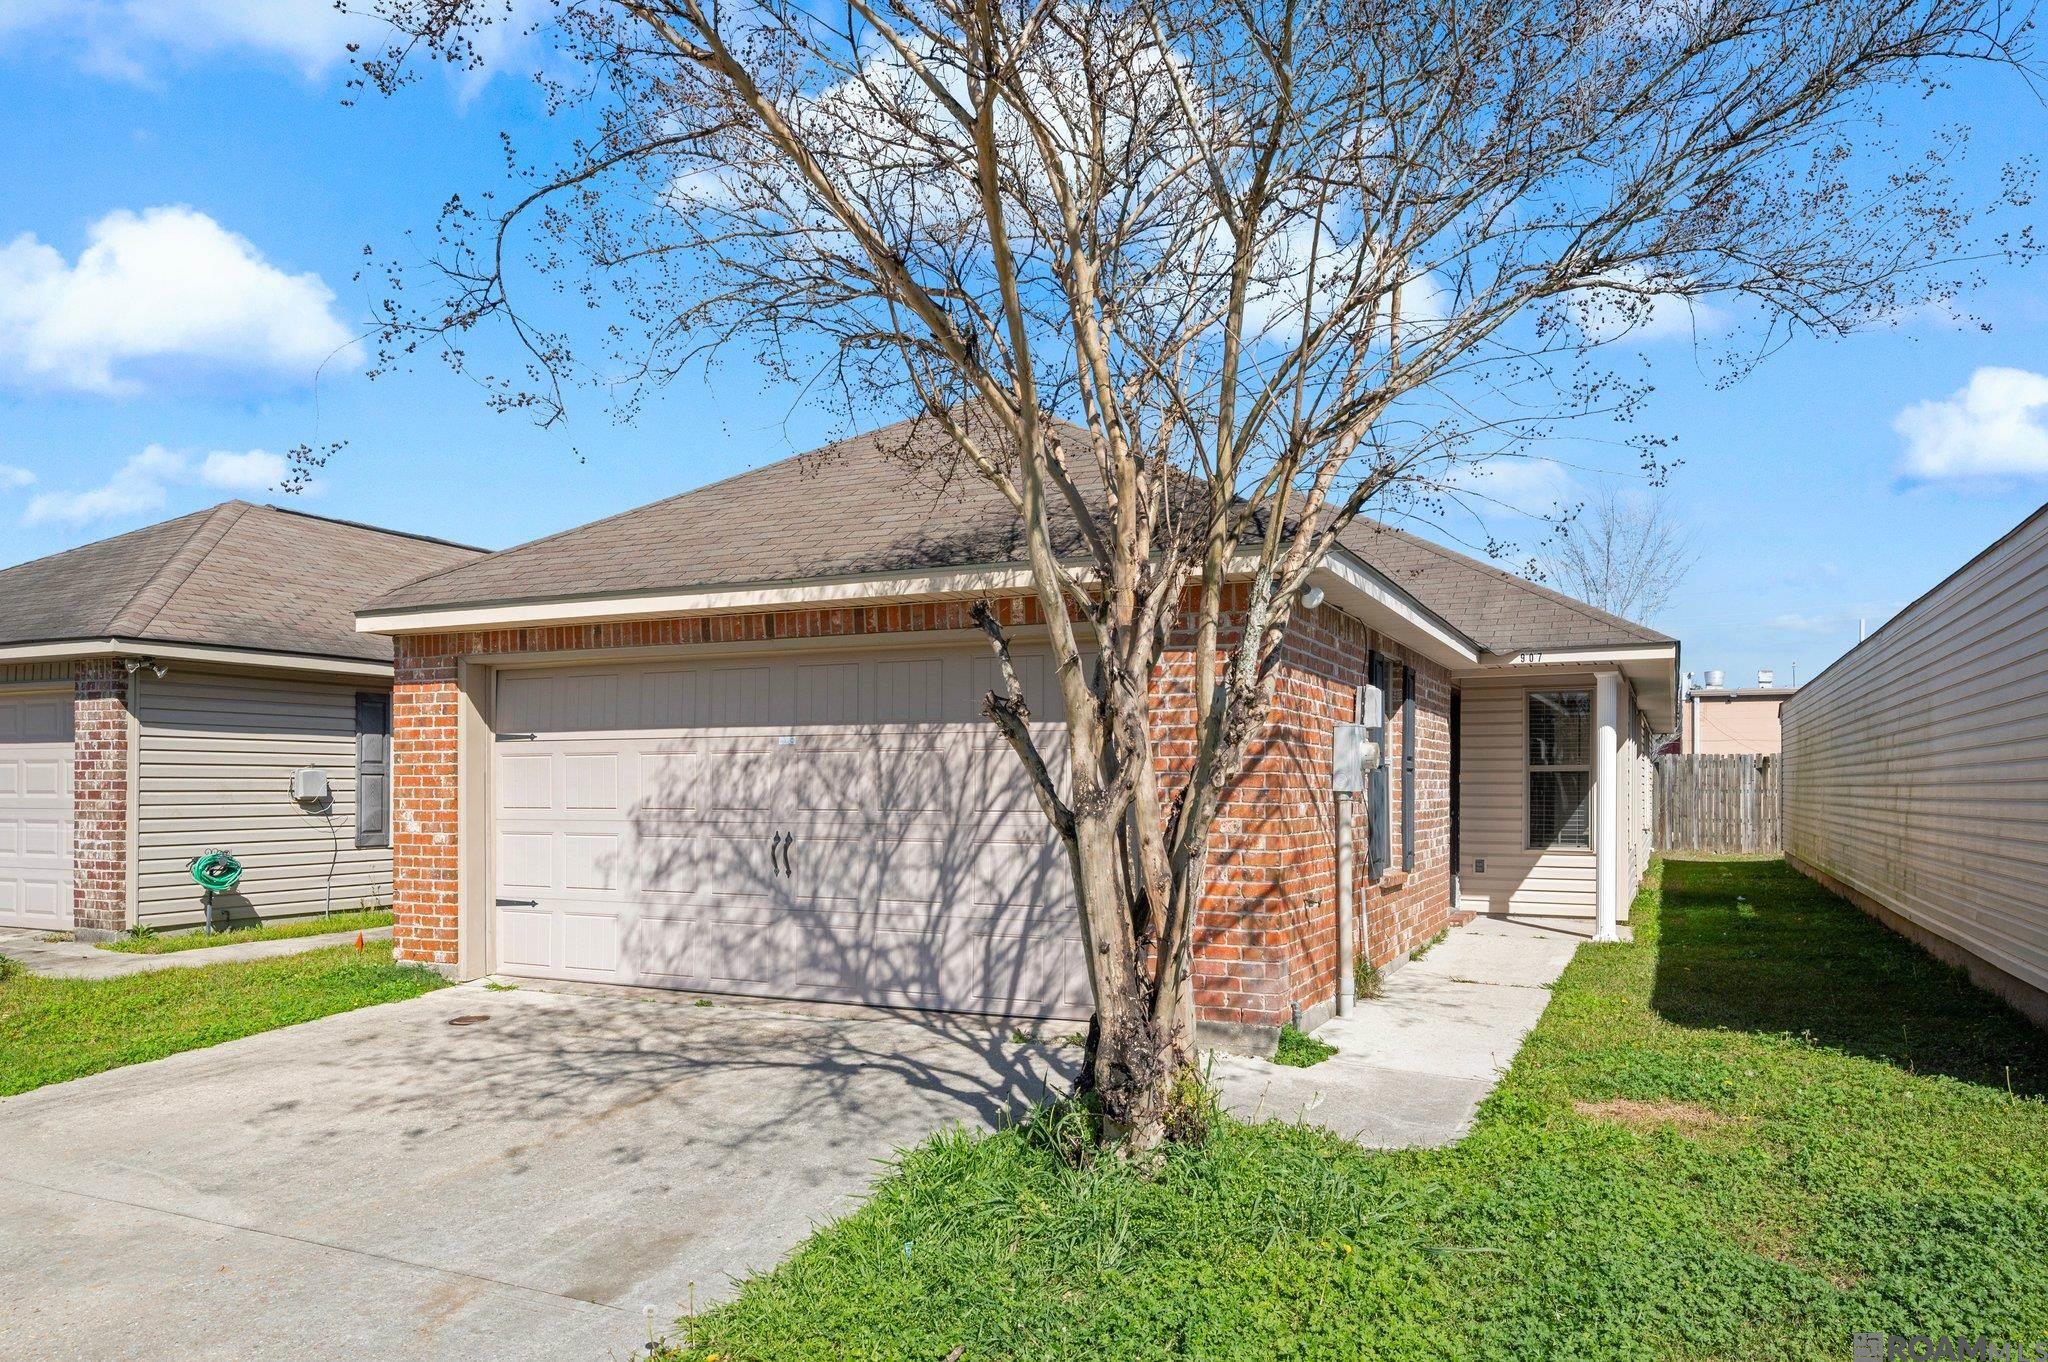
Active
$185,000
3
bds
|
2
ba
|
1,244
sqft
|
built
2011
907 Sedona Pines Dr, Baton Rouge, LA 70816
$212
Cash flow
6.0%
Cash-on-Cash Return
7.1%
Cap rate
0.9%
Rent to Value Ratio
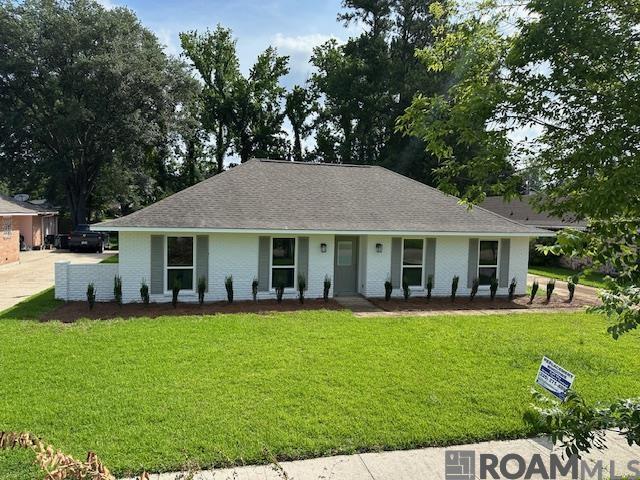
Active
$265,000
3
bds
|
2
ba
|
1,550
sqft
|
built
1973
9009 Staring Ct, Baton Rouge, LA 70810
$-81
Cash flow
-1.6%
Cash-on-Cash Return
5.3%
Cap rate
0.6%
Rent to Value Ratio
Active
$325,000
bds
|
0
ba
|
4,290
sqft
|
built
1983
8756 Elvin Dr, Baton Rouge, LA 70810
$-434
Cash flow
-7.0%
Cash-on-Cash Return
4.1%
Cap rate
0.5%
Rent to Value Ratio
Active
$240,000
3
bds
|
2
ba
|
1,452
sqft
|
built
1993
7871 Director Dr, Baton Rouge, LA 70817
$37
Cash flow
0.8%
Cash-on-Cash Return
5.9%
Cap rate
0.7%
Rent to Value Ratio

Active
$259,900
3
bds
|
2
ba
|
1,611
sqft
|
built
2006
9329 Boone Dr, Baton Rouge, LA 70810
$125
Cash flow
2.5%
Cash-on-Cash Return
6.3%
Cap rate
0.8%
Rent to Value Ratio
Active
$35,000
2
bds
|
1
ba
|
964
sqft
|
built
1955
3969 Chippewa St, Baton Rouge, LA 70805
$828
Cash flow
27.6%
Cash-on-Cash Return
28.4%
Cap rate
3.4%
Rent to Value Ratio
Active
$32,000
2
bds
|
1
ba
|
890
sqft
|
built
1975
4014 Dalton St, Baton Rouge, LA 70805
$828
Cash flow
30.1%
Cash-on-Cash Return
31.1%
Cap rate
3.8%
Rent to Value Ratio
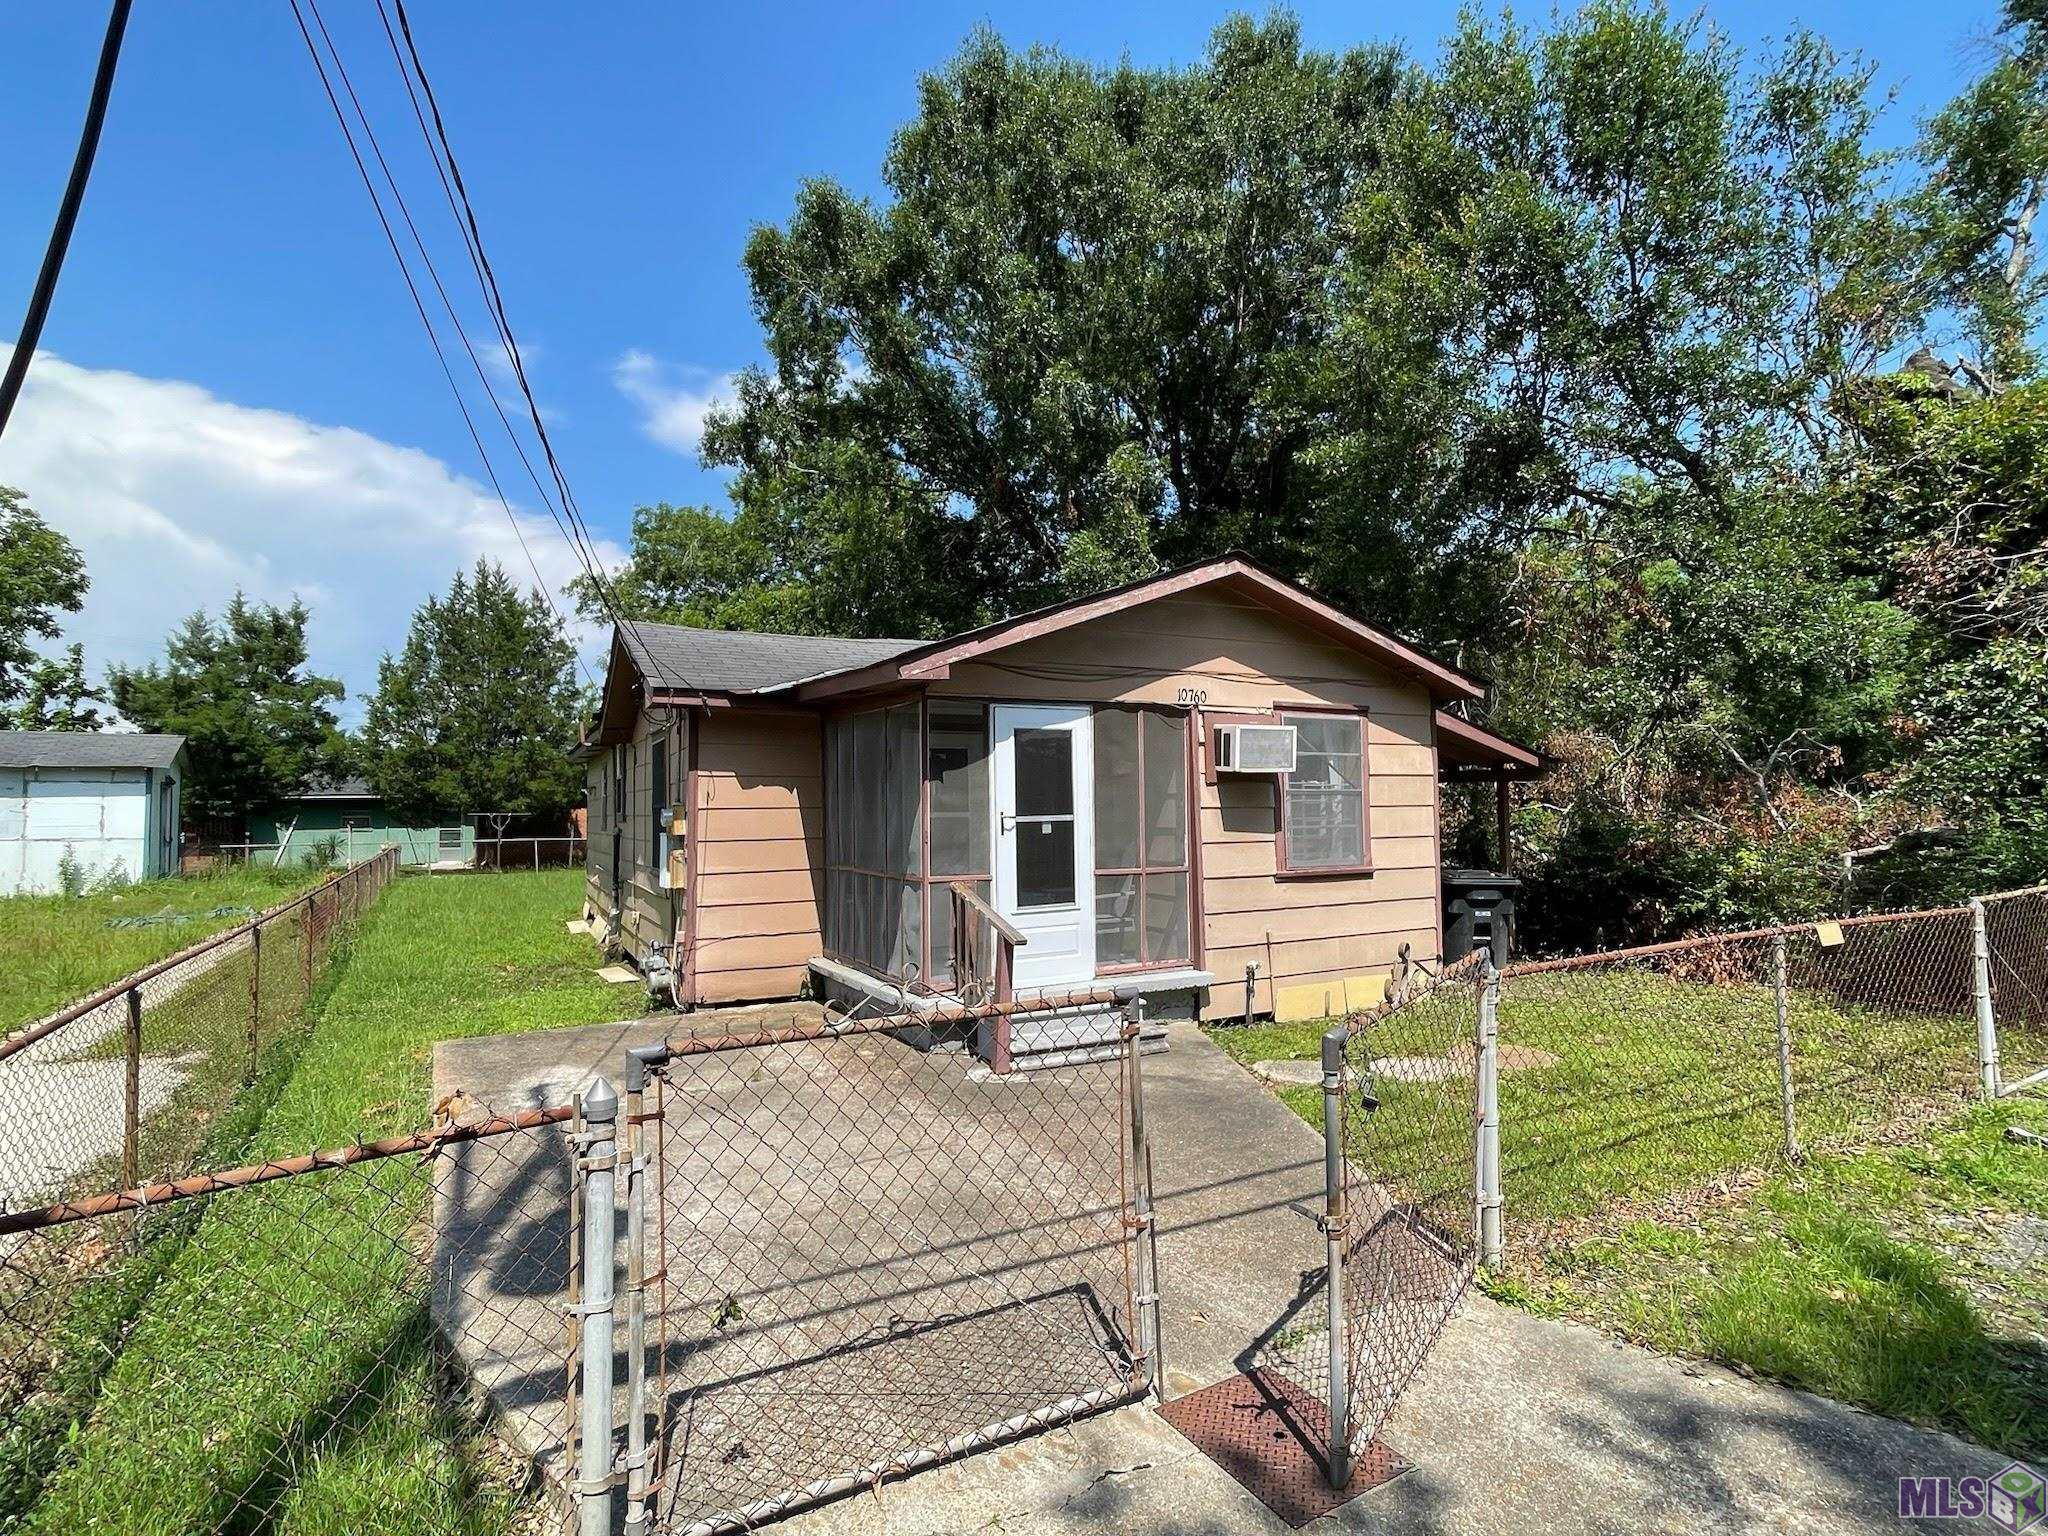
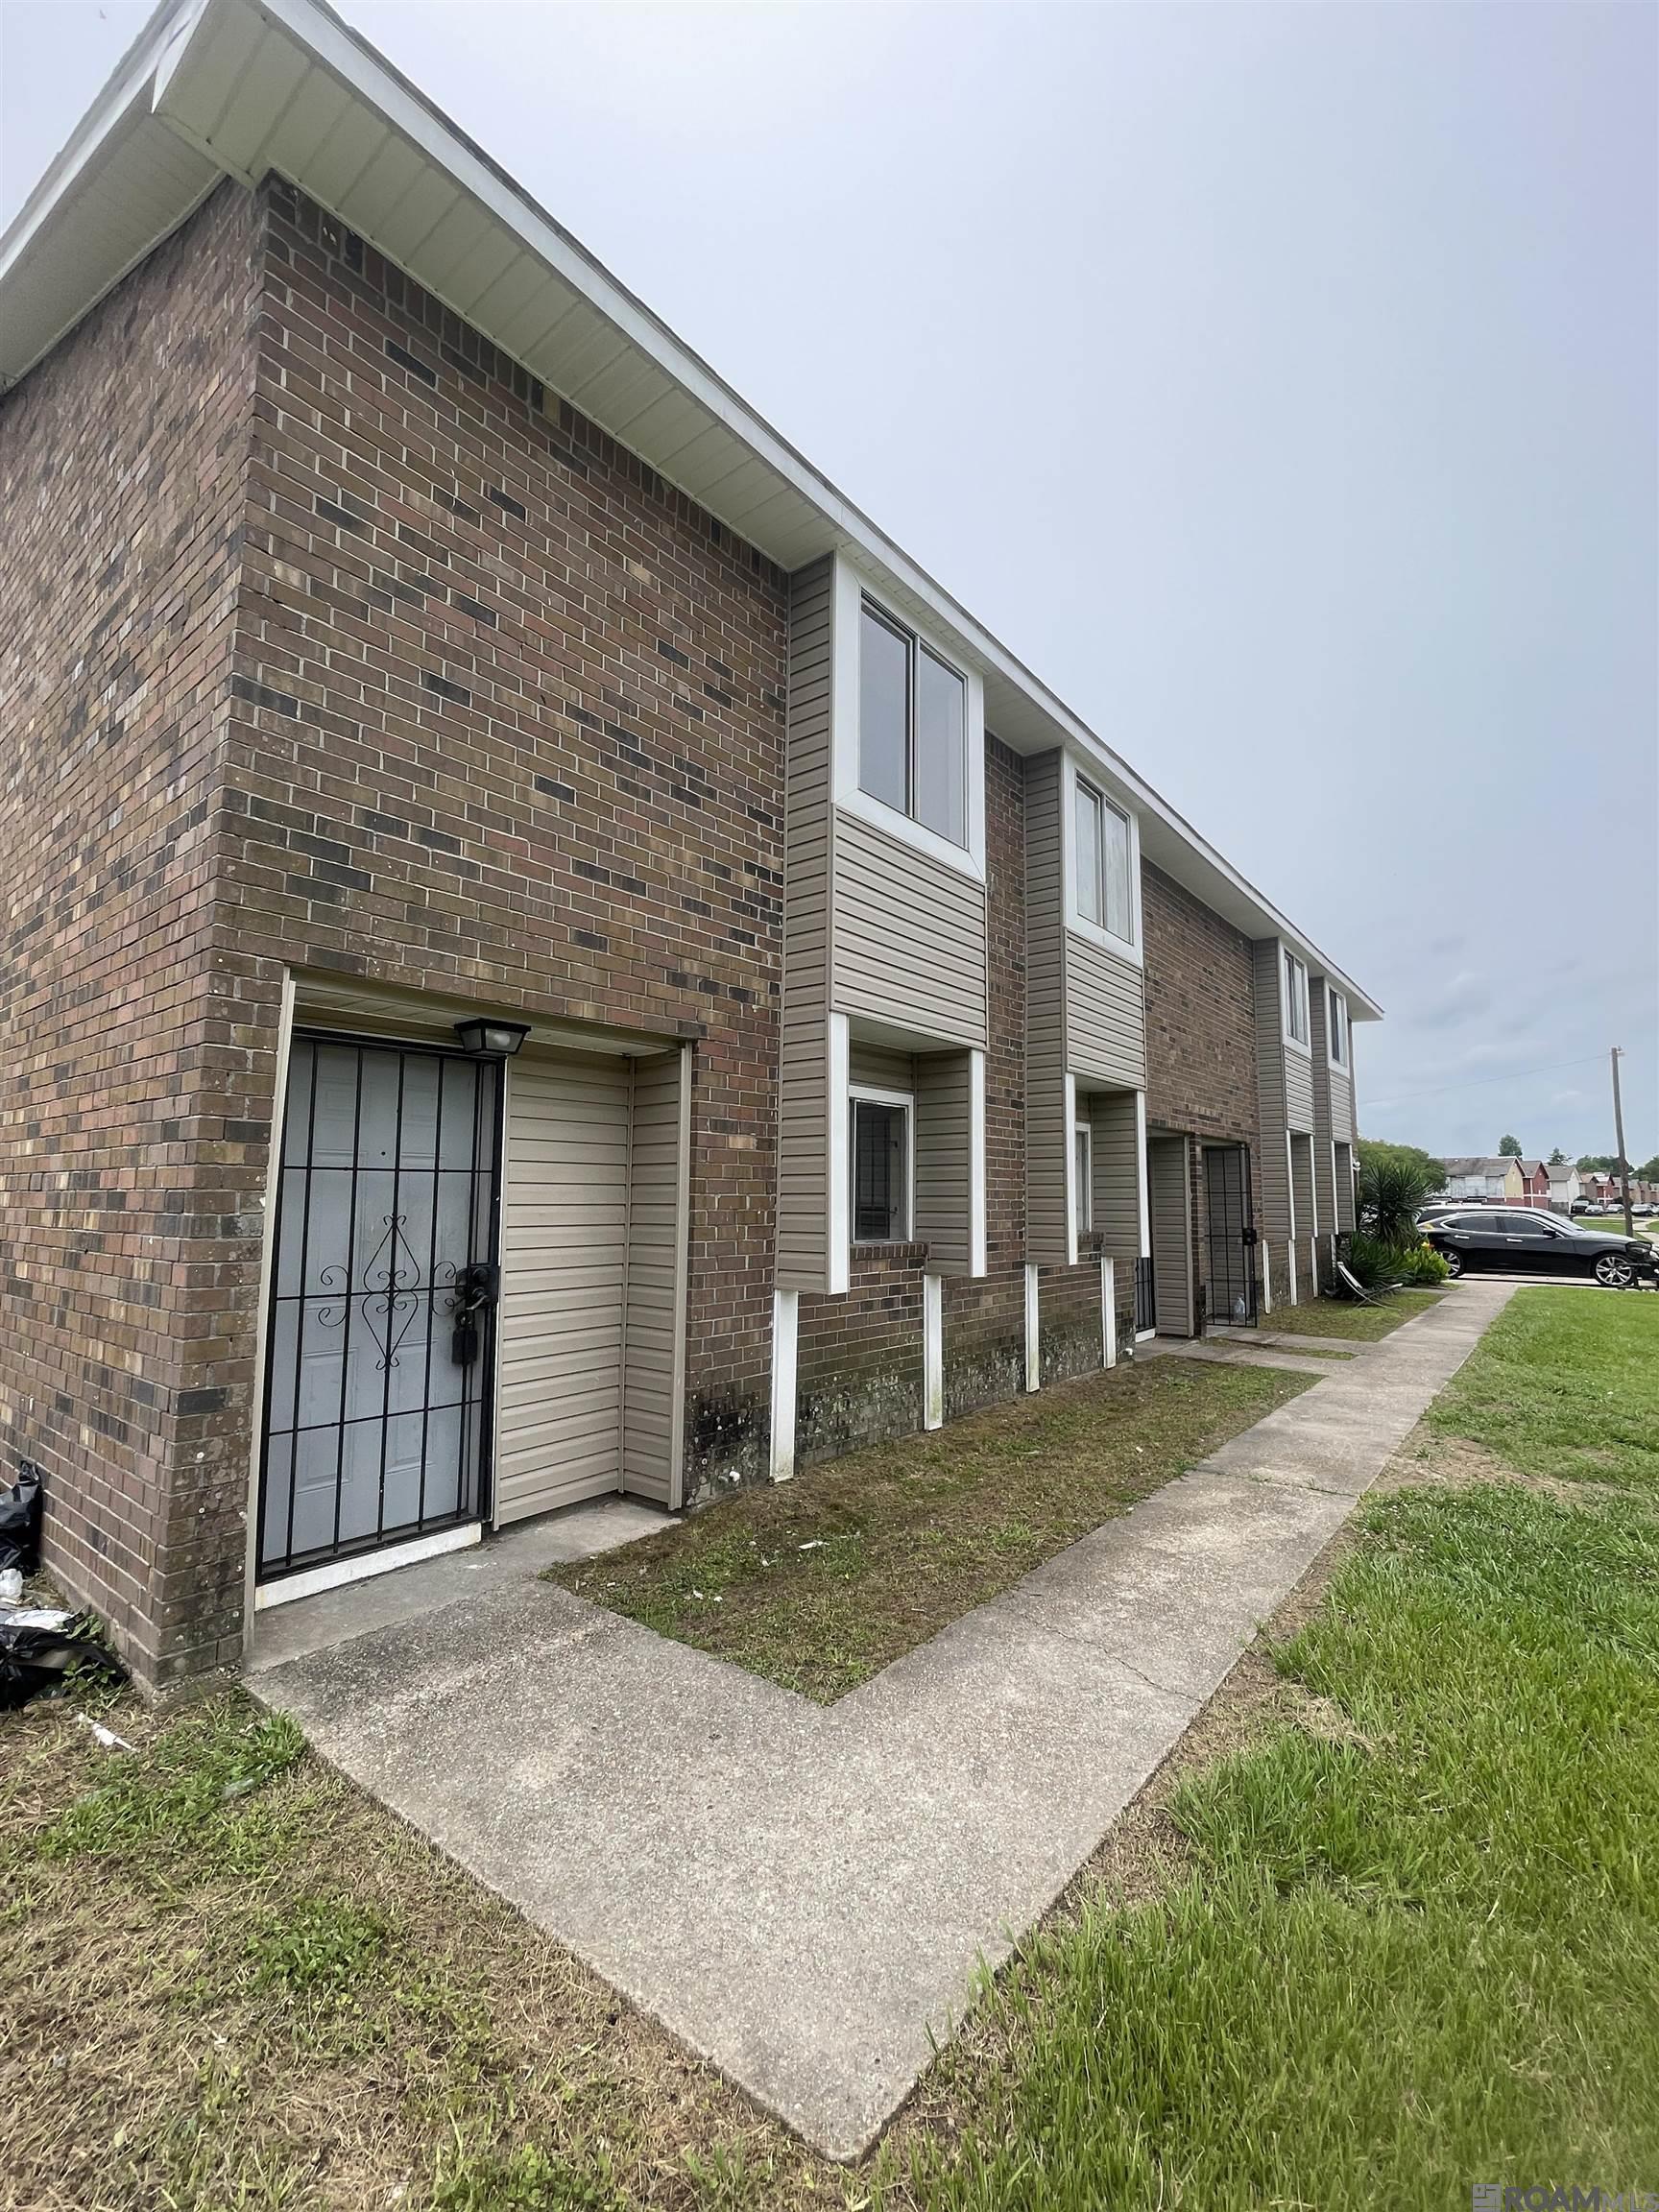
Active
$54,999
3
bds
|
1
ba
|
855
sqft
|
built
1974
10760 Kingfisher Ave, Baton Rouge, LA 70807
$621
Cash flow
13.2%
Cash-on-Cash Return
13.5%
Cap rate
1.6%
Rent to Value Ratio
Active
$90,000
3
bds
|
2
ba
|
1,341
sqft
|
built
1971
1650 N 32nd St, Baton Rouge, LA 70802
$333
Cash flow
19.3%
Cash-on-Cash Return
10.1%
Cap rate
1.2%
Rent to Value Ratio
Active
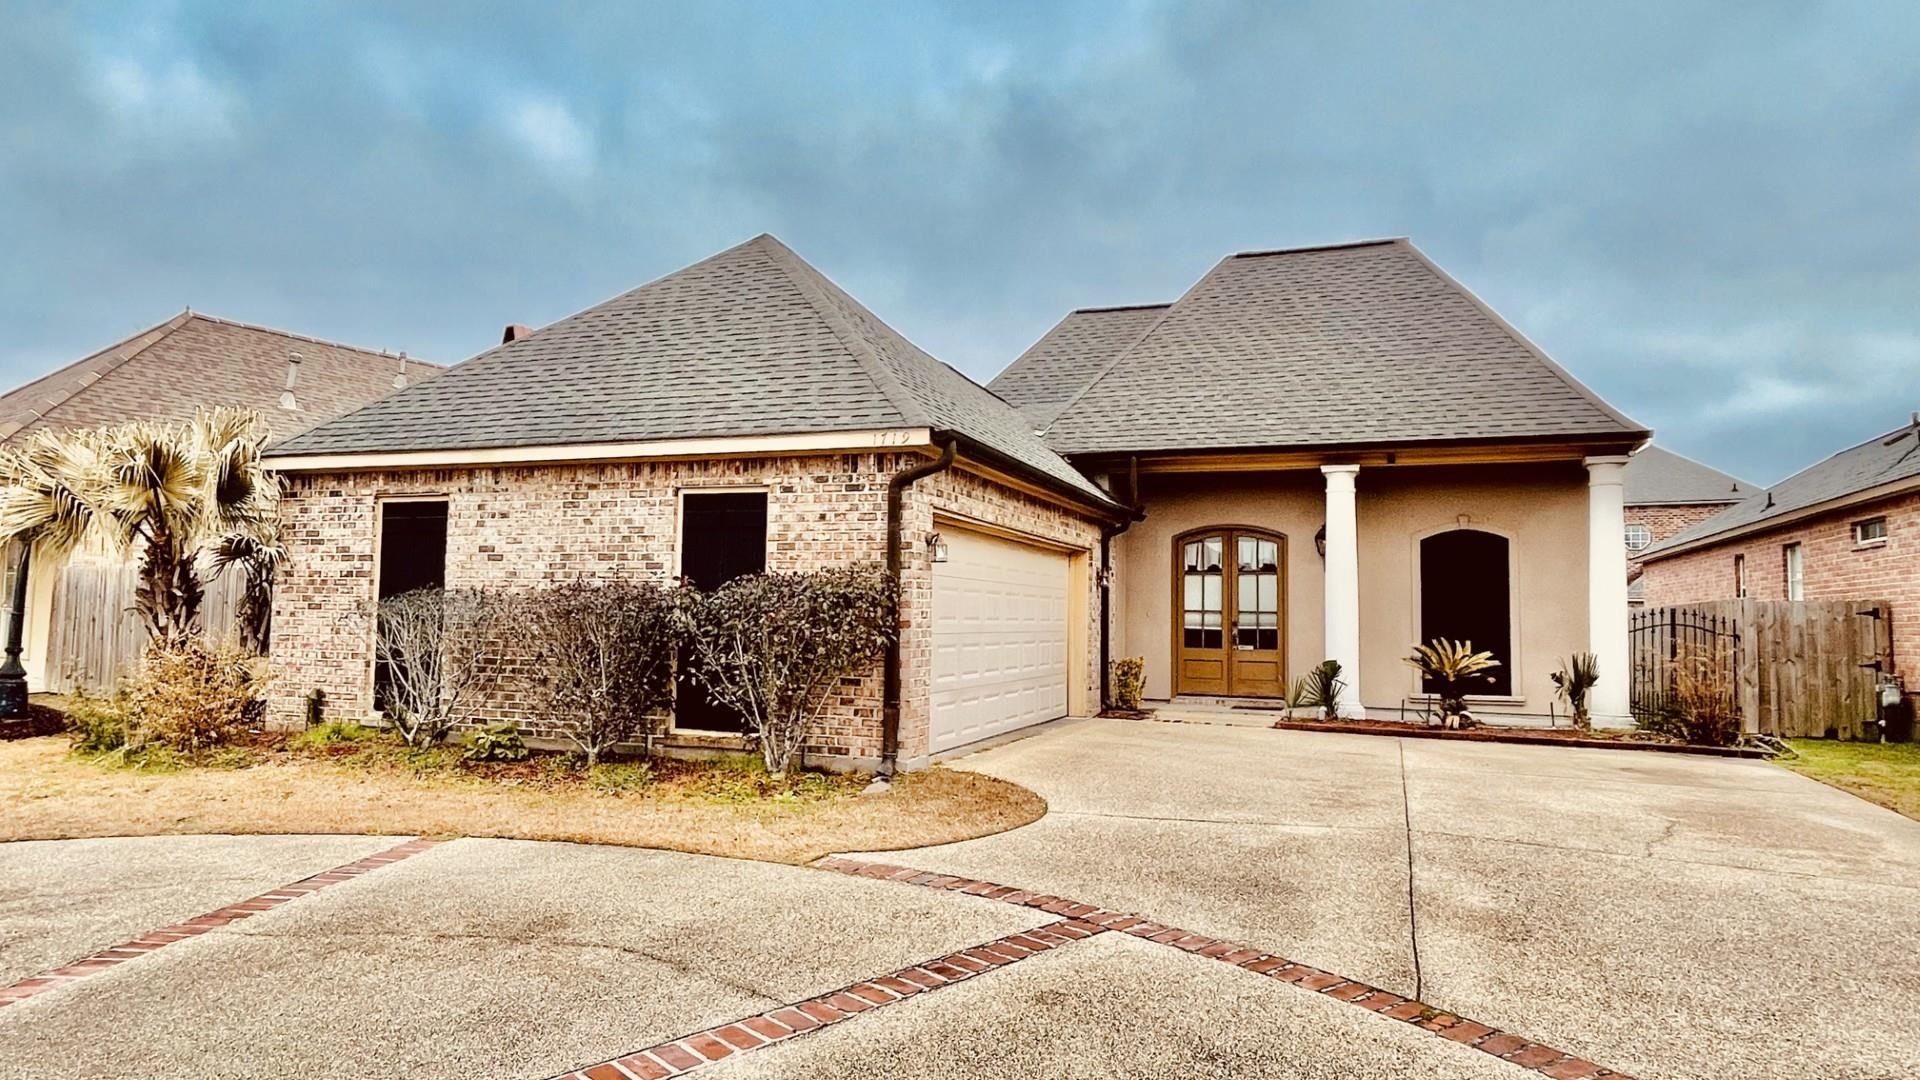
$259,900
3
bds
|
2
ba
|
2,185
sqft
|
built
2004
1719 Fox Croft Blvd, Baton Rouge, LA 70815
$129
Cash flow
2.6%
Cash-on-Cash Return
6.3%
Cap rate
0.8%
Rent to Value Ratio
Active
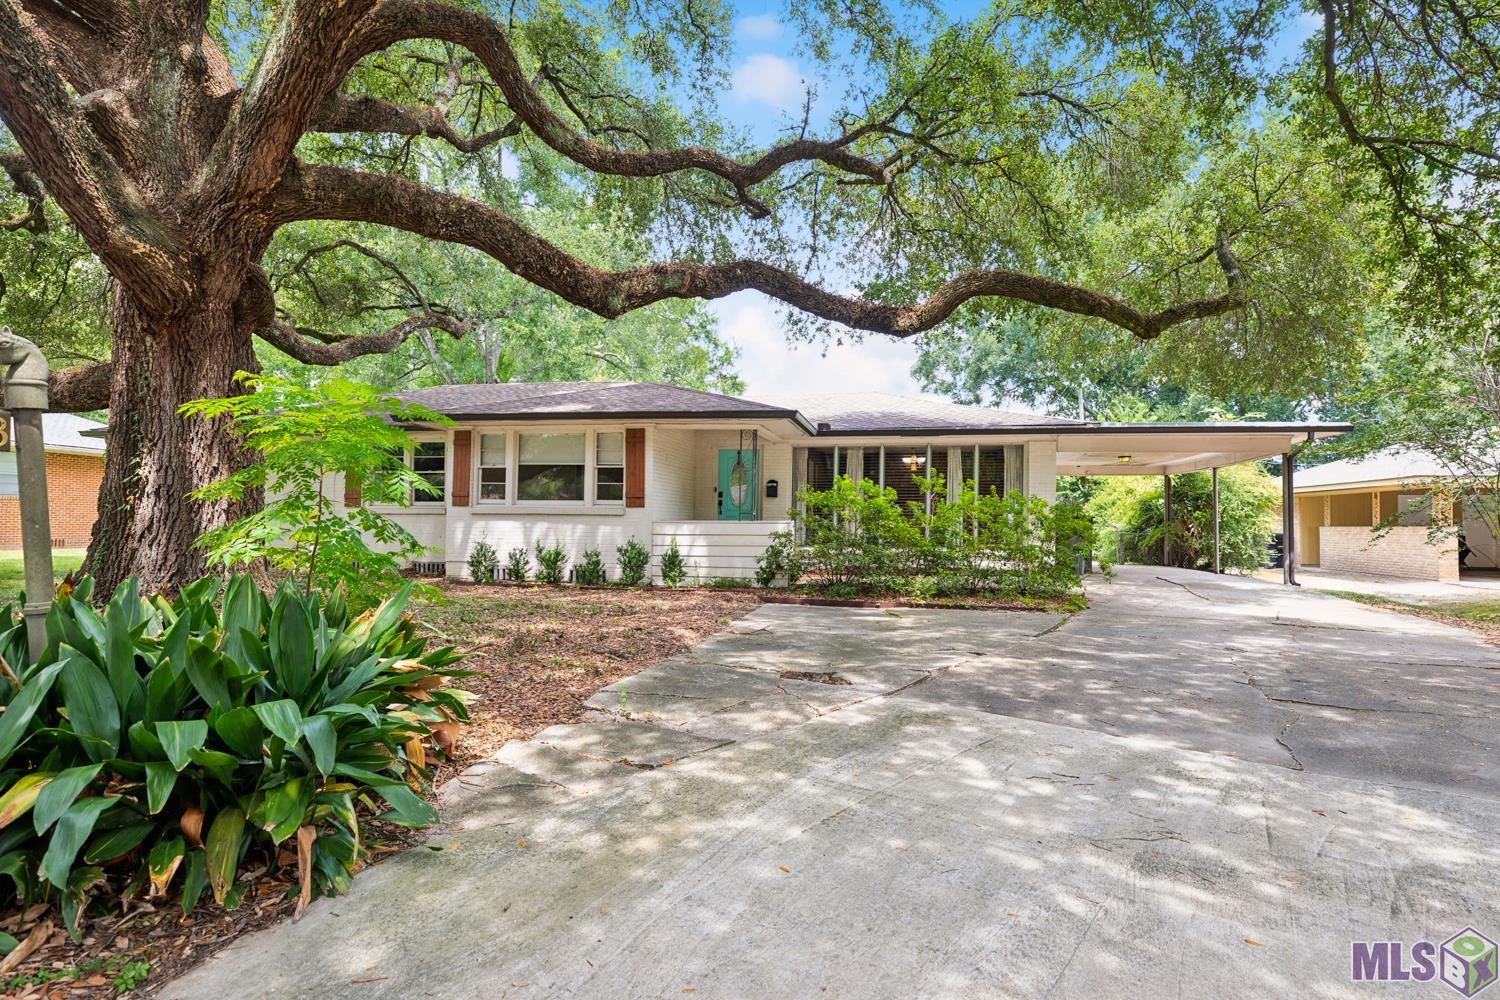
$214,900
3
bds
|
2
ba
|
2,379
sqft
|
built
1955
9653 Mollylea Dr, Baton Rouge, LA 70815
$501
Cash flow
12.2%
Cash-on-Cash Return
8.5%
Cap rate
1.0%
Rent to Value Ratio
Pending
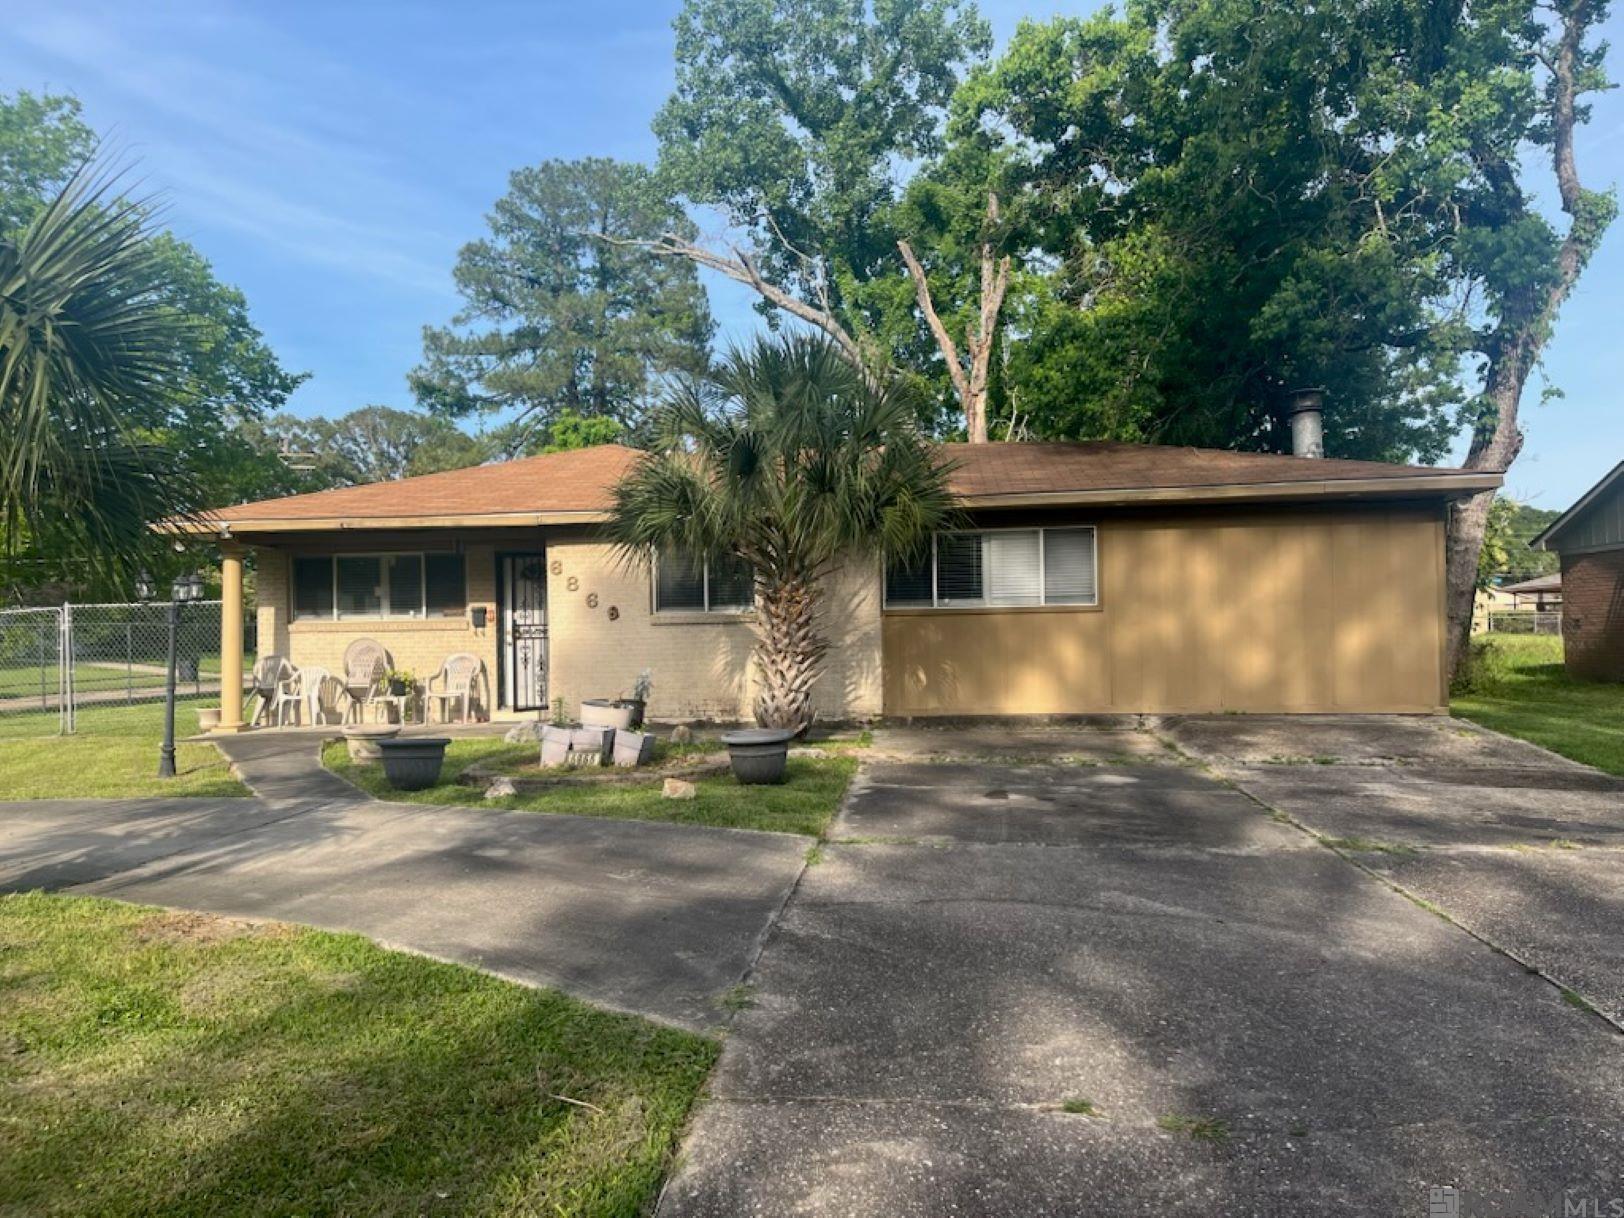
$135,000
3
bds
|
2
ba
|
1,445
sqft
|
built
1970
6866 Buttonwood Dr, Baton Rouge, LA 70812
$465
Cash flow
18.0%
Cash-on-Cash Return
9.8%
Cap rate
1.2%
Rent to Value Ratio

Active
$335,000
3
bds
|
2
ba
|
1,783
sqft
|
built
1994
1179 Springlake Dr, Baton Rouge, LA 70810
$-96
Cash flow
-1.5%
Cash-on-Cash Return
5.3%
Cap rate
0.7%
Rent to Value Ratio
Active
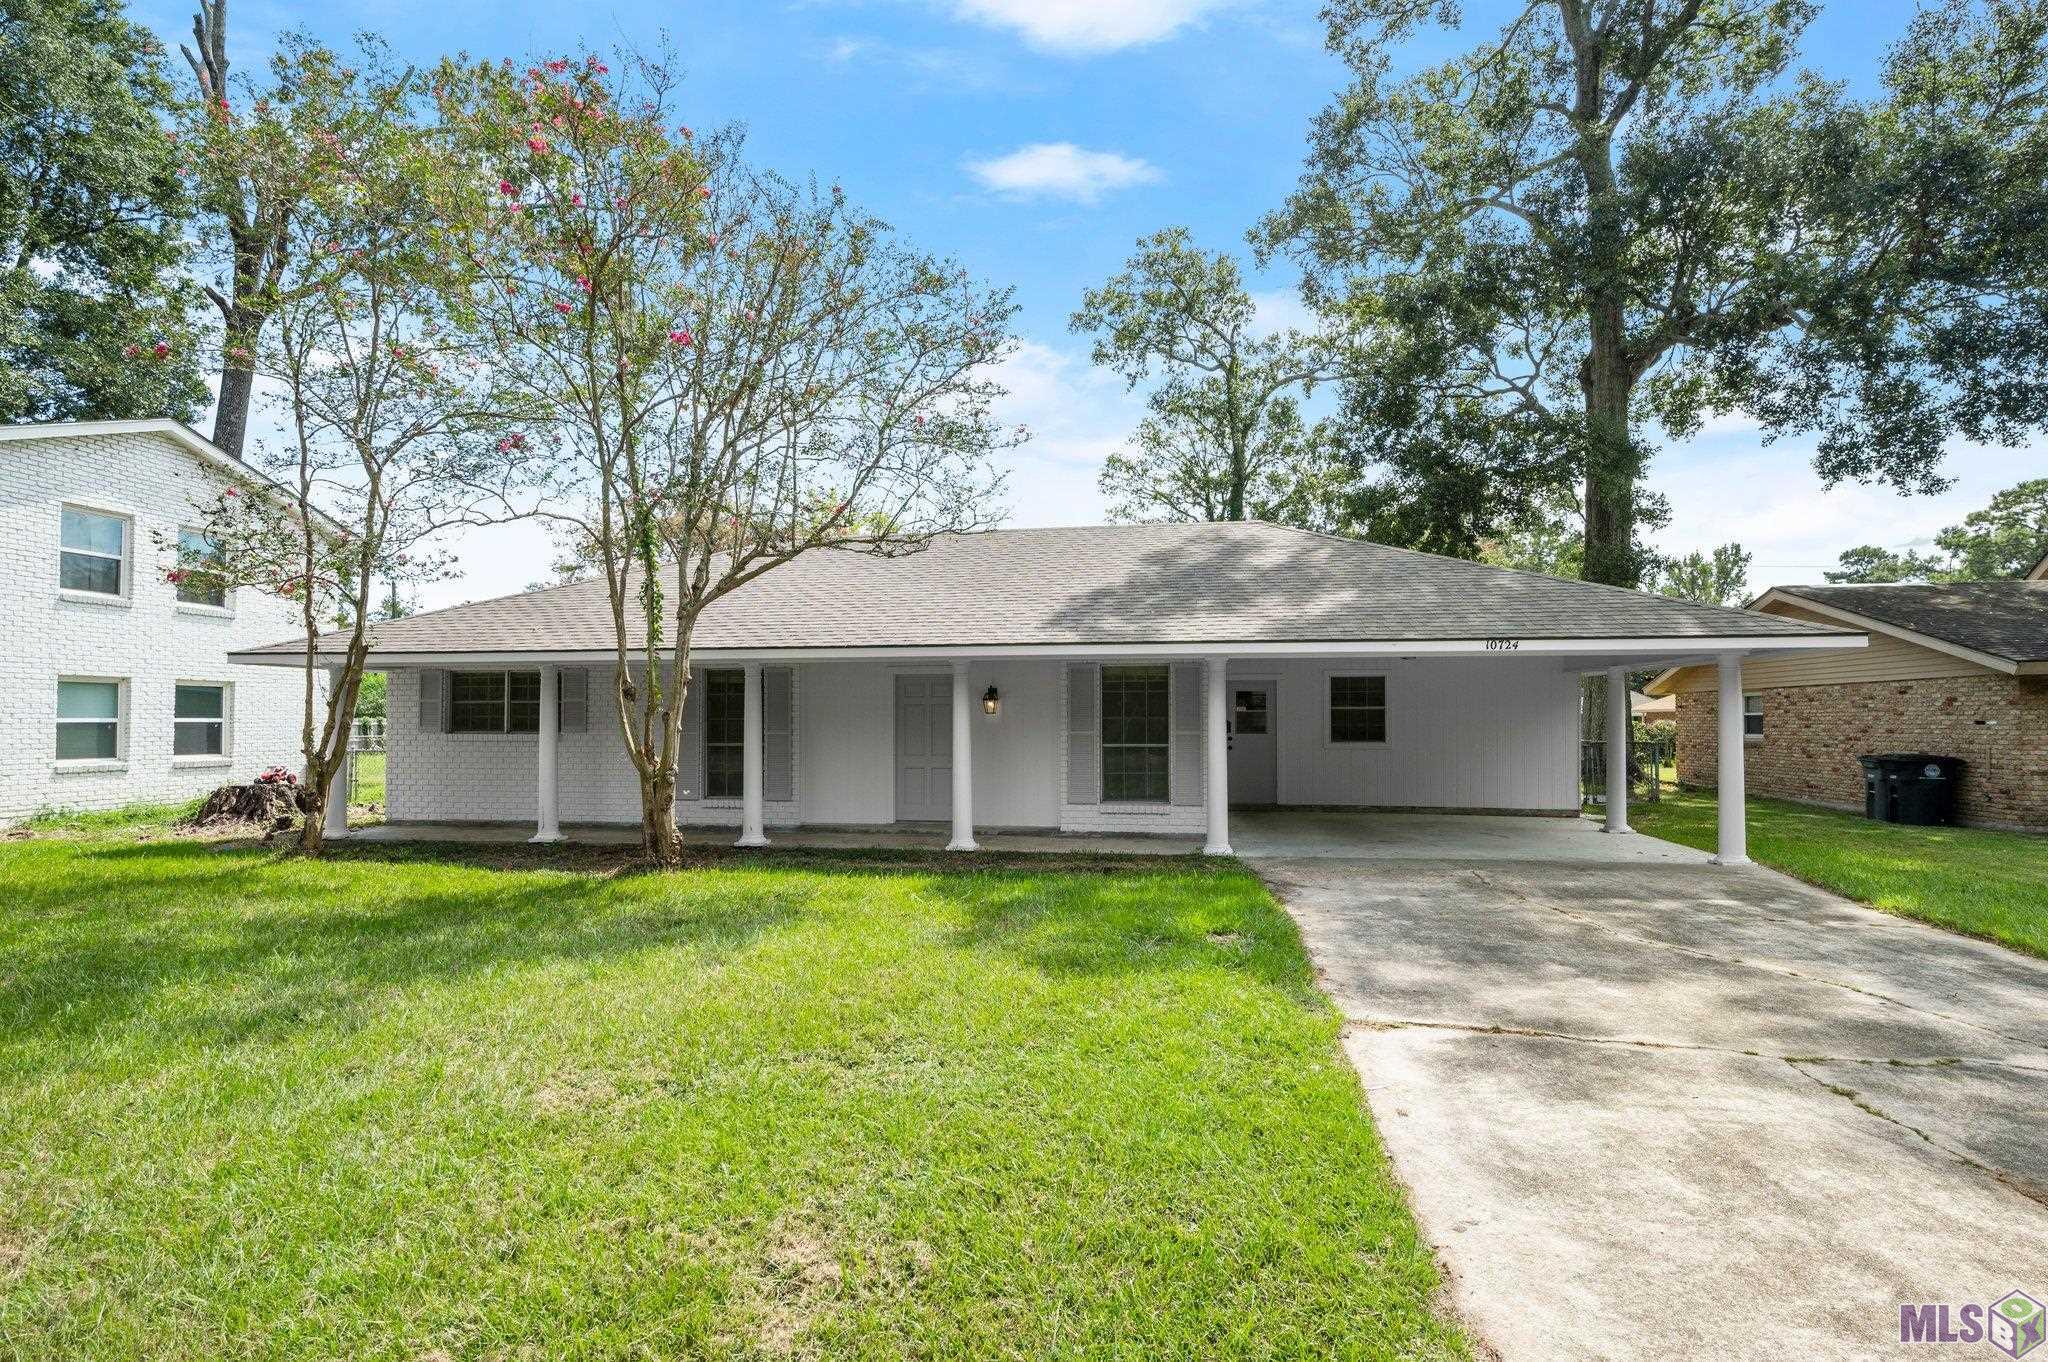
$224,800
3
bds
|
2
ba
|
1,406
sqft
|
built
1964
10724 Mollylea Dr, Baton Rouge, LA 70815
$178
Cash flow
4.1%
Cash-on-Cash Return
6.6%
Cap rate
0.8%
Rent to Value Ratio
Active
$175,000
3
bds
|
2
ba
|
1,432
sqft
|
built
1985
3660 Joor Rd, Baton Rouge, LA 70814
$69
Cash flow
2.1%
Cash-on-Cash Return
6.2%
Cap rate
0.7%
Rent to Value Ratio
Active
$345,000
3
bds
|
2
ba
|
1,932
sqft
|
built
1979
5550 Berkshire Ave, Baton Rouge, LA 70806
$92
Cash flow
1.4%
Cash-on-Cash Return
6.0%
Cap rate
0.7%
Rent to Value Ratio