Baton Rouge, LA Investment Properties for Sale
Browse homes for sale and investment properties in Baton Rouge, LA. Refine your search by price, property type, or more.
Best cash flowing properties in Baton Rouge, LA

Active
$22,000
2
bds
|
1
ba
|
920
sqft
|
built
1975
1354 N 38th St, Baton Rouge, LA 70802
$552
Cash flow
29.2%
Cash-on-Cash Return
30.1%
Cap rate
3.6%
Rent to Value Ratio
Active
$85,000
3
bds
|
1
ba
|
1,561
sqft
|
built
1960
2878 Sherwood St, Baton Rouge, LA 70805
$495
Cash flow
30.4%
Cash-on-Cash Return
12.7%
Cap rate
1.5%
Rent to Value Ratio
997 out of 1,285 properties for sale in Baton Rouge, LA
Limited Results Shown
Create a free account, or log in to reveal all property listings and enjoy the complete experience.
Active
$137,900
3
bds
|
2
ba
|
1,949
sqft
|
built
1970
211 Lakecrest Ave, Baton Rouge, LA 70807
$313
Cash flow
11.8%
Cash-on-Cash Return
8.4%
Cap rate
1.0%
Rent to Value Ratio
Active
$88,900
4
bds
|
2
ba
|
1,677
sqft
|
built
1976
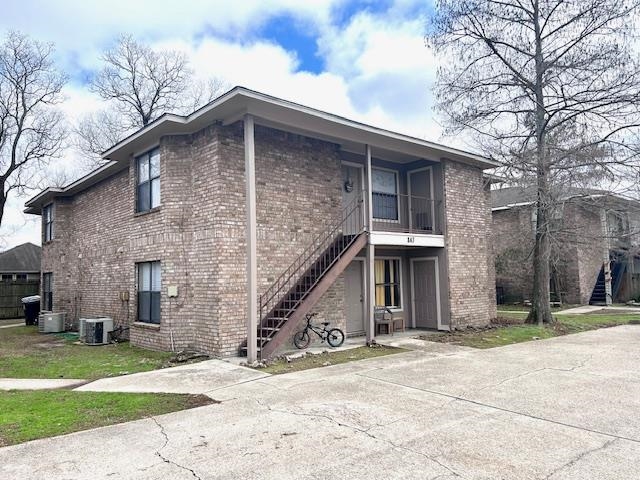
1438 N 43rd St, Baton Rouge, LA 70802
$407
Cash flow
23.9%
Cash-on-Cash Return
11.2%
Cap rate
1.3%
Rent to Value Ratio
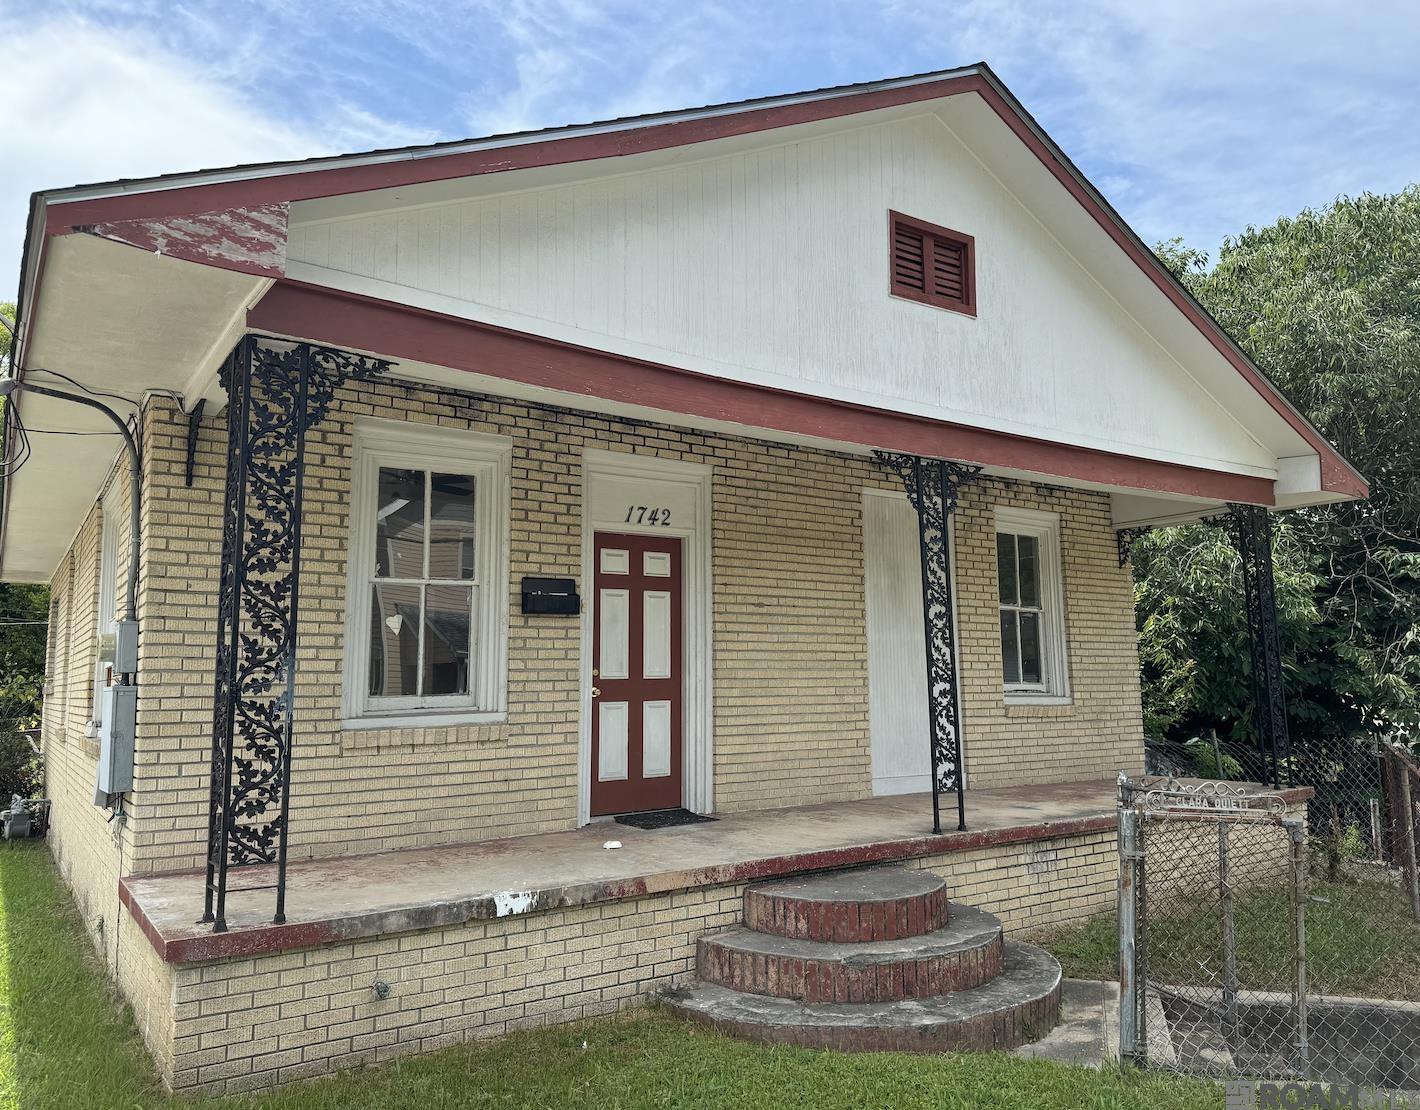
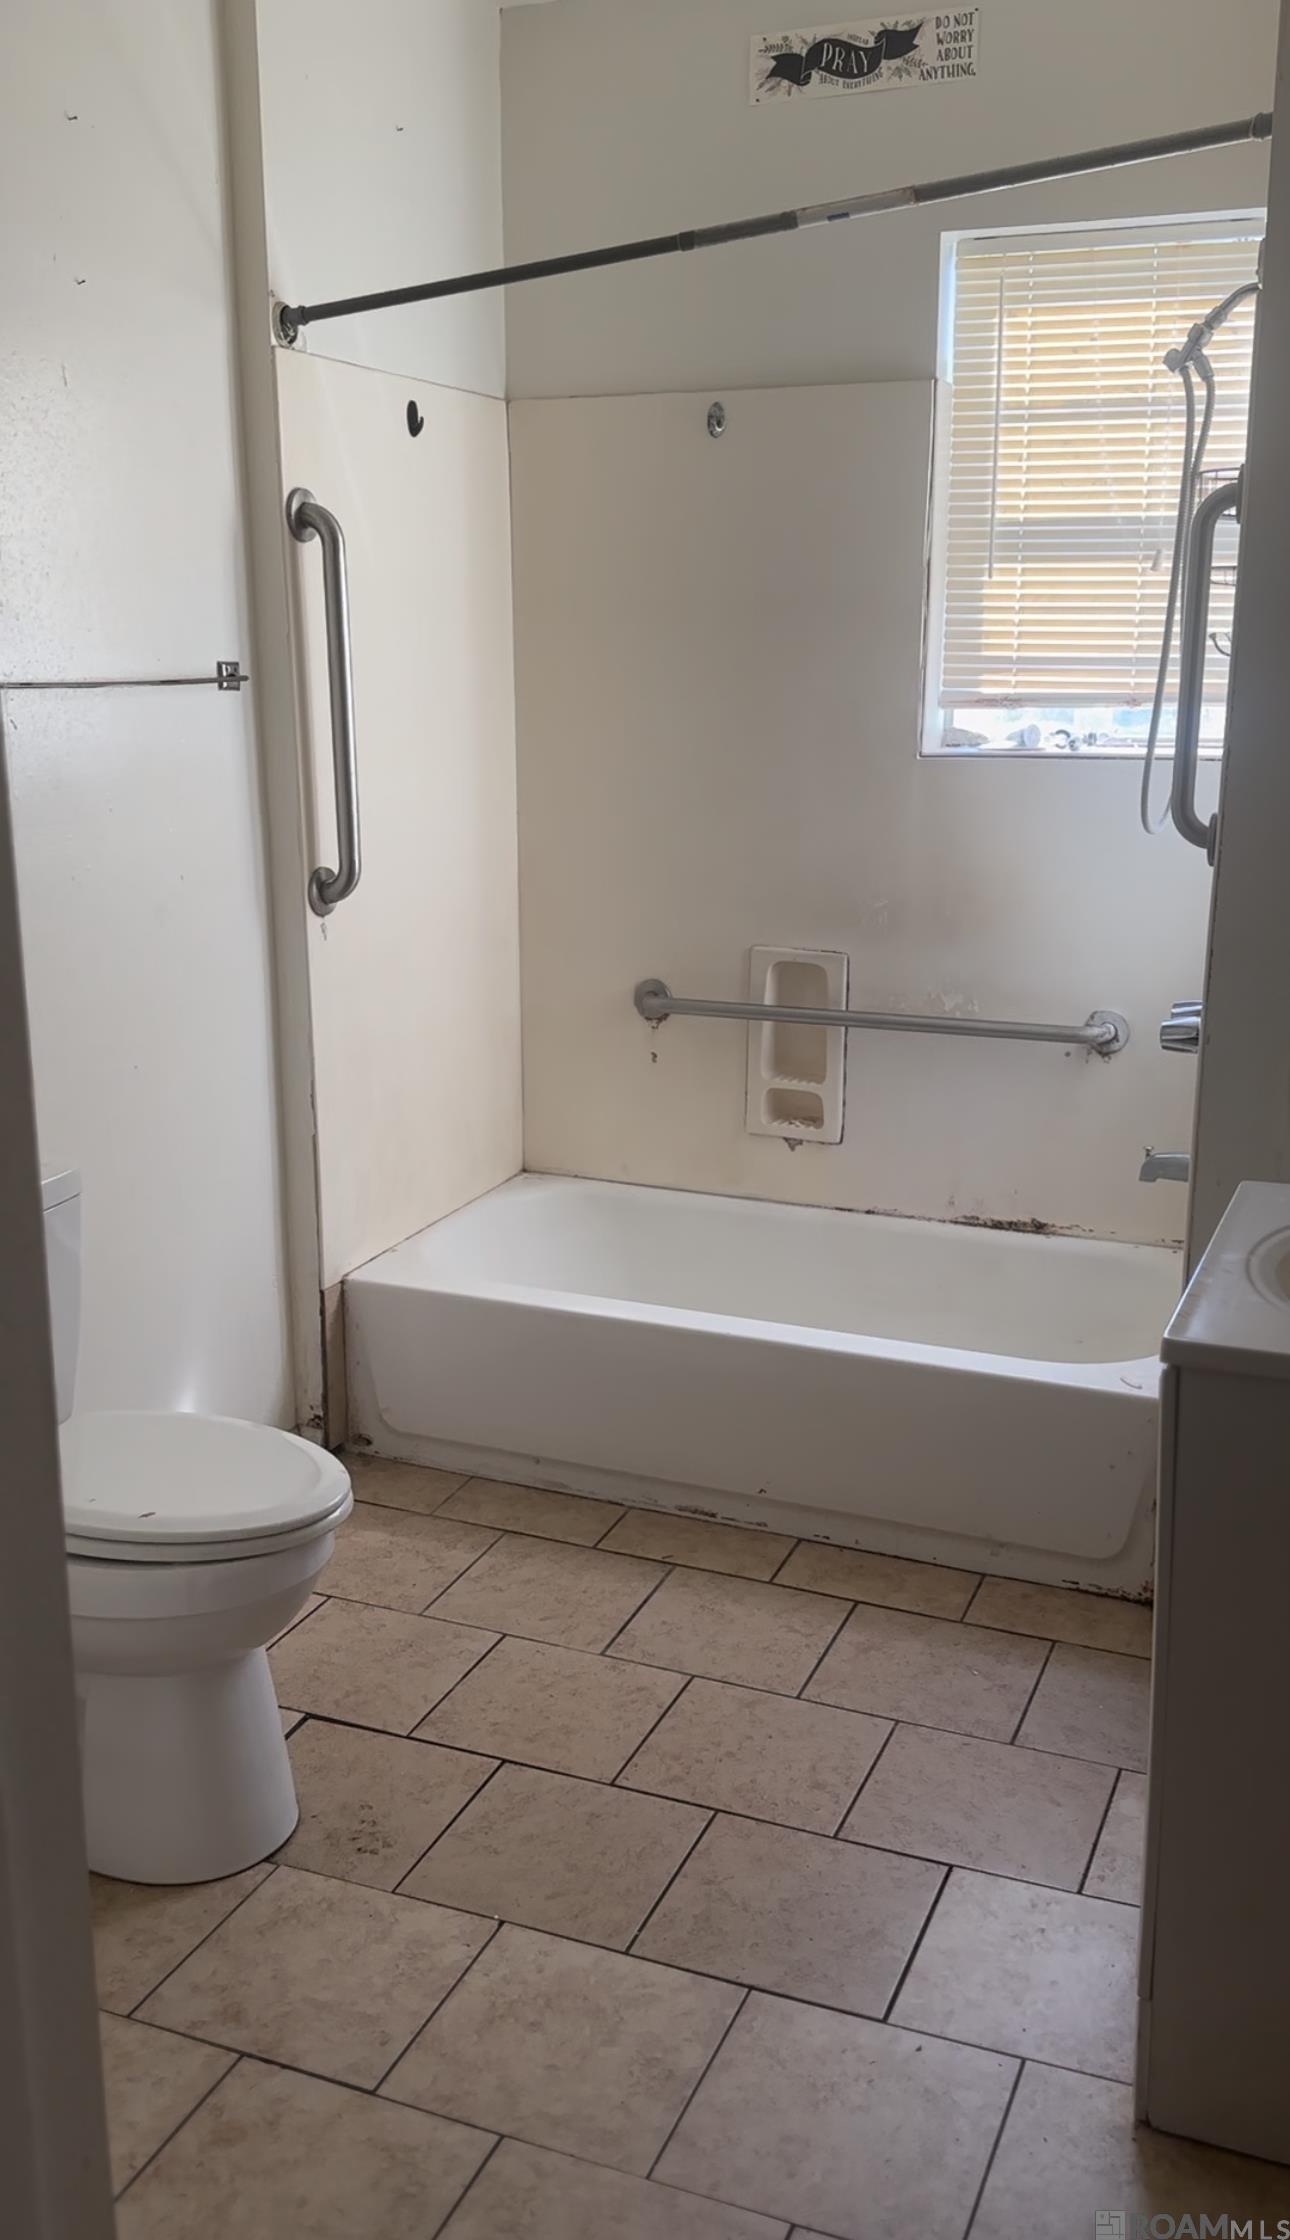
Active
$80,000
3
bds
|
1
ba
|
1,071
sqft
|
built
1946
1742 Napoleon St, Baton Rouge, LA 70802
$311
Cash flow
20.3%
Cash-on-Cash Return
10.4%
Cap rate
1.3%
Rent to Value Ratio
Active
$900,000
6
bds
|
5
ba
|
4,481
sqft
|
built
2003
3258 Mc Clendon Ct, Baton Rouge, LA 70810
$-1,683
Cash flow
-9.8%
Cash-on-Cash Return
3.4%
Cap rate
0.4%
Rent to Value Ratio

Active
$630,000
5
bds
|
4
ba
|
4,051
sqft
|
built
1986
1758 Applewood Rd, Baton Rouge, LA 70808
$-125
Cash flow
-1.0%
Cash-on-Cash Return
5.4%
Cap rate
0.7%
Rent to Value Ratio

Active
$399,000
2
bds
|
2
ba
|
2,372
sqft
|
built
1978
3920 Drusilla Dr, Baton Rouge, LA 70809
$-163
Cash flow
-2.1%
Cash-on-Cash Return
5.2%
Cap rate
0.6%
Rent to Value Ratio

Active
$1,100,000
4
bds
|
2
ba
|
2,017
sqft
|
built
1959
6225 Boone Ave, Baton Rouge, LA 70808
$-3,622
Cash flow
-17.2%
Cash-on-Cash Return
1.7%
Cap rate
0.2%
Rent to Value Ratio

Active
$287,500
2
bds
|
1
ba
|
1,050
sqft
|
built
1939
635 Hebert St, Baton Rouge, LA 70806
$-602
Cash flow
-10.9%
Cash-on-Cash Return
3.2%
Cap rate
0.4%
Rent to Value Ratio
Active
$530,000
3
bds
|
2
ba
|
2,557
sqft
|
built
1987
1350 Pickett Ave, Baton Rouge, LA 70808
$-645
Cash flow
-6.3%
Cash-on-Cash Return
4.2%
Cap rate
0.5%
Rent to Value Ratio

Active
$719,900
4
bds
|
5
ba
|
4,880
sqft
|
built
1977
12326 Lake Sherwood Ave S, Baton Rouge, LA 70816
$-1,311
Cash flow
-9.5%
Cash-on-Cash Return
3.5%
Cap rate
0.4%
Rent to Value Ratio

Active
$429,900
4
bds
|
3
ba
|
2,114
sqft
|
built
1950
4013 Hyacinth Ave, Baton Rouge, LA 70808
$-322
Cash flow
-3.9%
Cash-on-Cash Return
4.8%
Cap rate
0.6%
Rent to Value Ratio
Active
$650,000
4
bds
|
3
ba
|
2,884
sqft
|
built
2008
13652 Kings Court Ave, Baton Rouge, LA 70810
$-1,012
Cash flow
-8.1%
Cash-on-Cash Return
3.8%
Cap rate
0.5%
Rent to Value Ratio

Active
$785,000
4
bds
|
3
ba
|
3,303
sqft
|
built
1980
8311 Oakbrook Dr, Baton Rouge, LA 70810
$-794
Cash flow
-5.3%
Cash-on-Cash Return
4.5%
Cap rate
0.5%
Rent to Value Ratio
Active
$2,735,000
5
bds
|
6
ba
|
6,686
sqft
|
built
2019
16212 Highland Rd, Baton Rouge, LA 70810
$-6,802
Cash flow
-13.0%
Cash-on-Cash Return
2.7%
Cap rate
0.3%
Rent to Value Ratio
Active
$499,900
3
bds
|
4
ba
|
2,460
sqft
|
built
1980
868 Maxine Dr, Baton Rouge, LA 70808
$-231
Cash flow
-2.4%
Cash-on-Cash Return
5.1%
Cap rate
0.6%
Rent to Value Ratio

Active
$309,999
2
bds
|
1
ba
|
1,457
sqft
|
built
1956
1958 Christian St, Baton Rouge, LA 70808
$-87
Cash flow
-1.5%
Cash-on-Cash Return
5.3%
Cap rate
0.6%
Rent to Value Ratio

Active
$750,000
4
bds
|
4
ba
|
3,067
sqft
|
built
2009
4268 Arrowhead St, Baton Rouge, LA 70808
$-444
Cash flow
-3.1%
Cash-on-Cash Return
5.0%
Cap rate
0.6%
Rent to Value Ratio
Active
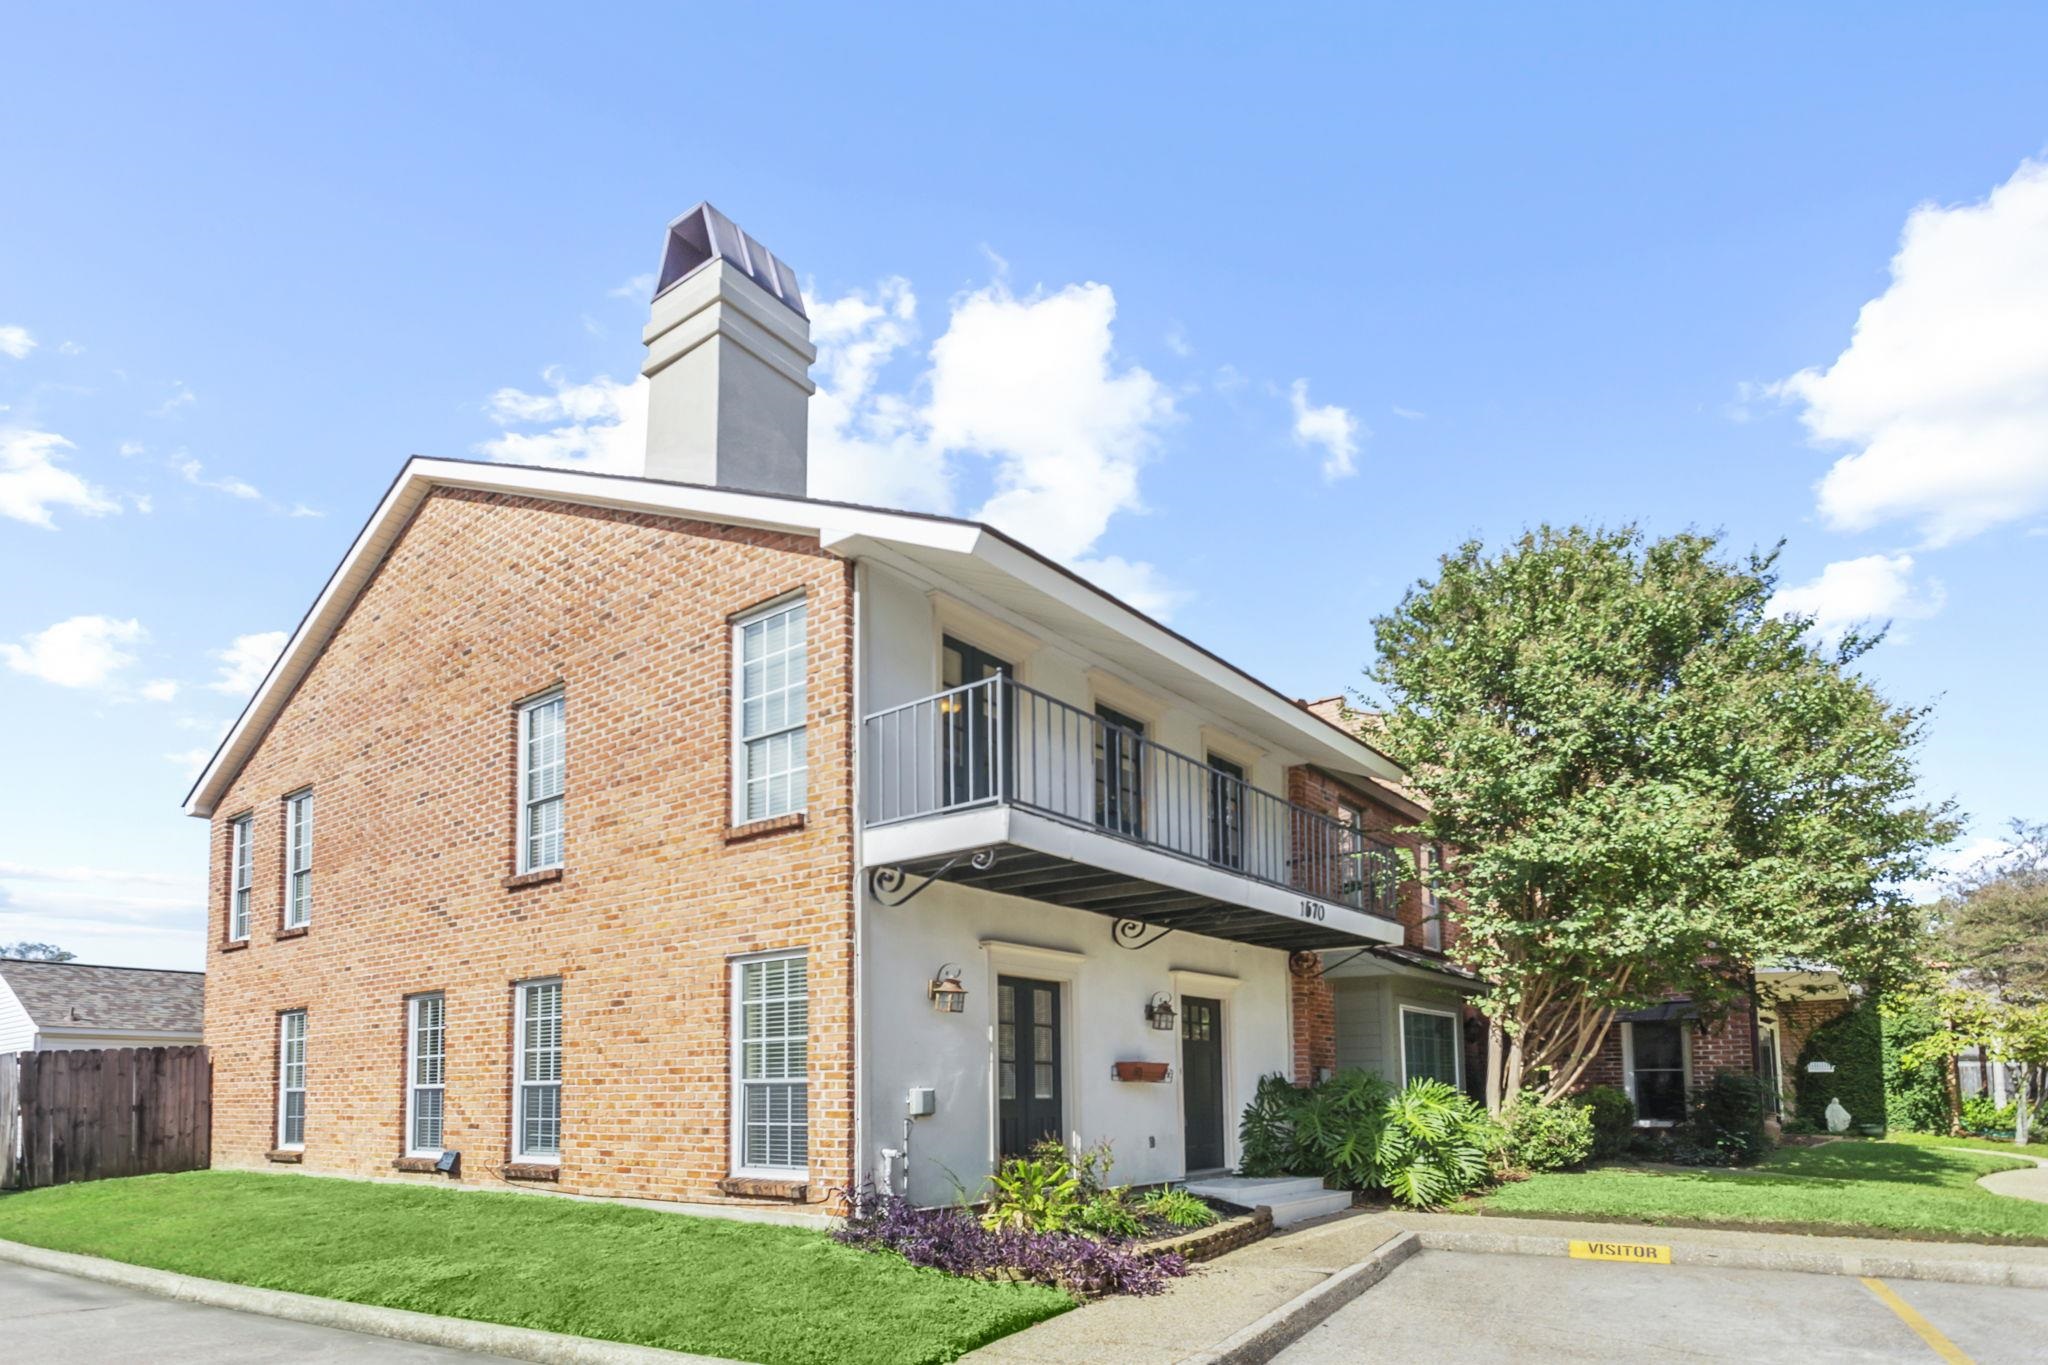
$330,000
2
bds
|
3
ba
|
1,584
sqft
|
built
1984
1570 Lobdell Ave, Baton Rouge, LA 70806
$-194
Cash flow
-3.1%
Cash-on-Cash Return
5.0%
Cap rate
0.7%
Rent to Value Ratio
Active
$415,000
3
bds
|
3
ba
|
2,179
sqft
|
built
2011
13322 Quail Grove Ave, Baton Rouge, LA 70809
$-264
Cash flow
-3.3%
Cash-on-Cash Return
4.9%
Cap rate
0.6%
Rent to Value Ratio
Active
$496,000
3
bds
|
2
ba
|
2,439
sqft
|
built
2006
19405 Kelly Wood Ct, Baton Rouge, LA 70809
$-667
Cash flow
-7.0%
Cash-on-Cash Return
4.1%
Cap rate
0.5%
Rent to Value Ratio
Active
$514,500
4
bds
|
3
ba
|
2,733
sqft
|
built
2013
14708 Winter Oak Ave, Baton Rouge, LA 70810
$-1,482
Cash flow
-15.0%
Cash-on-Cash Return
2.2%
Cap rate
0.3%
Rent to Value Ratio

Active
$749,000
4
bds
|
4
ba
|
4,452
sqft
|
built
1910
540 Drehr Ave, Baton Rouge, LA 70806
$-1,957
Cash flow
-13.6%
Cash-on-Cash Return
2.5%
Cap rate
0.3%
Rent to Value Ratio

Active
$379,000
3
bds
|
2
ba
|
2,160
sqft
|
built
2004
11015 N Shoreline Ave, Baton Rouge, LA 70809
$-102
Cash flow
-1.4%
Cash-on-Cash Return
5.4%
Cap rate
0.7%
Rent to Value Ratio
Active
$750,000
4
bds
|
3
ba
|
3,407
sqft
|
built
2005
15412 Campanile Ct, Baton Rouge, LA 70810
$-523
Cash flow
-3.6%
Cash-on-Cash Return
4.8%
Cap rate
0.6%
Rent to Value Ratio

Active
$359,000
3
bds
|
2
ba
|
2,040
sqft
|
built
1977
1534 Stoneliegh Dr, Baton Rouge, LA 70808
$-181
Cash flow
-2.6%
Cash-on-Cash Return
5.1%
Cap rate
0.6%
Rent to Value Ratio

Active
$425,000
3
bds
|
3
ba
|
3,024
sqft
|
built
1980
8523 Briarwood Pl, Baton Rouge, LA 70809
$-424
Cash flow
-5.2%
Cash-on-Cash Return
4.5%
Cap rate
0.5%
Rent to Value Ratio

Active
$415,000
4
bds
|
3
ba
|
2,482
sqft
|
built
2007
437 Delgado Dr, Baton Rouge, LA 70808
$-36
Cash flow
-0.5%
Cash-on-Cash Return
5.6%
Cap rate
0.7%
Rent to Value Ratio
Active
$540,000
4
bds
|
3
ba
|
2,583
sqft
|
built
2000
2969 Laurel Plantation Ave, Baton Rouge, LA 70820
$-171
Cash flow
-1.7%
Cash-on-Cash Return
5.3%
Cap rate
0.6%
Rent to Value Ratio

Active
$1,695,000
4
bds
|
5
ba
|
4,619
sqft
|
built
2017
7313 Willow Grove Blvd, Baton Rouge, LA 70810
$-6,766
Cash flow
-20.8%
Cash-on-Cash Return
0.9%
Cap rate
0.1%
Rent to Value Ratio
Active
$300,000
3
bds
|
3
ba
|
1,521
sqft
|
built
2016
7131 Kodiak Dr, Baton Rouge, LA 70810
$-84
Cash flow
-1.5%
Cash-on-Cash Return
5.3%
Cap rate
0.7%
Rent to Value Ratio

Active
$500,000
3
bds
|
2
ba
|
1,883
sqft
|
built
1989
10013 Horseshoe Dr, Baton Rouge, LA 70817
$-1,124
Cash flow
-11.7%
Cash-on-Cash Return
3.0%
Cap rate
0.4%
Rent to Value Ratio

Active
$2,595,000
6
bds
|
6
ba
|
5,822
sqft
|
built
2017
2930 Svendson Dr, Baton Rouge, LA 70809
$-6,091
Cash flow
-12.2%
Cash-on-Cash Return
2.9%
Cap rate
0.3%
Rent to Value Ratio

Active
$1,035,000
4
bds
|
4
ba
|
3,576
sqft
|
built
2018
7515 Tilton Ct, Baton Rouge, LA 70806
$-1,046
Cash flow
-5.3%
Cash-on-Cash Return
4.5%
Cap rate
0.6%
Rent to Value Ratio

Active
$799,900
4
bds
|
4
ba
|
3,660
sqft
|
built
1993
17862 Five Oaks Dr, Baton Rouge, LA 70810
$-791
Cash flow
-5.2%
Cash-on-Cash Return
4.5%
Cap rate
0.6%
Rent to Value Ratio
Active
$384,000
bds
|
0
ba
|
3,800
sqft
|
built
1983
843 Hammond Manor Dr, Baton Rouge, LA 70816
$-92
Cash flow
-1.3%
Cash-on-Cash Return
5.4%
Cap rate
0.7%
Rent to Value Ratio

Active
$1,349,000
4
bds
|
4
ba
|
4,258
sqft
|
built
2009
12240 Myers Park Ave, Baton Rouge, LA 70810
$-4,108
Cash flow
-15.9%
Cash-on-Cash Return
2.0%
Cap rate
0.3%
Rent to Value Ratio
Active
$22,000
2
bds
|
1
ba
|
920
sqft
|
built
1975
1354 N 38th St, Baton Rouge, LA 70802
$552
Cash flow
29.2%
Cash-on-Cash Return
30.1%
Cap rate
3.6%
Rent to Value Ratio
Active
$85,000
3
bds
|
1
ba
|
1,561
sqft
|
built
1960
2878 Sherwood St, Baton Rouge, LA 70805
$495
Cash flow
30.4%
Cash-on-Cash Return
12.7%
Cap rate
1.5%
Rent to Value Ratio
Active
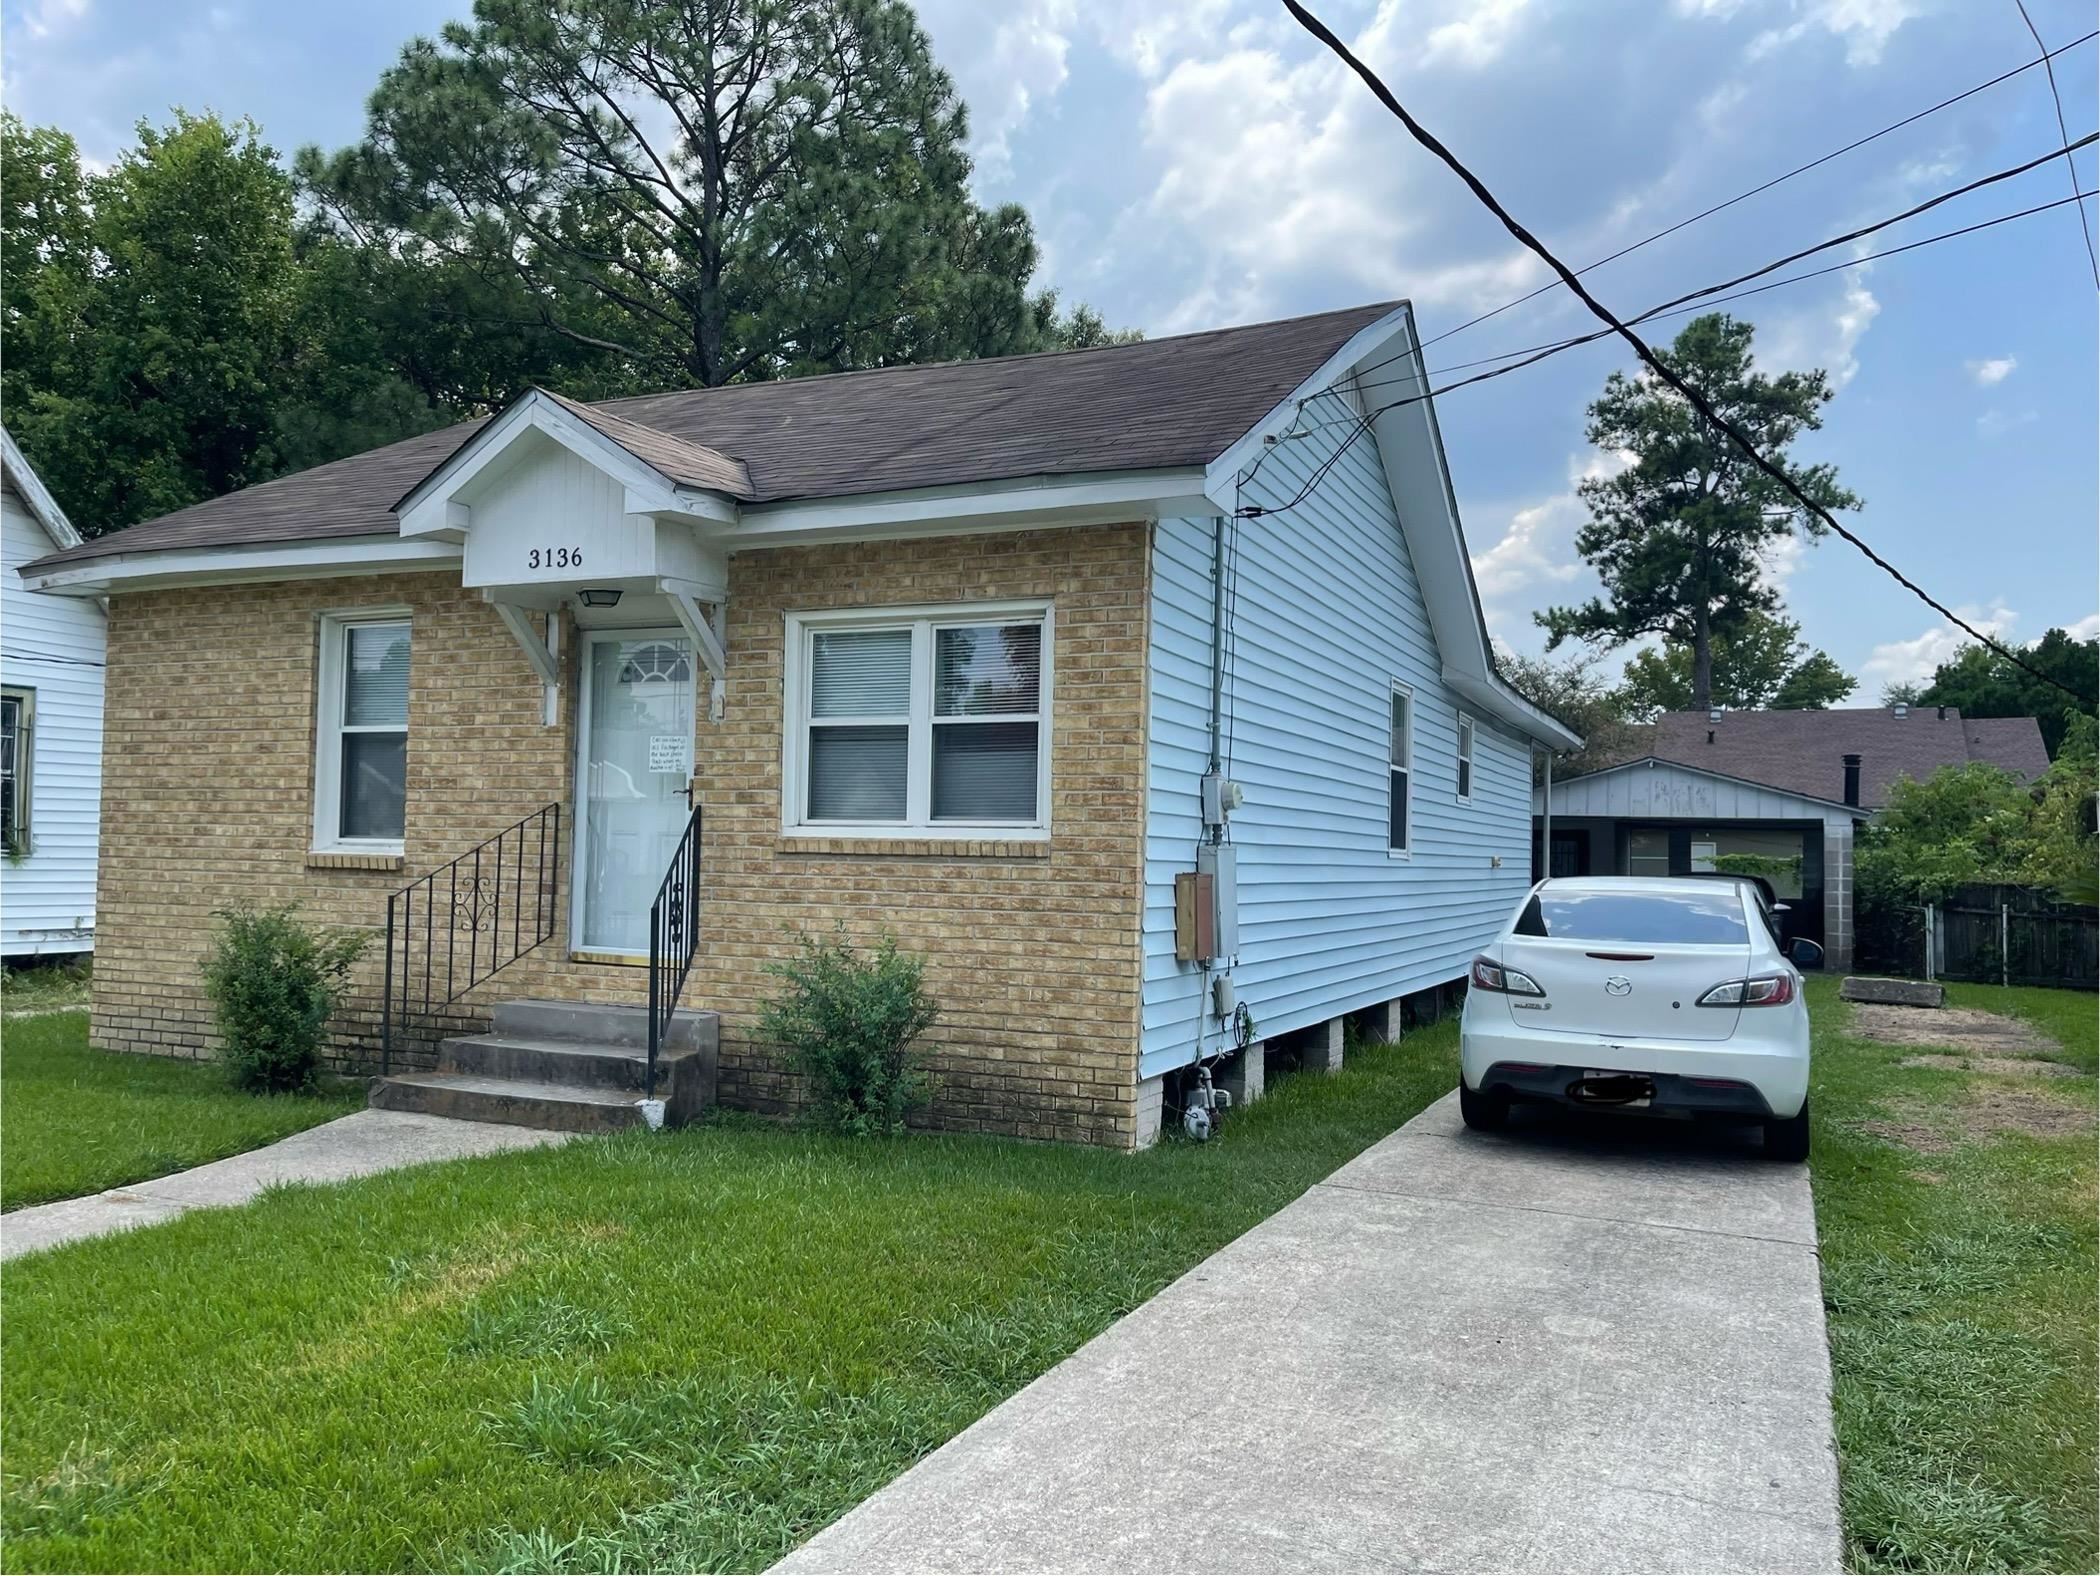
$97,500
3
bds
|
2
ba
|
1,100
sqft
|
built
1996
3136 Madison Ave, Baton Rouge, LA 70802
$229
Cash flow
12.3%
Cash-on-Cash Return
8.5%
Cap rate
1.0%
Rent to Value Ratio
Active
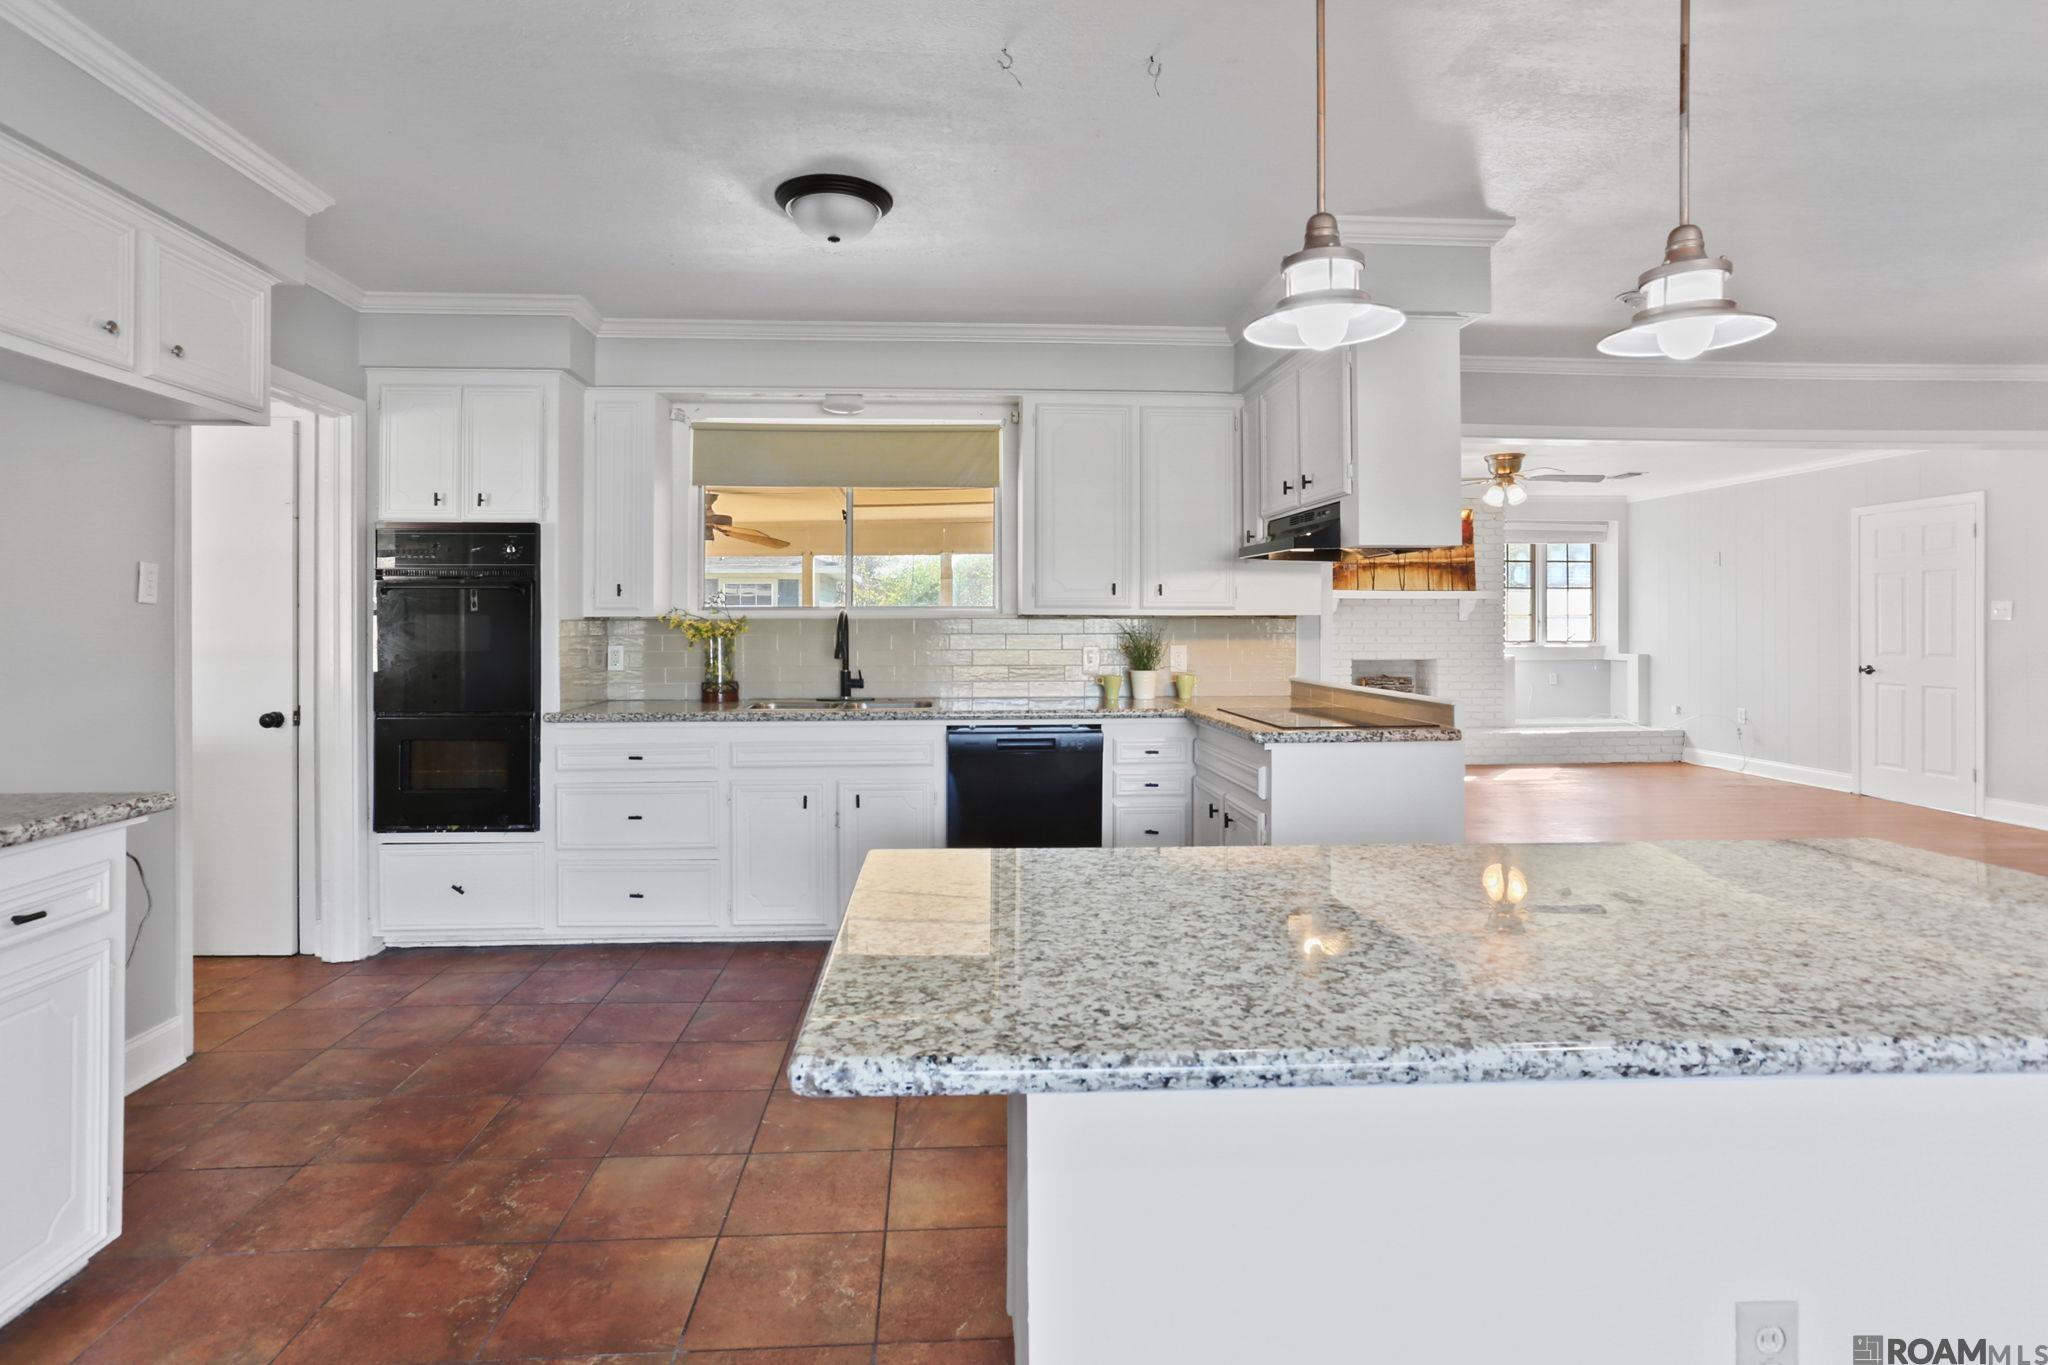
$245,000
4
bds
|
2
ba
|
2,343
sqft
|
built
1970
11622 Glenhaven Dr, Baton Rouge, LA 70815
$290
Cash flow
6.2%
Cash-on-Cash Return
7.1%
Cap rate
0.9%
Rent to Value Ratio