Baton Rouge, LA Investment Properties for Sale
Browse homes for sale and investment properties in Baton Rouge, LA. Refine your search by price, property type, or more.
Best cash flowing properties in Baton Rouge, LA
Active
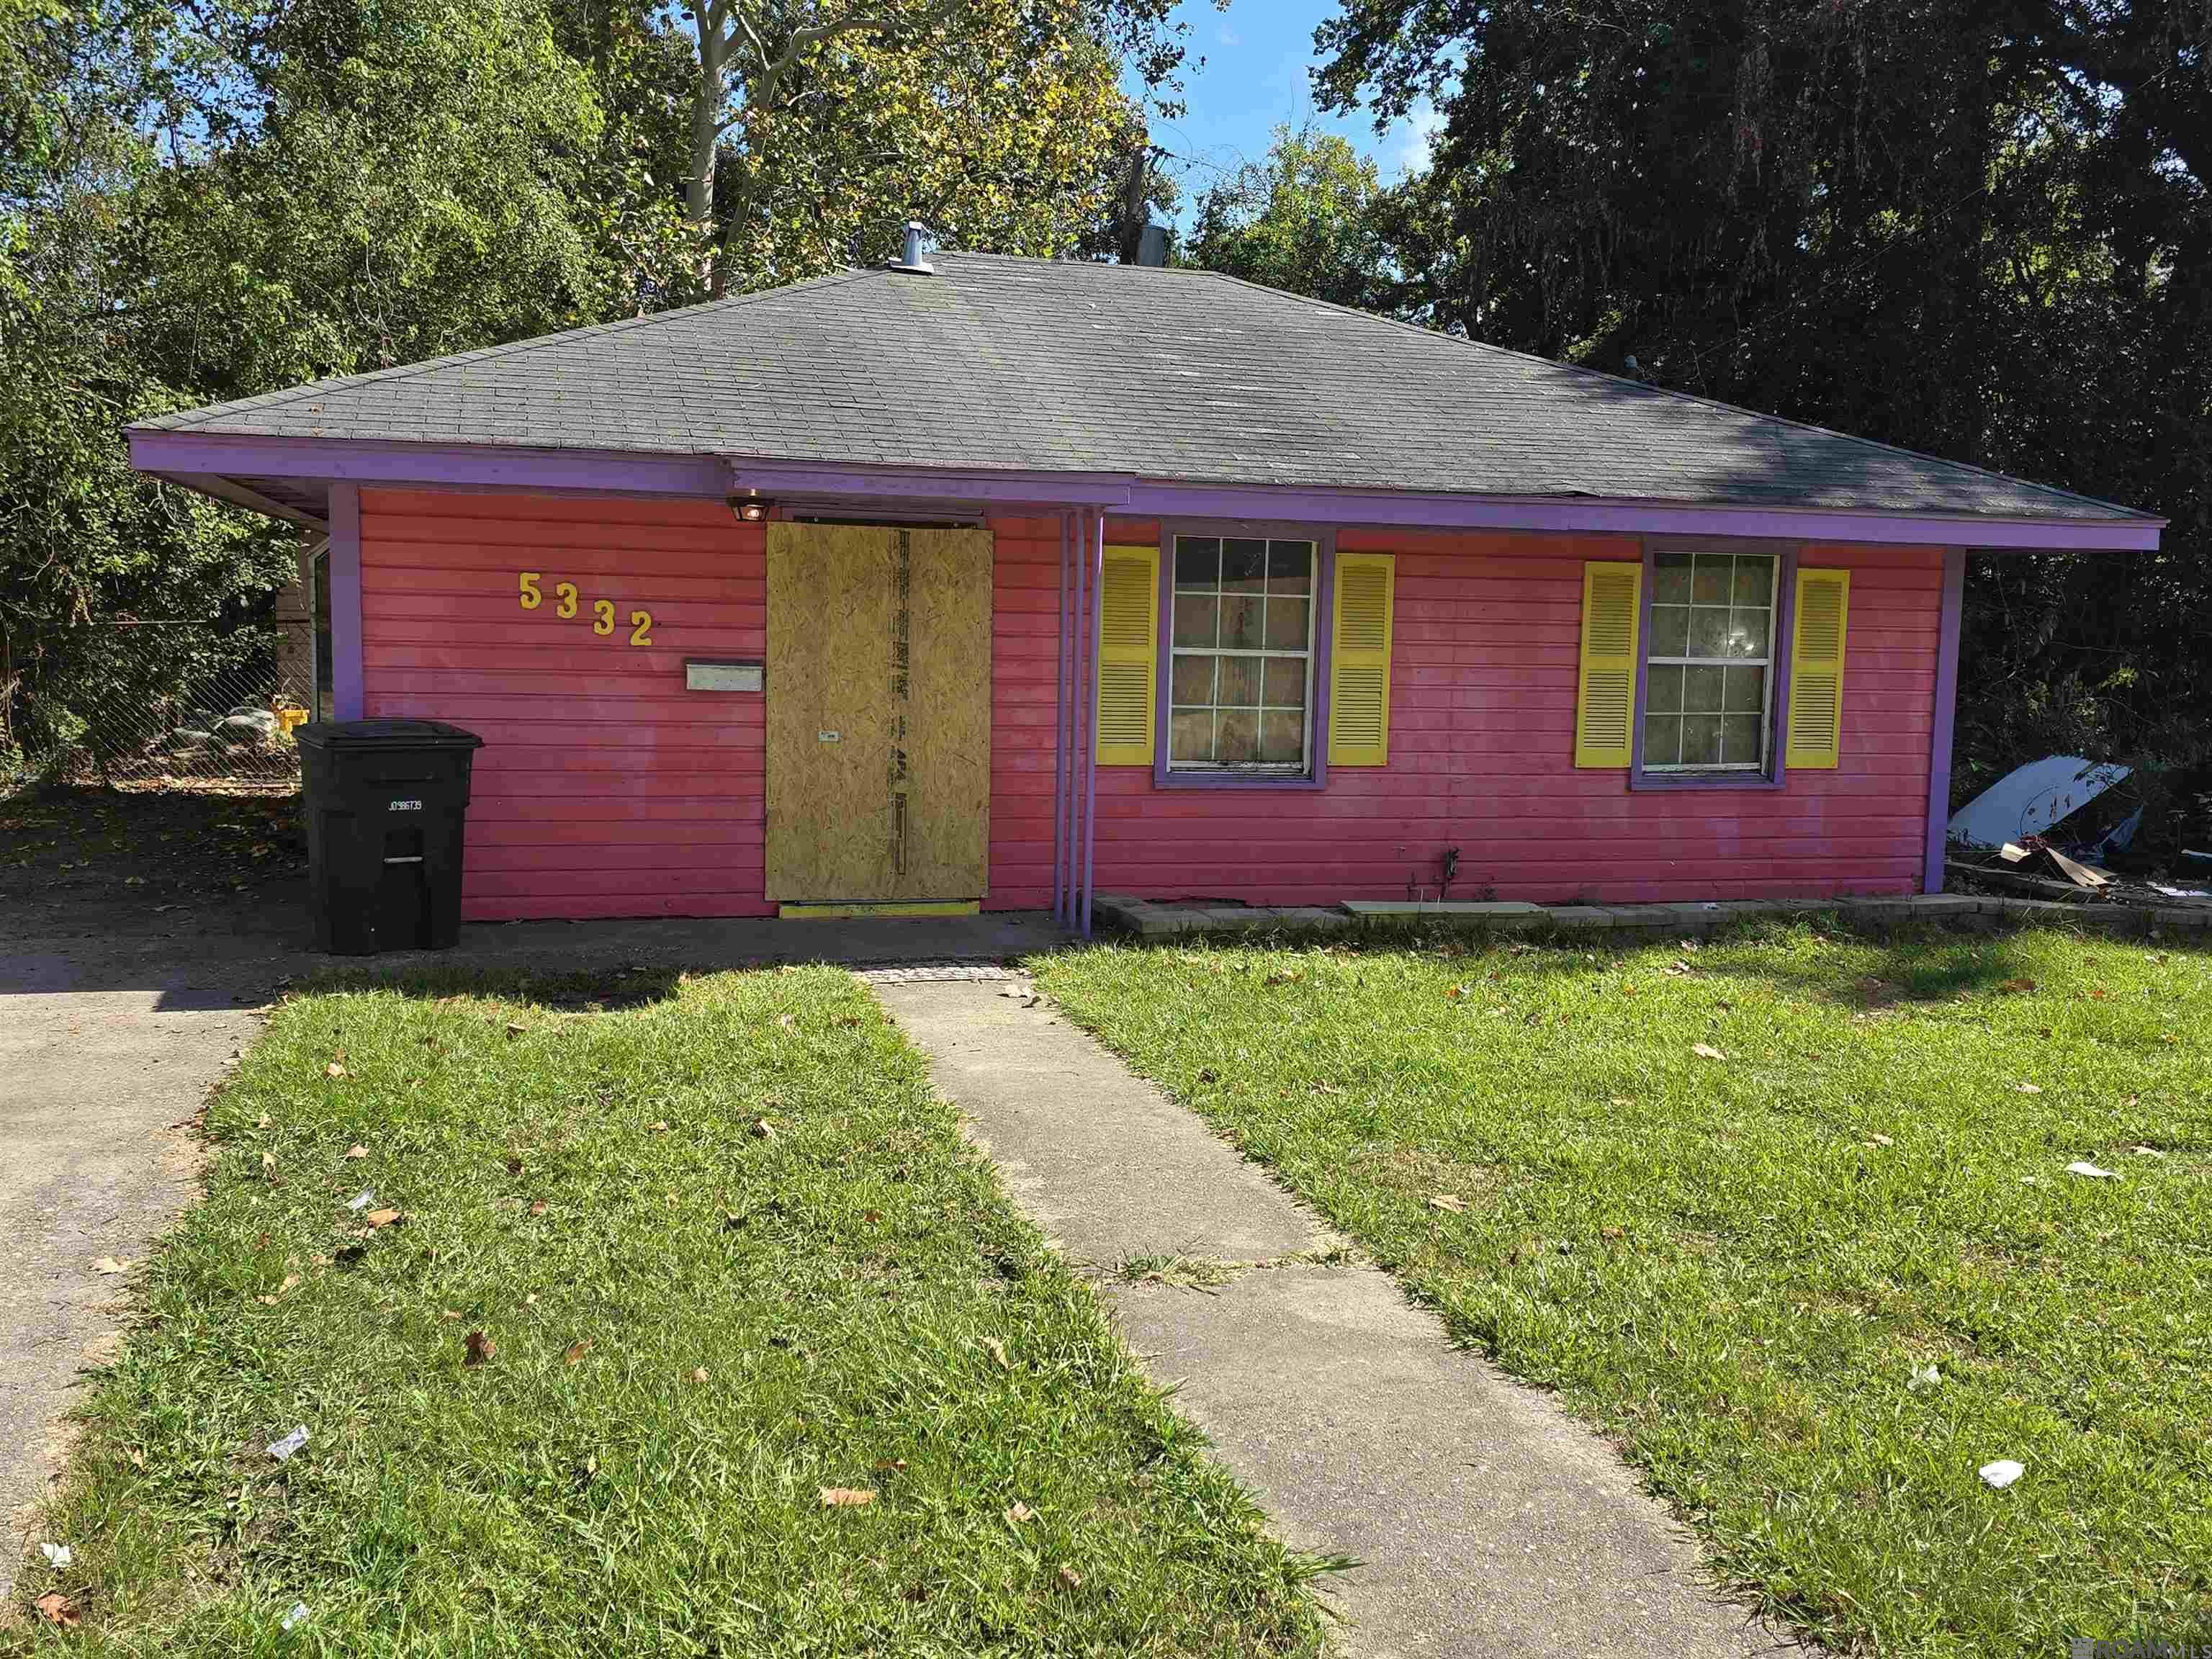
$34,000
3
bds
|
1
ba
|
1,100
sqft
|
built
1950
5332 Enterprise St, Baton Rouge, LA 70805
$621
Cash flow
21.3%
Cash-on-Cash Return
21.9%
Cap rate
2.6%
Rent to Value Ratio
Active
$90,000
4
bds
|
2
ba
|
1,700
sqft
|
built
2002
4008 Brady St, Baton Rouge, LA 70805
$471
Cash flow
27.3%
Cash-on-Cash Return
12.0%
Cap rate
1.4%
Rent to Value Ratio
997 out of 1,285 properties for sale in Baton Rouge, LA
Limited Results Shown
Create a free account, or log in to reveal all property listings and enjoy the complete experience.

Active
$190,000
3
bds
|
2
ba
|
1,340
sqft
|
built
1971
2148 Oak Knoll Dr, Baton Rouge, LA 70815
$205
Cash flow
5.6%
Cash-on-Cash Return
7.0%
Cap rate
0.8%
Rent to Value Ratio
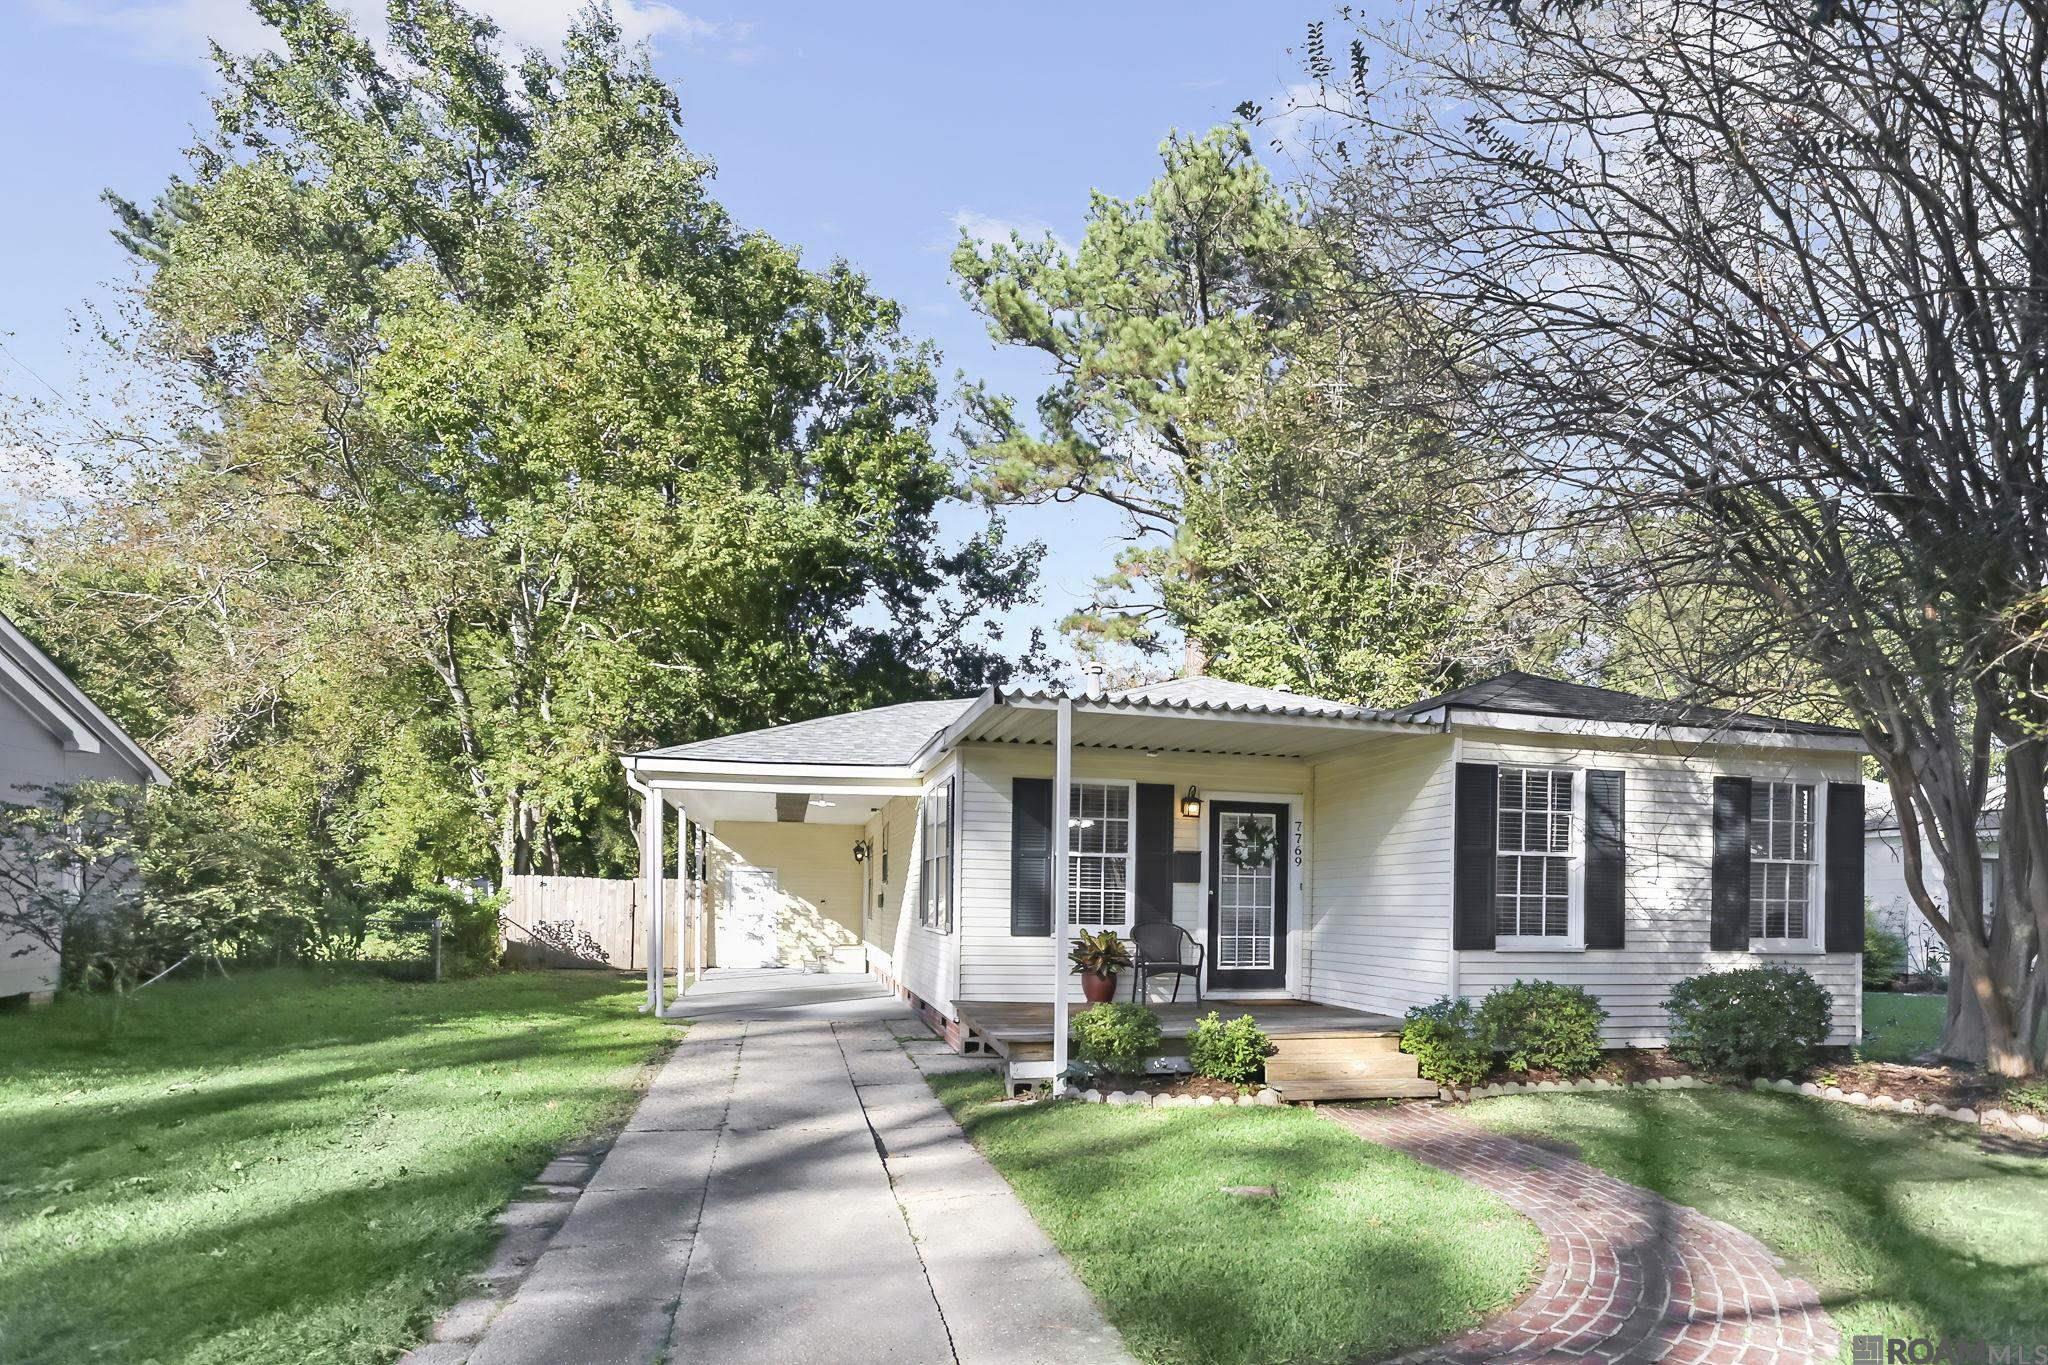
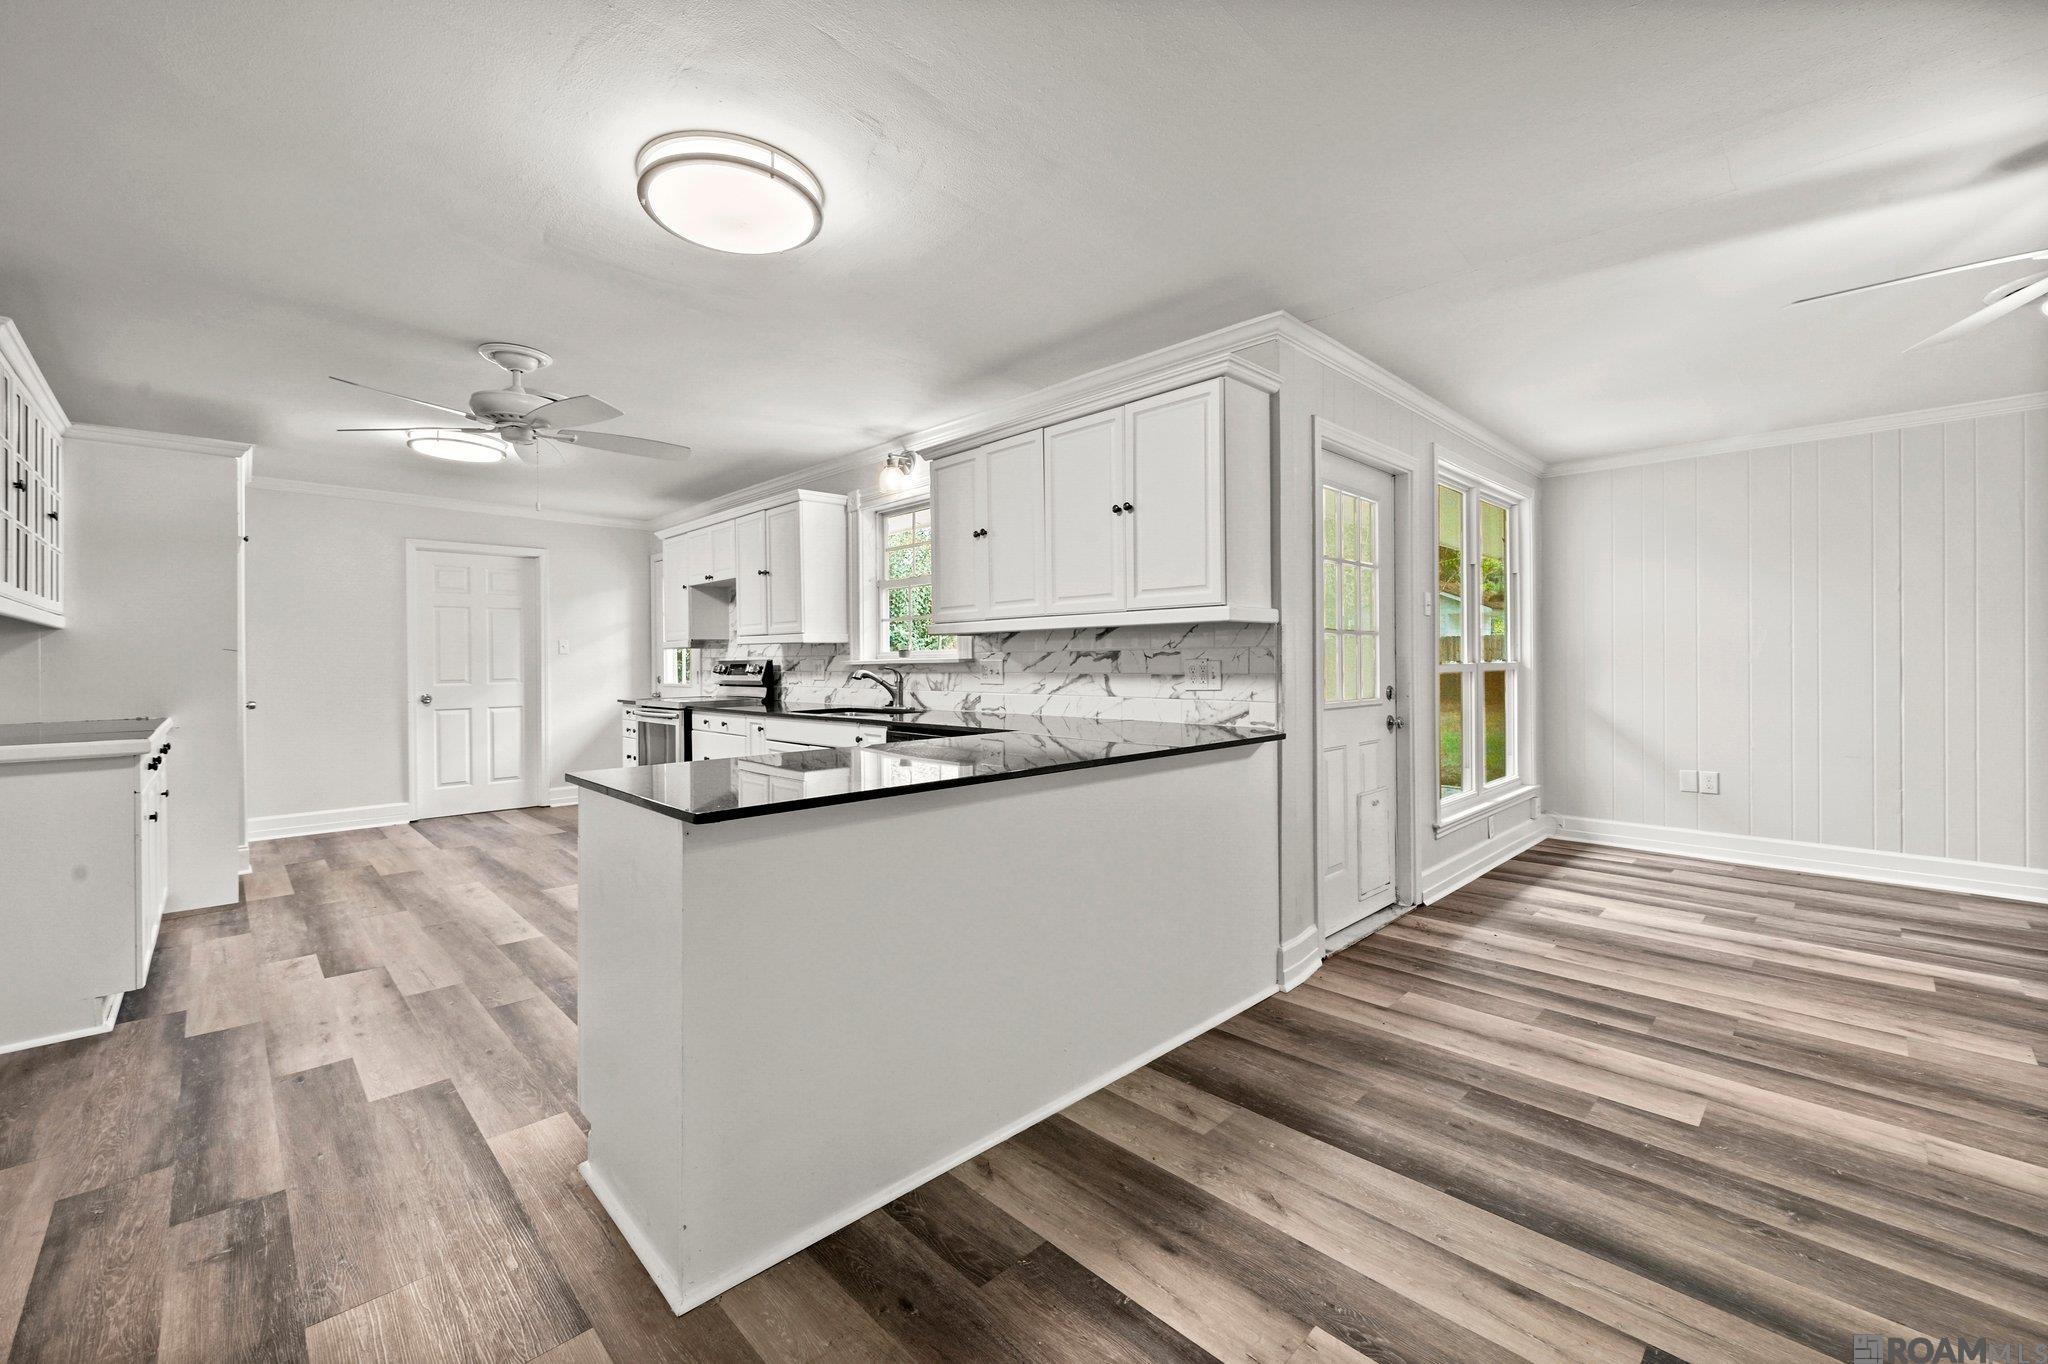
Active
$275,000
3
bds
|
1
ba
|
1,380
sqft
|
built
1952
7769 Lasalle Ave, Baton Rouge, LA 70806
$-61
Cash flow
-1.2%
Cash-on-Cash Return
5.4%
Cap rate
0.7%
Rent to Value Ratio

Active
$215,000
2
bds
|
2
ba
|
2,080
sqft
|
built
1980
10209 Runnymede Ave, Baton Rouge, LA 70815
$-115
Cash flow
-2.8%
Cash-on-Cash Return
5.0%
Cap rate
0.8%
Rent to Value Ratio

Active
$945,000
5
bds
|
5
ba
|
4,220
sqft
|
built
1998
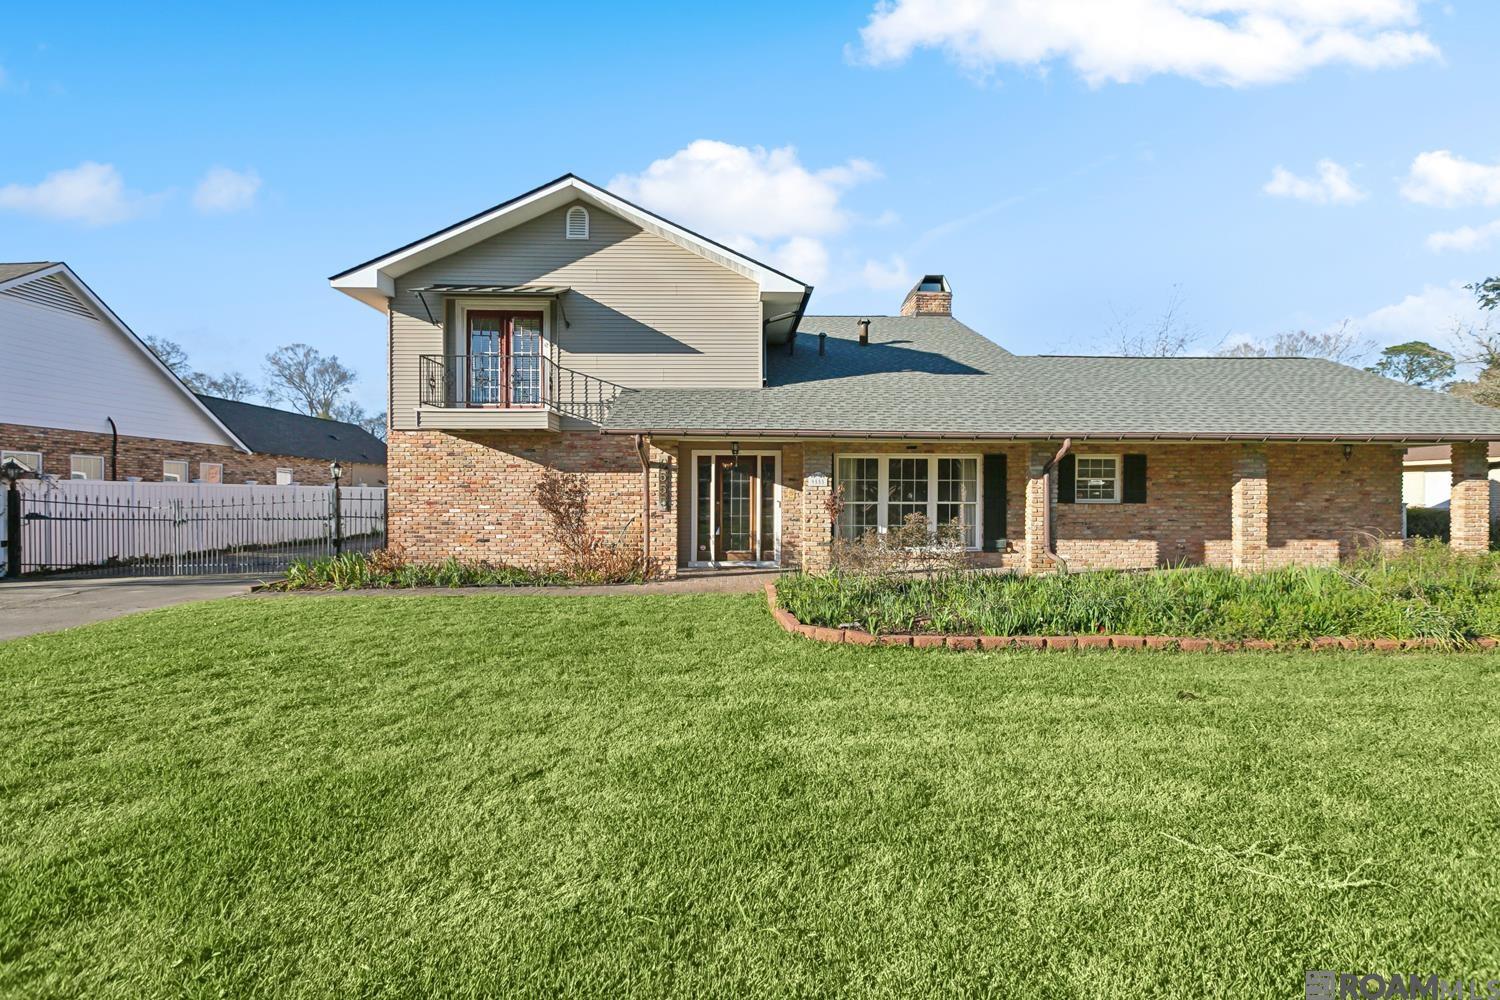
13415 Highland Rd, Baton Rouge, LA 70810
$-625
Cash flow
-3.5%
Cash-on-Cash Return
4.9%
Cap rate
0.6%
Rent to Value Ratio
Active
$279,000
4
bds
|
3
ba
|
1,948
sqft
|
built
1960
8245 Rainbow Dr, Baton Rouge, LA 70809
$198
Cash flow
3.7%
Cash-on-Cash Return
6.5%
Cap rate
0.8%
Rent to Value Ratio

Active
$100,000
2
bds
|
1
ba
|
1,125
sqft
|
built
839 N 47th St, Baton Rouge, LA 70802
$217
Cash flow
11.3%
Cash-on-Cash Return
8.3%
Cap rate
1.0%
Rent to Value Ratio
Active
$874,699
4
bds
|
3
ba
|
3,985
sqft
|
built
2008
14628 Memorial Tower Dr, Baton Rouge, LA 70810
$-492
Cash flow
-2.9%
Cash-on-Cash Return
5.0%
Cap rate
0.6%
Rent to Value Ratio

Active
$247,500
3
bds
|
2
ba
|
1,163
sqft
|
built
1950
4655 Wells St, Baton Rouge, LA 70808
$-274
Cash flow
-5.8%
Cash-on-Cash Return
4.3%
Cap rate
0.5%
Rent to Value Ratio
Active
$186,000
3
bds
|
2
ba
|
1,643
sqft
|
built
1985
4194 Jefferson Woods Dr, Baton Rouge, LA 70809
$109
Cash flow
3.1%
Cash-on-Cash Return
6.4%
Cap rate
0.9%
Rent to Value Ratio
Active
$544,000
4
bds
|
3
ba
|
2,807
sqft
|
built
1990
6244 Krista Ln, Baton Rouge, LA 70808
$-606
Cash flow
-5.8%
Cash-on-Cash Return
4.3%
Cap rate
0.5%
Rent to Value Ratio
Active
$805,000
4
bds
|
3
ba
|
3,266
sqft
|
built
2019
4718 Orchid St, Baton Rouge, LA 70808
$-429
Cash flow
-2.8%
Cash-on-Cash Return
5.0%
Cap rate
0.6%
Rent to Value Ratio
Active
$34,000
3
bds
|
1
ba
|
1,100
sqft
|
built
1950
5332 Enterprise St, Baton Rouge, LA 70805
$621
Cash flow
21.3%
Cash-on-Cash Return
21.9%
Cap rate
2.6%
Rent to Value Ratio
Active
$340,000
4
bds
|
2
ba
|
2,022
sqft
|
built
1972
11758 Joor Rd, Baton Rouge, LA 70818
$-367
Cash flow
-5.6%
Cash-on-Cash Return
4.4%
Cap rate
0.5%
Rent to Value Ratio
Active
$228,900
3
bds
|
2
ba
|
1,906
sqft
|
built
1977
13804 Katherine Ave, Baton Rouge, LA 70815
$297
Cash flow
6.8%
Cash-on-Cash Return
7.2%
Cap rate
0.9%
Rent to Value Ratio

Active
$309,900
3
bds
|
2
ba
|
2,416
sqft
|
built
2007
14737 Rhonda Ave, Baton Rouge, LA 70816
$-18
Cash flow
-0.3%
Cash-on-Cash Return
5.6%
Cap rate
0.7%
Rent to Value Ratio
Active
$389,900
3
bds
|
2
ba
|
2,037
sqft
|
built
2010
2145 Hillridge Ave, Baton Rouge, LA 70810
$54
Cash flow
0.7%
Cash-on-Cash Return
5.8%
Cap rate
0.7%
Rent to Value Ratio
Active
$179,700
4
bds
|
2
ba
|
2,400
sqft
|
built
1970
7734 Emile St, Baton Rouge, LA 70807
$254
Cash flow
7.4%
Cash-on-Cash Return
7.4%
Cap rate
0.9%
Rent to Value Ratio

Active
$240,000
3
bds
|
2
ba
|
1,630
sqft
|
built
1960
625 Elizabeth Dr, Baton Rouge, LA 70815
$-170
Cash flow
-3.7%
Cash-on-Cash Return
4.8%
Cap rate
0.6%
Rent to Value Ratio

Active
$422,500
3
bds
|
3
ba
|
2,242
sqft
|
built
1991
13333 Dorset Ave, Baton Rouge, LA 70818
$-67
Cash flow
-0.8%
Cash-on-Cash Return
5.5%
Cap rate
0.7%
Rent to Value Ratio
Active
$1,295,000
4
bds
|
4
ba
|
5,180
sqft
|
built
2010
11447 Center Court Blvd, Baton Rouge, LA 70810
$-2,251
Cash flow
-9.1%
Cash-on-Cash Return
3.6%
Cap rate
0.4%
Rent to Value Ratio
Active
$539,500
3
bds
|
2
ba
|
2,130
sqft
|
built
2014
10726 Preservation Way, Baton Rouge, LA 70810
$-746
Cash flow
-7.2%
Cash-on-Cash Return
4.0%
Cap rate
0.5%
Rent to Value Ratio
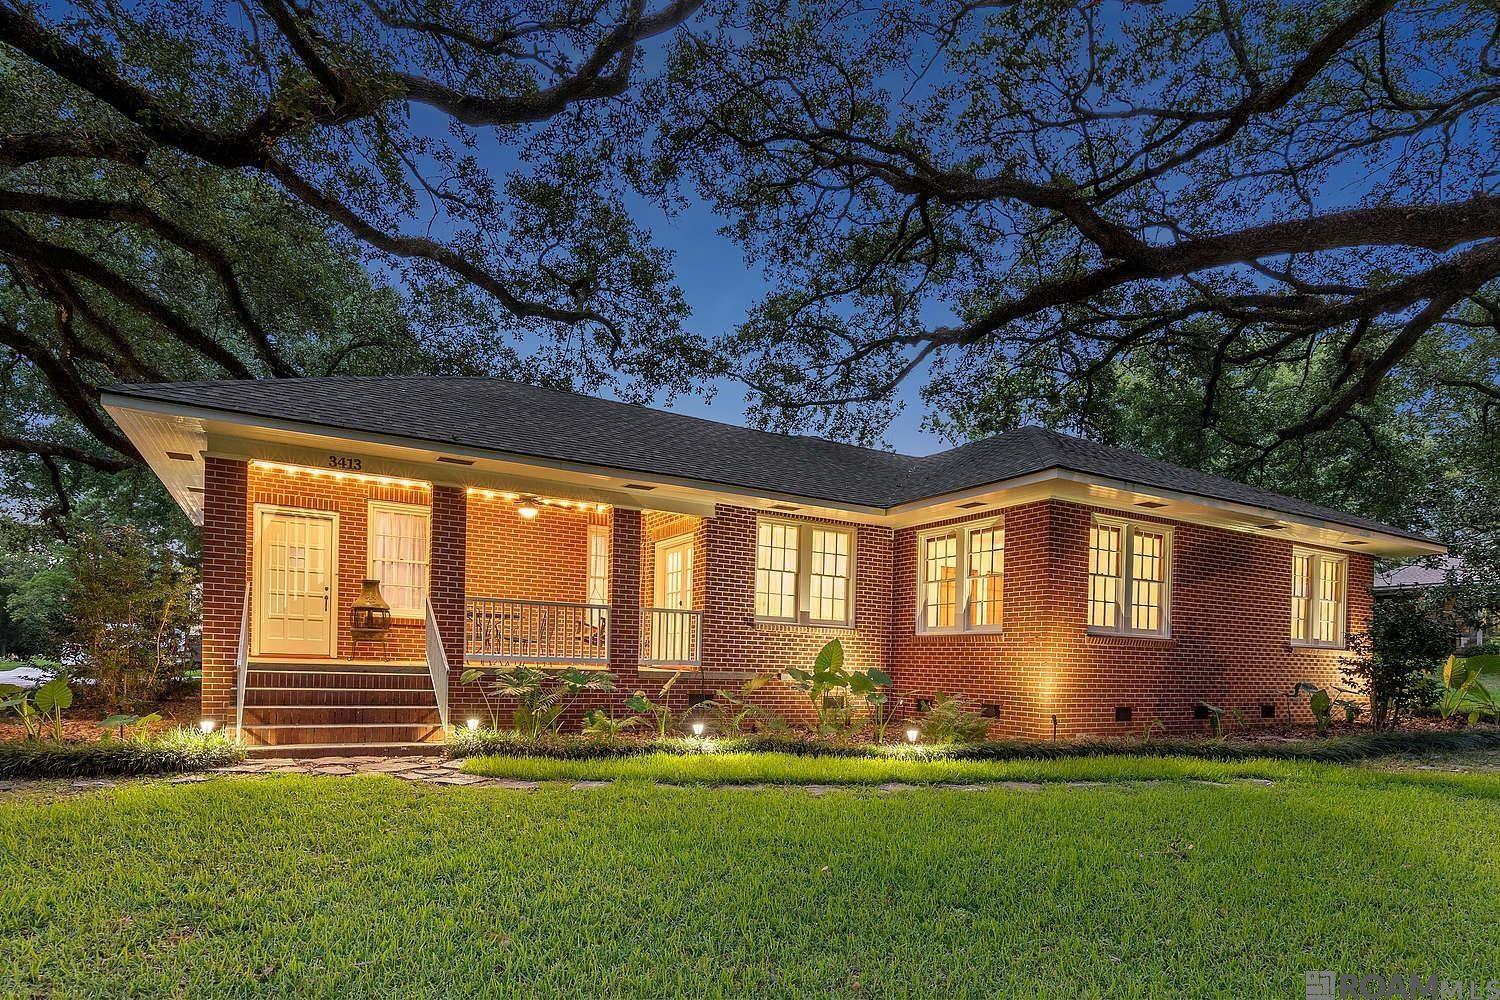
Active
$474,900
4
bds
|
3
ba
|
2,639
sqft
|
built
1964
3413 Belmont Ave, Baton Rouge, LA 70808
$-108
Cash flow
-1.2%
Cash-on-Cash Return
5.4%
Cap rate
0.7%
Rent to Value Ratio

Active
$605,000
3
bds
|
3
ba
|
2,903
sqft
|
built
2022
14241 Spalding Way, Baton Rouge, LA 70817
$-519
Cash flow
-4.5%
Cash-on-Cash Return
4.6%
Cap rate
0.6%
Rent to Value Ratio
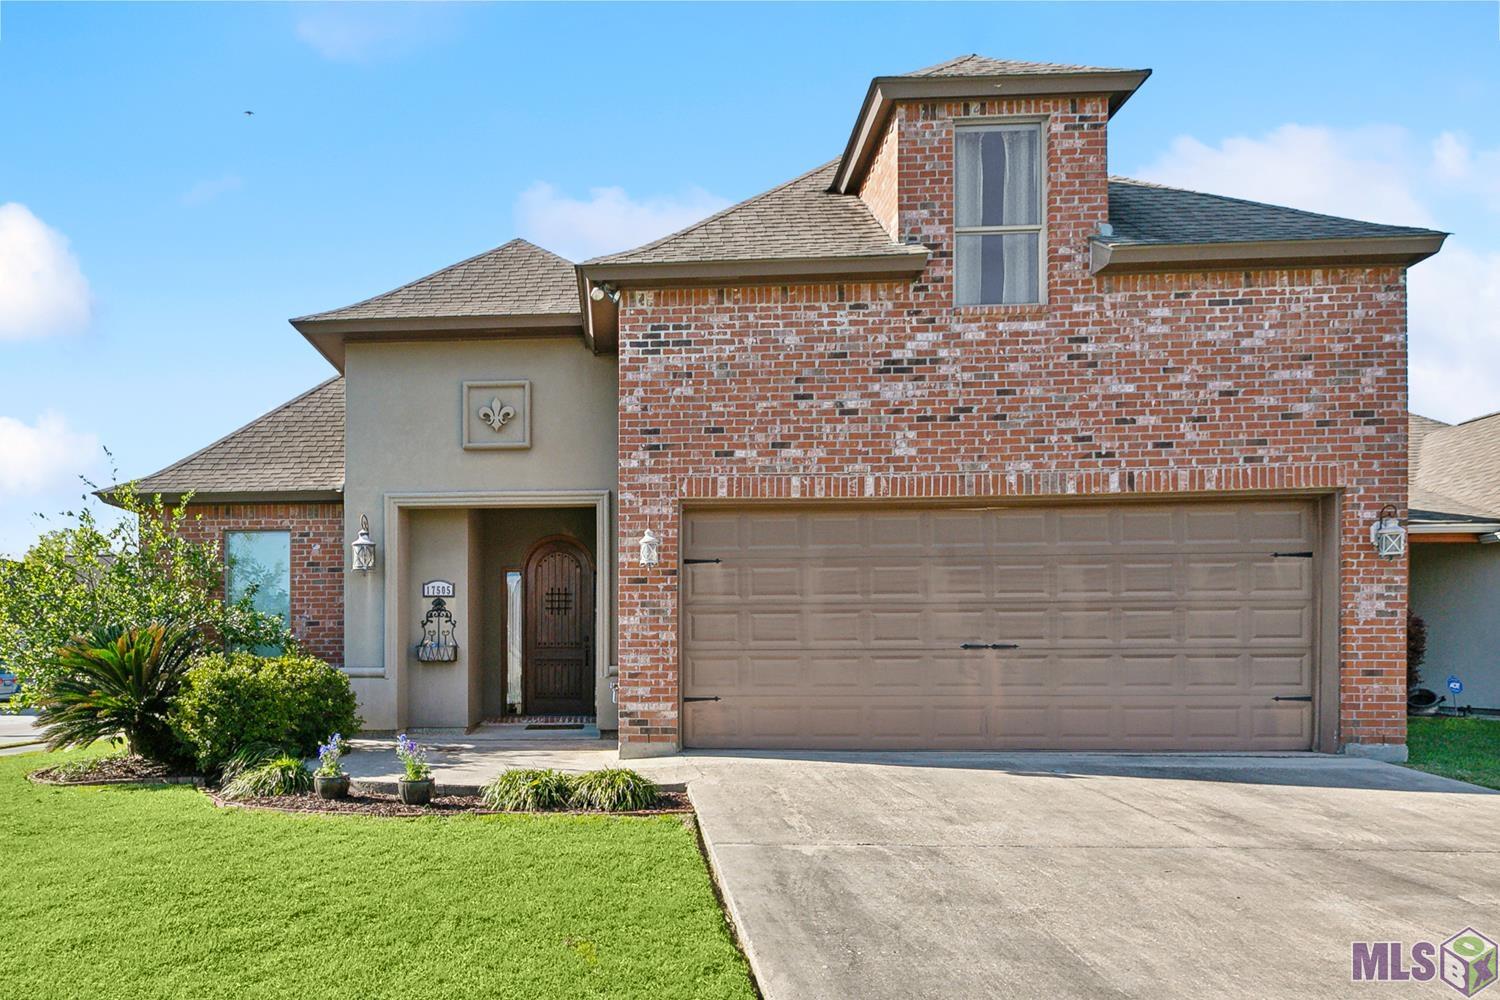
Active
$359,900
4
bds
|
4
ba
|
2,620
sqft
|
built
2010
17505 Lake Willow Ave, Baton Rouge, LA 70817
$204
Cash flow
3.0%
Cash-on-Cash Return
6.4%
Cap rate
0.8%
Rent to Value Ratio
Active
$774,900
4
bds
|
4
ba
|
2,774
sqft
|
built
2015
8624 Billiu St, Baton Rouge, LA 70817
$-1,576
Cash flow
-10.6%
Cash-on-Cash Return
3.2%
Cap rate
0.4%
Rent to Value Ratio
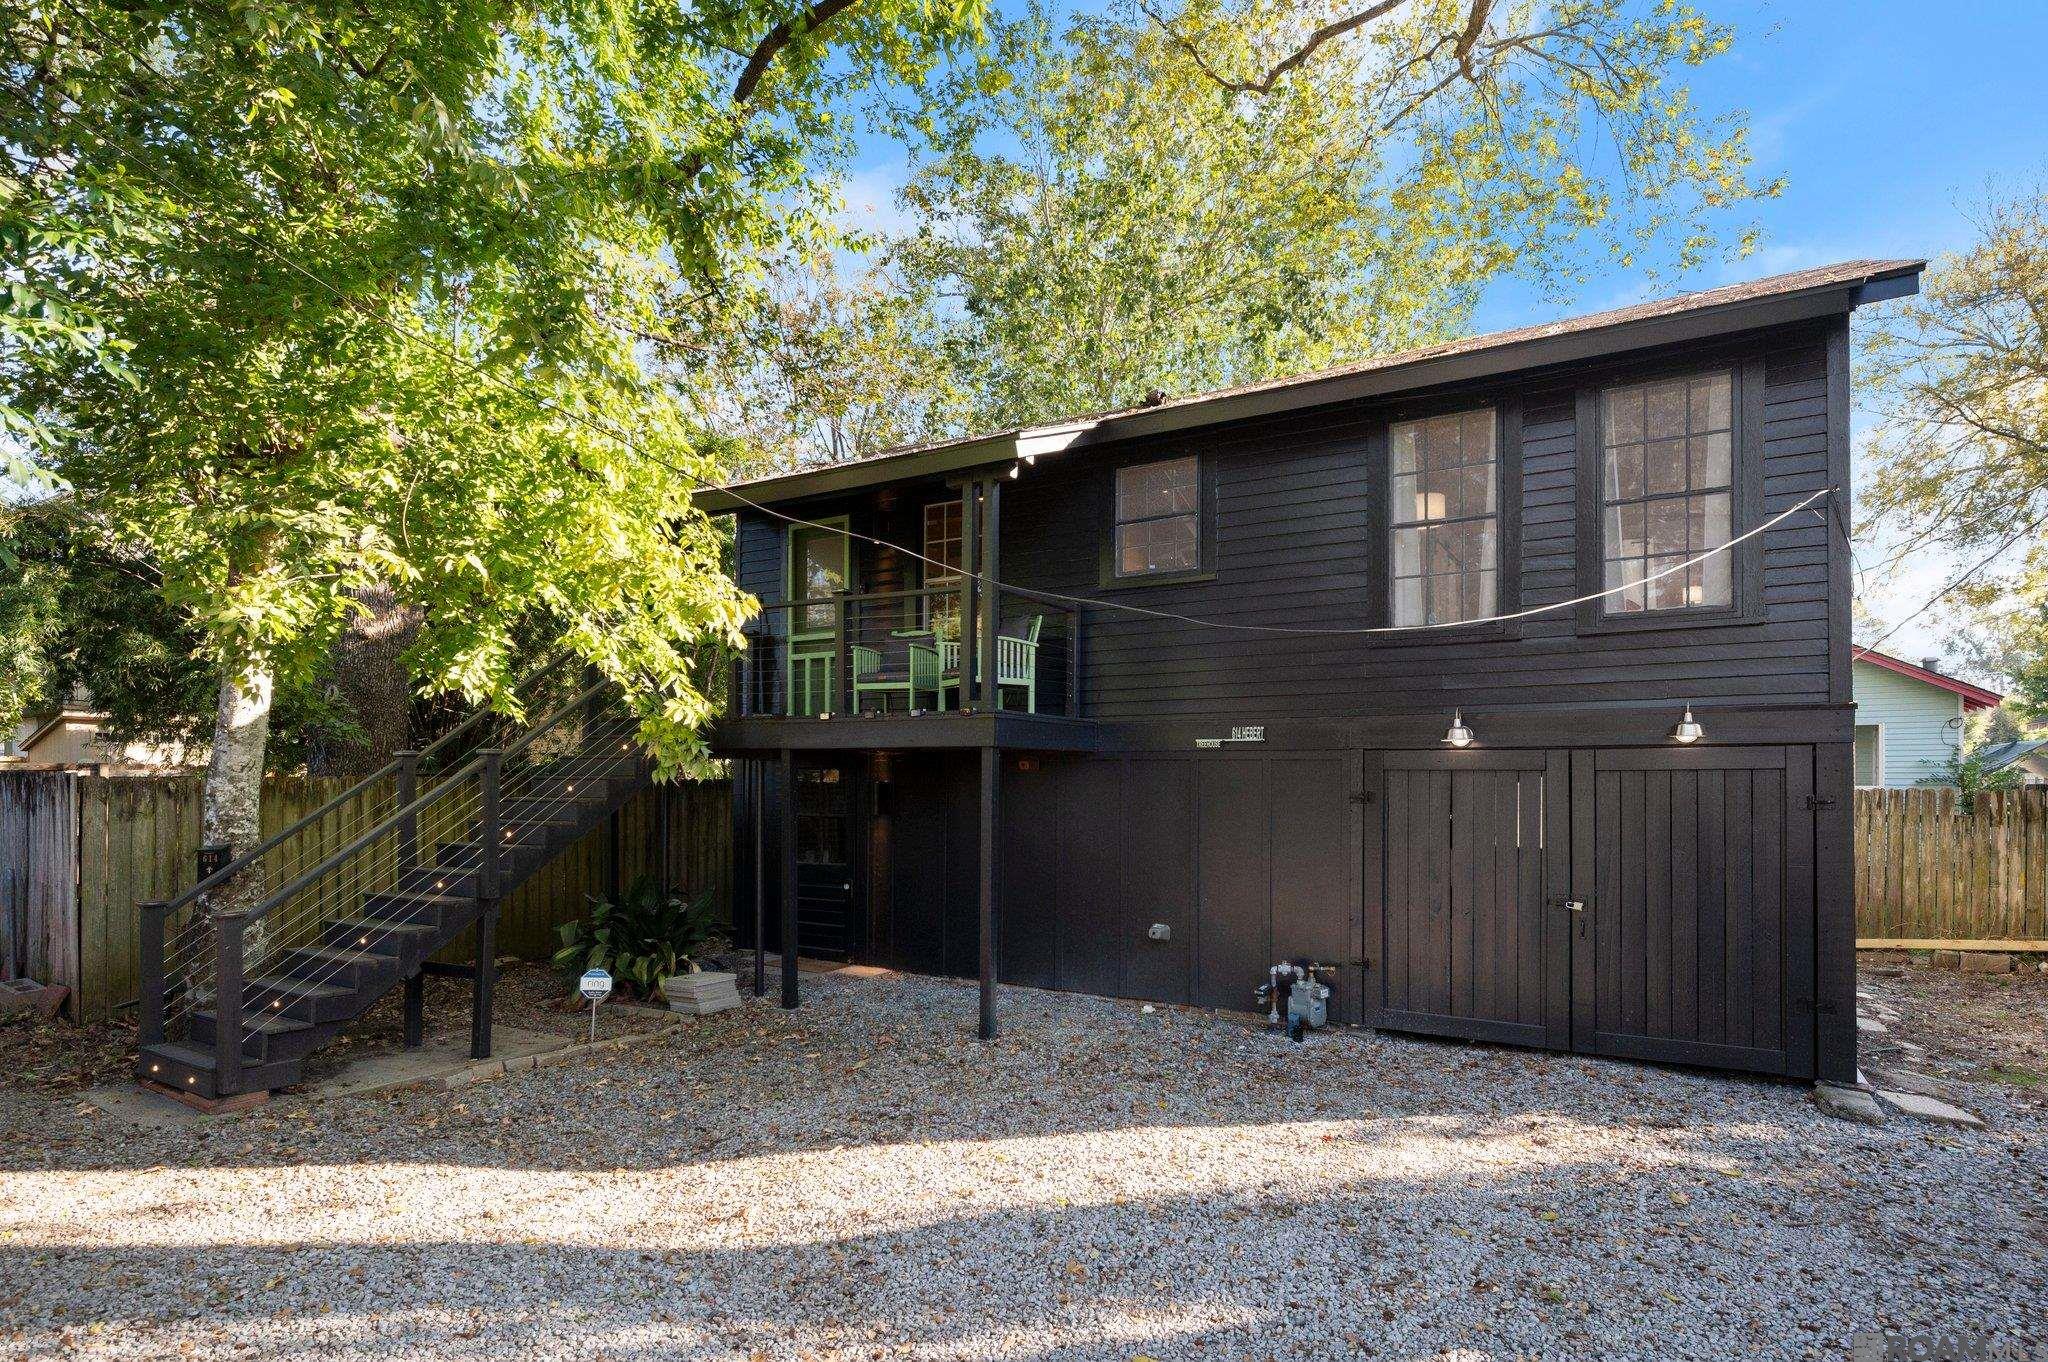
Pending
$215,000
1
bds
|
1
ba
|
653
sqft
|
built
1940
614 Hebert St, Baton Rouge, LA 70806
$-51
Cash flow
-1.2%
Cash-on-Cash Return
5.4%
Cap rate
0.7%
Rent to Value Ratio
Active
$439,900
3
bds
|
2
ba
|
1,487
sqft
|
built
1965
2054 Edinburgh Ave, Baton Rouge, LA 70808
$-978
Cash flow
-11.6%
Cash-on-Cash Return
3.0%
Cap rate
0.4%
Rent to Value Ratio

Active
$650,000
4
bds
|
4
ba
|
3,470
sqft
|
built
2011
6303 Muir St, Baton Rouge, LA 70817
$-931
Cash flow
-7.5%
Cash-on-Cash Return
4.0%
Cap rate
0.5%
Rent to Value Ratio
Active
$1,499,000
5
bds
|
4
ba
|
4,253
sqft
|
built
1931
505 L S U Ave, Baton Rouge, LA 70808
$-3,312
Cash flow
-11.5%
Cash-on-Cash Return
3.0%
Cap rate
0.4%
Rent to Value Ratio

Active
$285,000
4
bds
|
3
ba
|
2,578
sqft
|
built
1975
4368 Blecker Dr, Baton Rouge, LA 70809
$376
Cash flow
6.9%
Cash-on-Cash Return
7.3%
Cap rate
0.9%
Rent to Value Ratio
Active
$495,000
4
bds
|
4
ba
|
4,415
sqft
|
built
1965
9555 Goodwood Blvd, Baton Rouge, LA 70815
$-617
Cash flow
-6.5%
Cash-on-Cash Return
4.2%
Cap rate
0.5%
Rent to Value Ratio
Active
$237,500
3
bds
|
2
ba
|
2,228
sqft
|
built
1966
1345 Braeburn Dr, Baton Rouge, LA 70815
$256
Cash flow
5.6%
Cash-on-Cash Return
7.0%
Cap rate
0.8%
Rent to Value Ratio
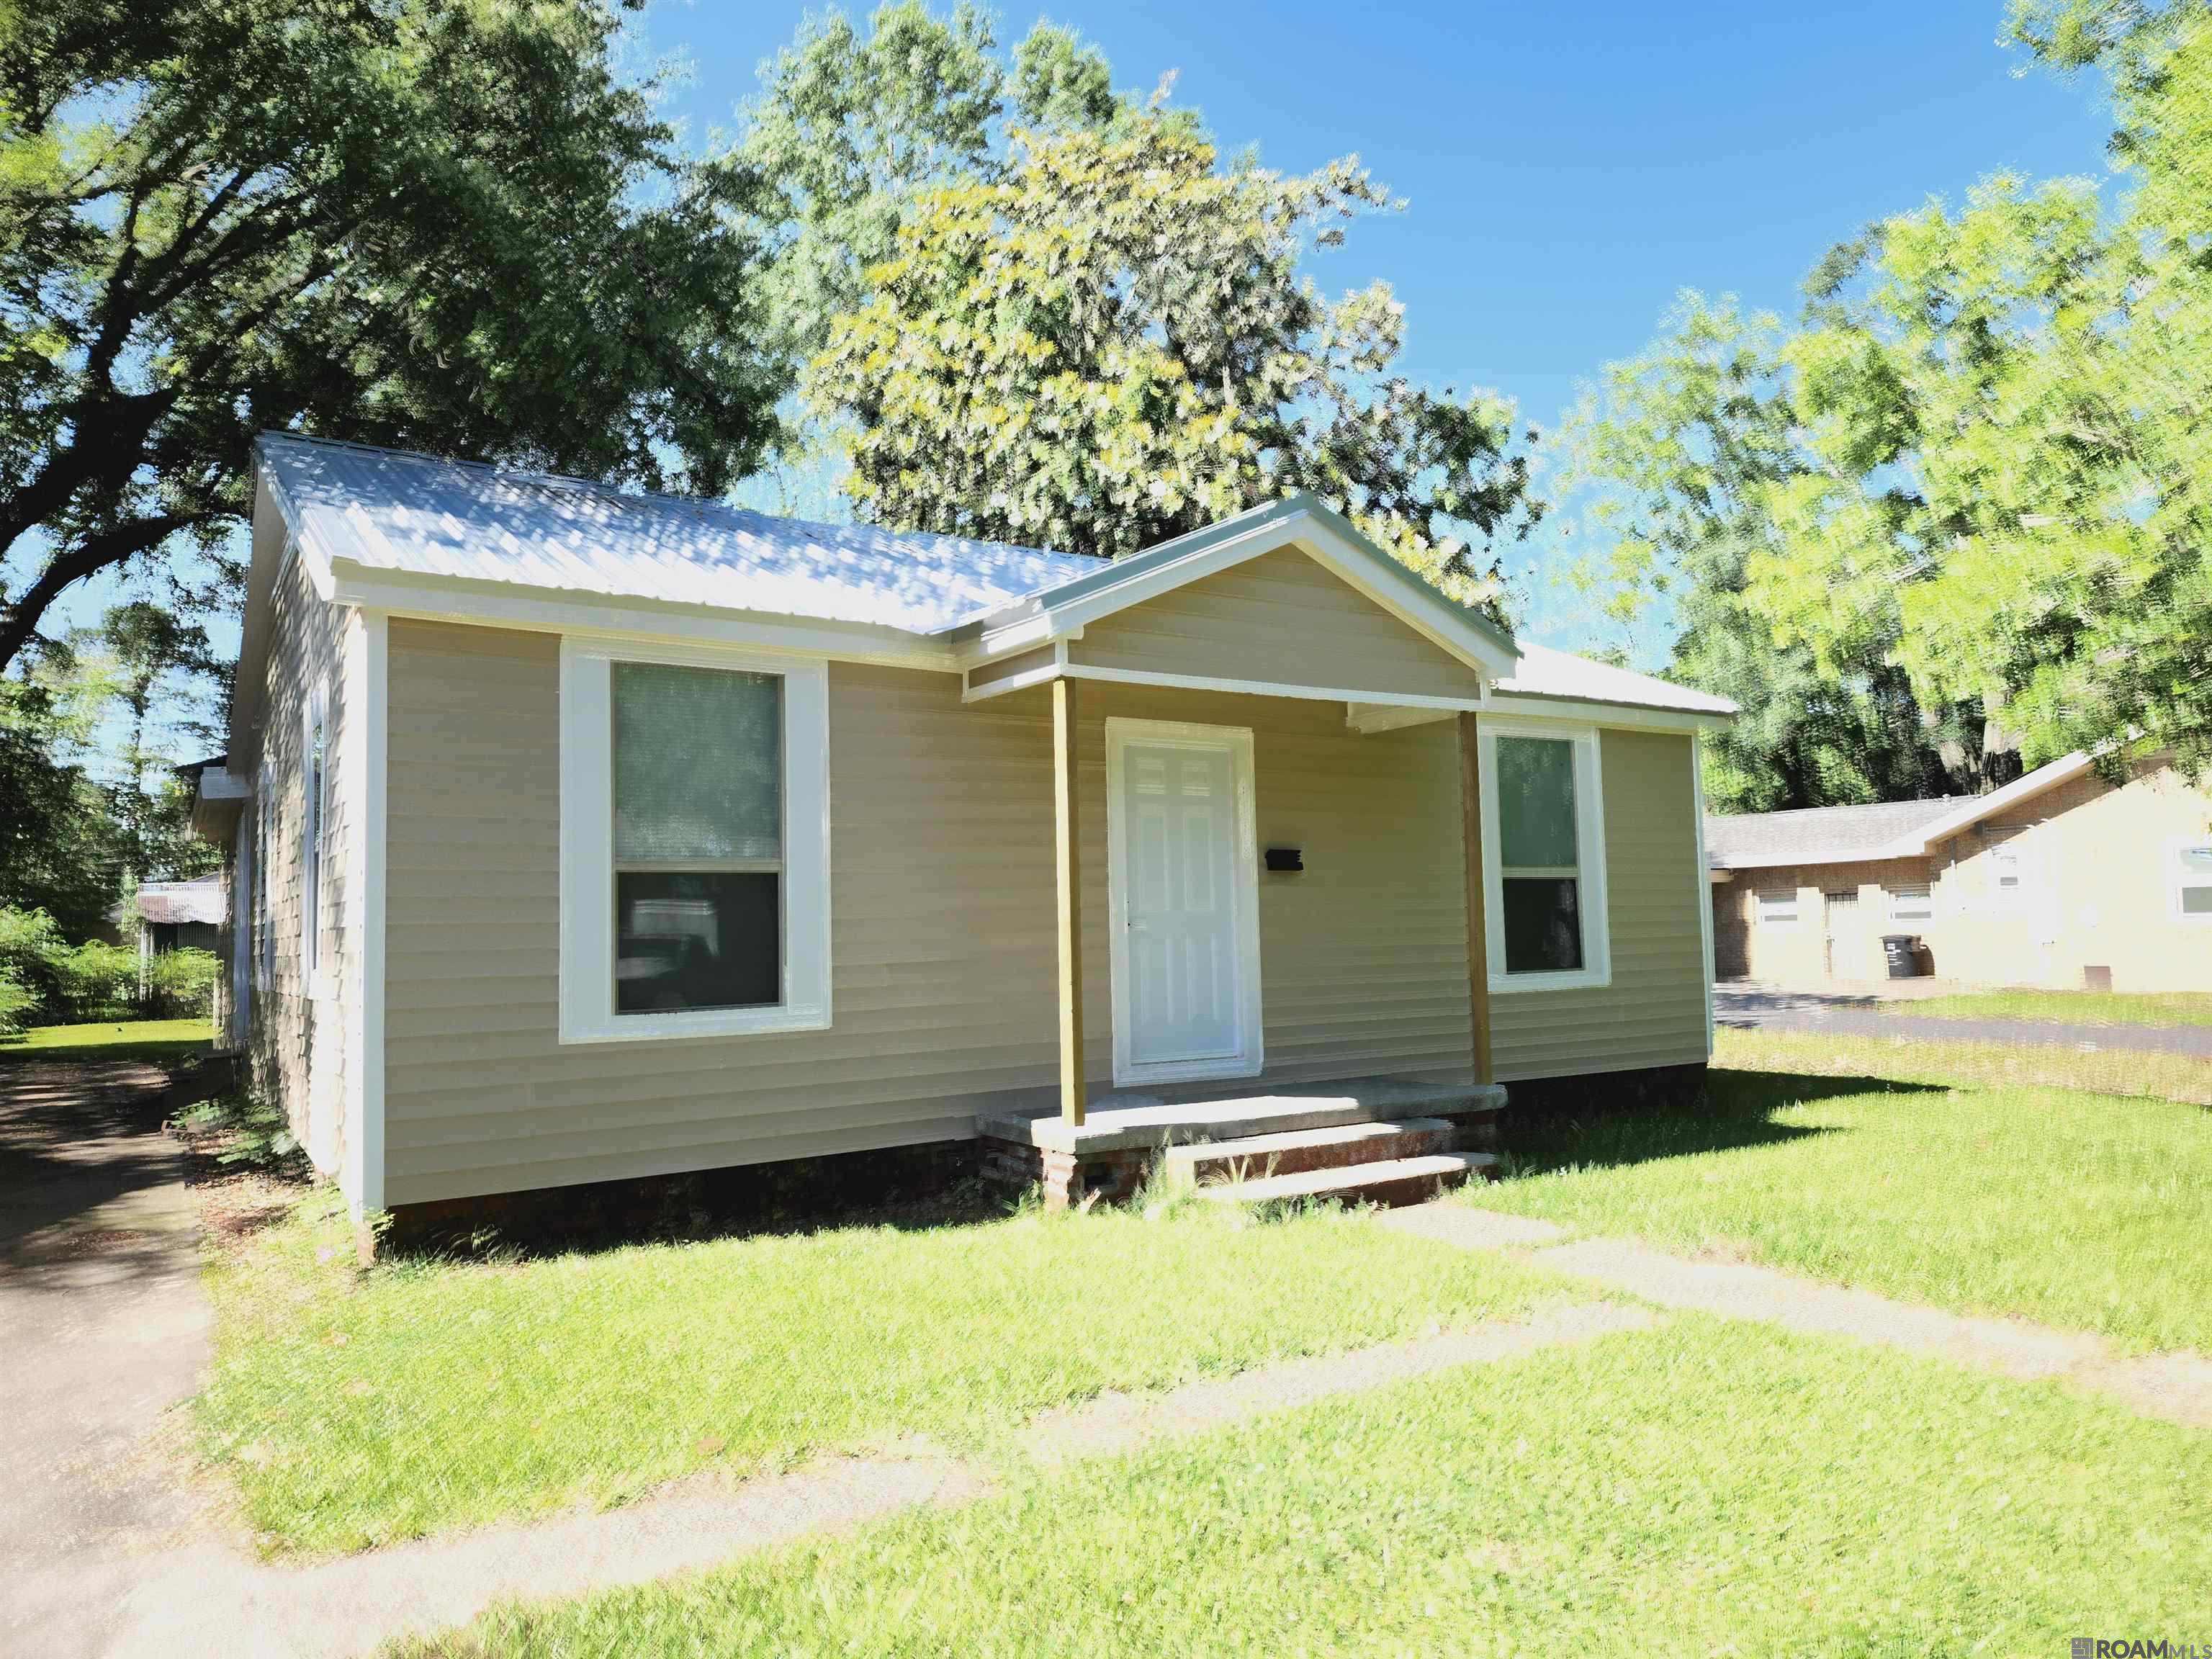
Active
$90,000
4
bds
|
2
ba
|
1,700
sqft
|
built
2002
4008 Brady St, Baton Rouge, LA 70805
$471
Cash flow
27.3%
Cash-on-Cash Return
12.0%
Cap rate
1.4%
Rent to Value Ratio
Active
$177,000
3
bds
|
3
ba
|
1,920
sqft
|
built
1970
10053 Jefferson Hwy, Baton Rouge, LA 70809
$119
Cash flow
3.5%
Cash-on-Cash Return
6.5%
Cap rate
1.0%
Rent to Value Ratio
Active
$319,000
3
bds
|
2
ba
|
1,879
sqft
|
built
1978
5414 Upton Dr, Baton Rouge, LA 70809
$-130
Cash flow
-2.1%
Cash-on-Cash Return
5.2%
Cap rate
0.6%
Rent to Value Ratio
Active
$208,000
3
bds
|
2
ba
|
1,576
sqft
|
built
1980
7544 Pennhill Dr, Baton Rouge, LA 70817
$189
Cash flow
4.7%
Cash-on-Cash Return
6.8%
Cap rate
0.8%
Rent to Value Ratio
Active
$379,000
3
bds
|
3
ba
|
1,860
sqft
|
built
2020
2537 Jura St, Baton Rouge, LA 70806
$0
Cash flow
0.0%
Cash-on-Cash Return
5.7%
Cap rate
0.7%
Rent to Value Ratio

Active
$959,000
5
bds
|
4
ba
|
4,375
sqft
|
built
2003
413 Longmeadow Dr, Baton Rouge, LA 70810
$-655
Cash flow
-3.6%
Cash-on-Cash Return
4.9%
Cap rate
0.6%
Rent to Value Ratio
Active
$750,000
3
bds
|
3
ba
|
3,100
sqft
|
built
1990
8118 Oakbrook Dr, Baton Rouge, LA 70810
$-1,481
Cash flow
-10.3%
Cash-on-Cash Return
3.3%
Cap rate
0.4%
Rent to Value Ratio

Active
$1,450,000
6
bds
|
5
ba
|
5,348
sqft
|
built
1998
2524 Laurel Lakes Ave, Baton Rouge, LA 70820
$-2,257
Cash flow
-8.1%
Cash-on-Cash Return
3.8%
Cap rate
0.5%
Rent to Value Ratio