Baton Rouge, LA Investment Properties for Sale
Browse homes for sale and investment properties in Baton Rouge, LA. Refine your search by price, property type, or more.
Best cash flowing properties in Baton Rouge, LA

Active
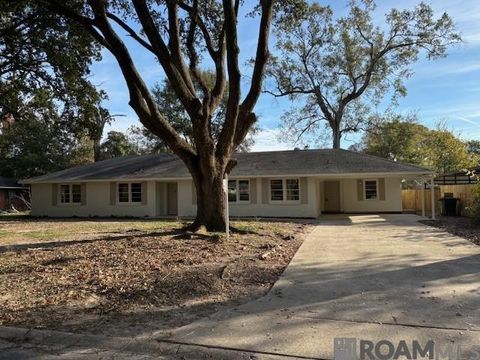
$89,000
2
bds
|
2
ba
|
1,135
sqft
|
built
1975
4364 Gurney St, Baton Rouge, LA 70805
$432
Cash flow
25.3%
Cash-on-Cash Return
12.1%
Cap rate
1.5%
Rent to Value Ratio

Pending
$190,000
4
bds
|
2
ba
|
2,004
sqft
|
built
1974
11088 Mollylea Dr, Baton Rouge, LA 70815
$388
Cash flow
10.7%
Cash-on-Cash Return
8.7%
Cap rate
1.1%
Rent to Value Ratio
973 out of 1,256 properties for sale in Baton Rouge, LA
Limited Results Shown
Create a free account, or log in to reveal all property listings and enjoy the complete experience.
Active
$279,900
3
bds
|
2
ba
|
1,932
sqft
|
built
1960
437 Cora Dr, Baton Rouge, LA 70815
$-84
Cash flow
-1.6%
Cash-on-Cash Return
5.9%
Cap rate
0.7%
Rent to Value Ratio

Active
$200,000
3
bds
|
1
ba
|
1,640
sqft
|
built
1975
259 W Parkland Dr, Baton Rouge, LA 70806
$60
Cash flow
1.6%
Cash-on-Cash Return
6.6%
Cap rate
0.8%
Rent to Value Ratio

Active
$649,900
3
bds
|
3
ba
|
2,104
sqft
|
built
1980
1035 Claiborne Rd, Baton Rouge, LA 70810
$-1,185
Cash flow
-9.5%
Cash-on-Cash Return
4.1%
Cap rate
0.5%
Rent to Value Ratio

Active
$425,000
4
bds
|
2
ba
|
1,995
sqft
|
built
2022
3006 Creekstone Way, Baton Rouge, LA 70810
$-370
Cash flow
-4.5%
Cash-on-Cash Return
5.2%
Cap rate
0.7%
Rent to Value Ratio
Active
$995,000
5
bds
|
3
ba
|
4,114
sqft
|
built
1997
17230 N Lakeway Ave, Baton Rouge, LA 70810
$-2,986
Cash flow
-15.7%
Cash-on-Cash Return
2.7%
Cap rate
0.4%
Rent to Value Ratio

Active
$789,500
4
bds
|
3
ba
|
2,780
sqft
|
built
2015
11520 Ancestors Dr, Baton Rouge, LA 70810
$-1,146
Cash flow
-7.6%
Cash-on-Cash Return
4.5%
Cap rate
0.6%
Rent to Value Ratio

Active
$319,000
2
bds
|
1
ba
|
1,480
sqft
|
built
1971
1313 S Eugene St, Baton Rouge, LA 70806
$-423
Cash flow
-6.9%
Cash-on-Cash Return
4.7%
Cap rate
0.6%
Rent to Value Ratio
Active
$550,000
4
bds
|
3
ba
|
2,403
sqft
|
built
1970
2609 Reymond Ave, Baton Rouge, LA 70808
$-663
Cash flow
-6.3%
Cash-on-Cash Return
4.8%
Cap rate
0.6%
Rent to Value Ratio
Active
$1,195,000
4
bds
|
3
ba
|
3,256
sqft
|
built
1956
7375 Boyce Dr, Baton Rouge, LA 70809
$-1,963
Cash flow
-8.6%
Cash-on-Cash Return
4.3%
Cap rate
0.5%
Rent to Value Ratio

Active under contract
$555,000
4
bds
|
4
ba
|
2,820
sqft
|
built
2000
6920 Highland Rd, Baton Rouge, LA 70808
$-483
Cash flow
-4.5%
Cash-on-Cash Return
5.2%
Cap rate
0.6%
Rent to Value Ratio

Active
$583,000
3
bds
|
3
ba
|
2,205
sqft
|
built
2015
7037 Etage Ct, Baton Rouge, LA 70806
$-1,011
Cash flow
-9.0%
Cash-on-Cash Return
4.2%
Cap rate
0.5%
Rent to Value Ratio
Active
$325,000
5
bds
|
4
ba
|
3,028
sqft
|
built
1972
10588 Goodwood Blvd, Baton Rouge, LA 70815
$28
Cash flow
0.4%
Cash-on-Cash Return
6.4%
Cap rate
0.8%
Rent to Value Ratio

Active
$279,900
4
bds
|
3
ba
|
2,163
sqft
|
built
1990
12223 Astolat Ave, Baton Rouge, LA 70816
$-81
Cash flow
-1.5%
Cash-on-Cash Return
5.9%
Cap rate
0.7%
Rent to Value Ratio
Active
$314,900
2
bds
|
3
ba
|
1,573
sqft
|
built
2018
5066 Myrtle Trail Dr, Baton Rouge, LA 70820
$-665
Cash flow
-11.0%
Cash-on-Cash Return
3.7%
Cap rate
0.5%
Rent to Value Ratio

Active
$424,900
4
bds
|
3
ba
|
2,265
sqft
|
built
2023
10104 Clarks Ferry Dr, Baton Rouge, LA 70817
$-353
Cash flow
-4.3%
Cash-on-Cash Return
5.3%
Cap rate
0.7%
Rent to Value Ratio

Active
$685,000
4
bds
|
3
ba
|
2,900
sqft
|
built
1960
735 Dubois Dr, Baton Rouge, LA 70808
$-1,092
Cash flow
-8.3%
Cash-on-Cash Return
4.4%
Cap rate
0.5%
Rent to Value Ratio

Active
$199,000
4
bds
|
4
ba
|
2,450
sqft
|
built
1961
824 Princewood Ct, Baton Rouge, LA 70806
$203
Cash flow
5.3%
Cash-on-Cash Return
7.5%
Cap rate
0.9%
Rent to Value Ratio

Active
$252,000
4
bds
|
3
ba
|
2,669
sqft
|
built
1974
6580 Brownfields Dr, Baton Rouge, LA 70811
$64
Cash flow
1.3%
Cash-on-Cash Return
6.6%
Cap rate
0.8%
Rent to Value Ratio

Active
$189,995
3
bds
|
2
ba
|
2,090
sqft
|
built
1967
1133 Flora Ln, Baton Rouge, LA 70810
$250
Cash flow
6.9%
Cash-on-Cash Return
7.8%
Cap rate
0.9%
Rent to Value Ratio

Pending
$370,000
4
bds
|
3
ba
|
2,433
sqft
|
built
1980
1537 Oakdale Dr, Baton Rouge, LA 70810
$-207
Cash flow
-2.9%
Cash-on-Cash Return
5.6%
Cap rate
0.7%
Rent to Value Ratio

Active
$349,900
3
bds
|
2
ba
|
1,781
sqft
|
built
1998
5140 Summa Ct, Baton Rouge, LA 70809
$-144
Cash flow
-2.1%
Cash-on-Cash Return
5.8%
Cap rate
0.7%
Rent to Value Ratio

Pending
$228,000
4
bds
|
2
ba
|
1,356
sqft
|
built
1986
17531 Brookfield Ave, Baton Rouge, LA 70817
$52
Cash flow
1.2%
Cash-on-Cash Return
6.5%
Cap rate
0.8%
Rent to Value Ratio

Active
$259,900
3
bds
|
3
ba
|
2,140
sqft
|
built
2010
14031 Windwood Dr, Baton Rouge, LA 70816
$-10
Cash flow
-0.2%
Cash-on-Cash Return
6.2%
Cap rate
0.8%
Rent to Value Ratio

Pending
$240,000
3
bds
|
2
ba
|
1,520
sqft
|
built
2003
4056 Northshore Ave, Baton Rouge, LA 70820
$70
Cash flow
1.5%
Cash-on-Cash Return
6.6%
Cap rate
0.8%
Rent to Value Ratio

Active
$274,900
3
bds
|
2
ba
|
2,095
sqft
|
built
1979
12715 Mustang Ave, Baton Rouge, LA 70818
$-55
Cash flow
-1.0%
Cash-on-Cash Return
6.0%
Cap rate
0.7%
Rent to Value Ratio

Active
$600,000
3
bds
|
4
ba
|
2,272
sqft
|
built
1945
606 Leeward Dr, Baton Rouge, LA 70808
$-1,755
Cash flow
-15.3%
Cash-on-Cash Return
2.8%
Cap rate
0.3%
Rent to Value Ratio
Active
$89,000
2
bds
|
2
ba
|
1,135
sqft
|
built
1975
4364 Gurney St, Baton Rouge, LA 70805
$432
Cash flow
25.3%
Cash-on-Cash Return
12.1%
Cap rate
1.5%
Rent to Value Ratio
Active
$759,999
4
bds
|
3
ba
|
3,265
sqft
|
built
2014
9349 Pieta Ln, Baton Rouge, LA 70809
$-921
Cash flow
-6.3%
Cash-on-Cash Return
4.8%
Cap rate
0.6%
Rent to Value Ratio

Active
$395,000
4
bds
|
2
ba
|
1,844
sqft
|
built
2022
14435 Wally Way, Baton Rouge, LA 70810
$-420
Cash flow
-5.5%
Cash-on-Cash Return
5.0%
Cap rate
0.6%
Rent to Value Ratio

Active
$240,000
4
bds
|
3
ba
|
1,910
sqft
|
built
1960
3443 Warren Dr, Baton Rouge, LA 70814
$127
Cash flow
2.8%
Cash-on-Cash Return
6.9%
Cap rate
0.8%
Rent to Value Ratio

Active
$539,000
4
bds
|
3
ba
|
2,704
sqft
|
built
2021
13152 Elissa Ln, Baton Rouge, LA 70818
$-1,768
Cash flow
-17.1%
Cash-on-Cash Return
2.3%
Cap rate
0.3%
Rent to Value Ratio

Active
$310,000
3
bds
|
2
ba
|
1,961
sqft
|
built
1960
4545 Orchid St, Baton Rouge, LA 70808
$-100
Cash flow
-1.7%
Cash-on-Cash Return
5.9%
Cap rate
0.7%
Rent to Value Ratio

Active
$349,900
4
bds
|
3
ba
|
2,304
sqft
|
built
1981
10124 Hillsbury Dr, Baton Rouge, LA 70809
$-105
Cash flow
-1.6%
Cash-on-Cash Return
5.9%
Cap rate
0.7%
Rent to Value Ratio
Pending
$190,000
4
bds
|
2
ba
|
2,004
sqft
|
built
1974
11088 Mollylea Dr, Baton Rouge, LA 70815
$388
Cash flow
10.7%
Cash-on-Cash Return
8.7%
Cap rate
1.1%
Rent to Value Ratio

Pending
$210,000
3
bds
|
2
ba
|
1,688
sqft
|
built
1980
14761 Brightview Ct, Baton Rouge, LA 70819
$146
Cash flow
3.6%
Cash-on-Cash Return
7.1%
Cap rate
0.9%
Rent to Value Ratio

Active
$550,000
3
bds
|
2
ba
|
2,166
sqft
|
built
1950
635 L S U Ave, Baton Rouge, LA 70808
$-1,491
Cash flow
-14.1%
Cash-on-Cash Return
3.0%
Cap rate
0.4%
Rent to Value Ratio
Active
$222,000
3
bds
|
3
ba
|
1,569
sqft
|
built
1995
9827 E Groner Ave, Baton Rouge, LA 70809
$-236
Cash flow
-5.5%
Cash-on-Cash Return
5.0%
Cap rate
0.8%
Rent to Value Ratio

Active
$420,000
4
bds
|
3
ba
|
2,397
sqft
|
built
2020
1220 Shadow Bluff Dr, Baton Rouge, LA 70820
$-984
Cash flow
-12.2%
Cash-on-Cash Return
3.5%
Cap rate
0.4%
Rent to Value Ratio

Active
$4,695,000
5
bds
|
6
ba
|
7,323
sqft
|
built
1992
19421 N Muirfield Cir, Baton Rouge, LA 70810
$-19,818
Cash flow
-22.0%
Cash-on-Cash Return
1.2%
Cap rate
0.2%
Rent to Value Ratio

Pending
$300,000
4
bds
|
3
ba
|
2,367
sqft
|
built
1979
12243 Brookshire Ave, Baton Rouge, LA 70815
$90
Cash flow
1.6%
Cash-on-Cash Return
6.6%
Cap rate
0.8%
Rent to Value Ratio