Boston, MA Investment Properties for Sale
Browse homes for sale and investment properties in Boston, MA. Refine your search by price, property type, or more.
Best cash flowing properties in Boston, MA

Active
$555,000
4
bds
|
2
ba
|
1,100
sqft
|
built
1905
15 Ronan St, Boston, MA 02125
$-1,063
Cash flow
-10.0%
Cash-on-Cash Return
4.0%
Cap rate
0.6%
Rent to Value Ratio
Active
$519,000
1
bds
|
1
ba
|
550
sqft
|
built
1890
115 W 7th St, Boston, MA 02127
$-1,245
Cash flow
-12.5%
Cash-on-Cash Return
3.4%
Cap rate
0.5%
Rent to Value Ratio
761 out of 1,382 properties for sale in Boston, MA
Limited Results Shown
Create a free account, or log in to reveal all property listings and enjoy the complete experience.
Active
$810,000
2
bds
|
1
ba
|
733
sqft
|
built
1899
49 Revere St, Boston, MA 02114
$-3,208
Cash flow
-20.7%
Cash-on-Cash Return
1.6%
Cap rate
0.4%
Rent to Value Ratio
Active
$1,239,000
1
bds
|
1
ba
|
686
sqft
|
built
2019
133 Seaport Blvd, Boston, MA 02210
$-5,382
Cash flow
-22.7%
Cash-on-Cash Return
1.1%
Cap rate
0.4%
Rent to Value Ratio
Active
$875,000
3
bds
|
3
ba
|
1,812
sqft
|
built
2019
60 Starbird Ave, Boston, MA 02131
$-2,592
Cash flow
-15.5%
Cash-on-Cash Return
2.8%
Cap rate
0.4%
Rent to Value Ratio
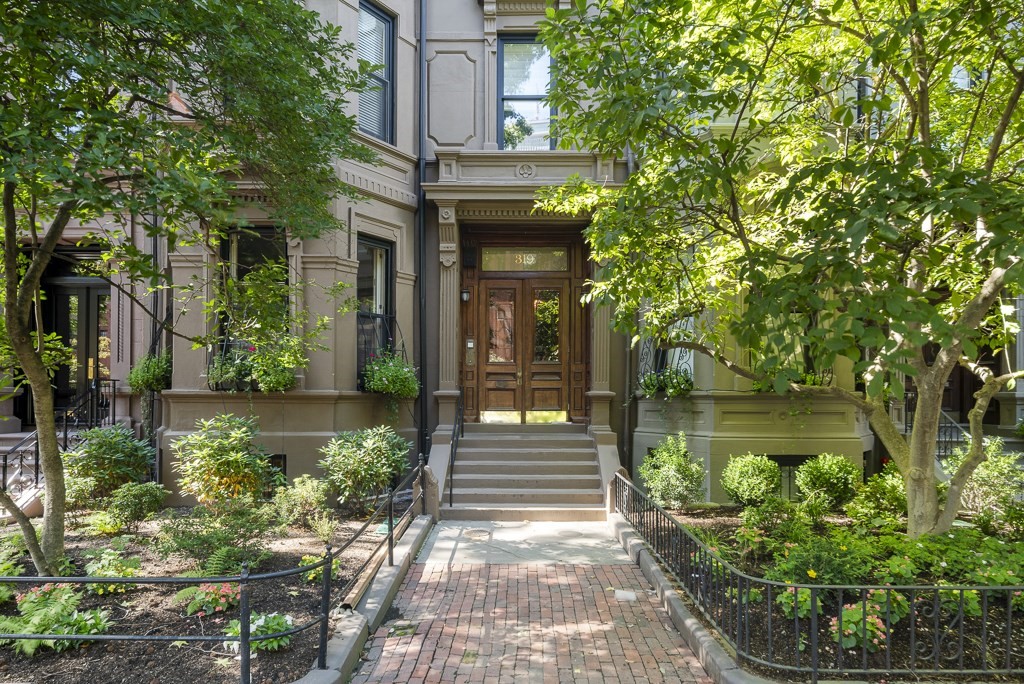
Active
$1,799,000
2
bds
|
2
ba
|
1,153
sqft
|
built
1890
319 Marlborough St, Boston, MA 02116
$-7,915
Cash flow
-23.0%
Cash-on-Cash Return
1.0%
Cap rate
0.3%
Rent to Value Ratio
Active
$535,000
1
bds
|
1
ba
|
703
sqft
|
built
1989
15 N Beacon St, Boston, MA 02134
$-2,292
Cash flow
-22.4%
Cash-on-Cash Return
1.2%
Cap rate
0.5%
Rent to Value Ratio
Active
$799,000
2
bds
|
2
ba
|
1,509
sqft
|
built
2004
3 Avery St, Boston, MA 02111
$-3,961
Cash flow
-25.9%
Cash-on-Cash Return
0.4%
Cap rate
0.6%
Rent to Value Ratio
Active
$850,000
3
bds
|
2
ba
|
1,693
sqft
|
built
2019
9 Cedar St, Boston, MA 02119
$-1,709
Cash flow
-10.5%
Cash-on-Cash Return
3.9%
Cap rate
0.6%
Rent to Value Ratio
Active
$675,000
1
bds
|
1
ba
|
536
sqft
|
built
1890
93 Pinckney St, Boston, MA 02114
$-1,973
Cash flow
-15.3%
Cash-on-Cash Return
2.8%
Cap rate
0.5%
Rent to Value Ratio
Active
$2,850,000
3
bds
|
3
ba
|
2,023
sqft
|
built
1905
151 Beacon St, Boston, MA 02116
$-10,134
Cash flow
-18.6%
Cash-on-Cash Return
2.0%
Cap rate
0.4%
Rent to Value Ratio
Active
$495,000
1
bds
|
1
ba
|
968
sqft
|
built
1894
35 Nonantum St, Boston, MA 02135
$-1,577
Cash flow
-16.6%
Cash-on-Cash Return
2.5%
Cap rate
0.6%
Rent to Value Ratio
Active
$550,000
2
bds
|
1
ba
|
821
sqft
|
built
1947
130 Sutherland Rd, Boston, MA 02135
$-2,122
Cash flow
-20.1%
Cash-on-Cash Return
1.7%
Cap rate
0.5%
Rent to Value Ratio
Active
$949,000
2
bds
|
1
ba
|
930
sqft
|
built
1899
30 Edgerly Rd, Boston, MA 02115
$-2,944
Cash flow
-16.2%
Cash-on-Cash Return
2.6%
Cap rate
0.5%
Rent to Value Ratio
Active
$649,000
2
bds
|
1
ba
|
1,166
sqft
|
built
1925
11 Goodway Rd, Boston, MA 02130
$-1,798
Cash flow
-14.5%
Cash-on-Cash Return
3.0%
Cap rate
0.5%
Rent to Value Ratio
Active
$419,000
1
bds
|
1
ba
|
675
sqft
|
built
1910
72 Strathmore Rd, Boston, MA 02135
$-1,277
Cash flow
-15.9%
Cash-on-Cash Return
2.7%
Cap rate
0.6%
Rent to Value Ratio
Active
$849,000
2
bds
|
2
ba
|
1,607
sqft
|
built
1851
414 Sumner St, Boston, MA 02128
$-3,067
Cash flow
-18.8%
Cash-on-Cash Return
2.0%
Cap rate
0.4%
Rent to Value Ratio
Active
$485,000
0
bds
|
1
ba
|
463
sqft
|
built
1899
42 8th St, Boston, MA 02129
$-1,593
Cash flow
-17.1%
Cash-on-Cash Return
2.4%
Cap rate
0.6%
Rent to Value Ratio
Active
$2,495,000
3
bds
|
2
ba
|
2,011
sqft
|
built
1900
130 Fulton St, Boston, MA 02109
$-10,855
Cash flow
-22.7%
Cash-on-Cash Return
1.1%
Cap rate
0.3%
Rent to Value Ratio
Active
$519,000
1
bds
|
1
ba
|
550
sqft
|
built
1890
115 W 7th St, Boston, MA 02127
$-1,245
Cash flow
-12.5%
Cash-on-Cash Return
3.4%
Cap rate
0.5%
Rent to Value Ratio
Active
$509,000
1
bds
|
1
ba
|
461
sqft
|
built
1880
9 Hancock St, Boston, MA 02114
$-1,672
Cash flow
-17.1%
Cash-on-Cash Return
2.4%
Cap rate
0.5%
Rent to Value Ratio
Active
$549,000
1
bds
|
1
ba
|
450
sqft
|
built
1890
12 Fayette St, Boston, MA 02116
$-1,674
Cash flow
-15.9%
Cash-on-Cash Return
2.7%
Cap rate
0.5%
Rent to Value Ratio
Active
$555,000
4
bds
|
2
ba
|
1,100
sqft
|
built
1905
15 Ronan St, Boston, MA 02125
$-1,063
Cash flow
-10.0%
Cash-on-Cash Return
4.0%
Cap rate
0.6%
Rent to Value Ratio
Active
$1,075,000
2
bds
|
1
ba
|
1,130
sqft
|
built
1930
15 Blackwood St, Boston, MA 02115
$-3,530
Cash flow
-17.1%
Cash-on-Cash Return
2.4%
Cap rate
0.4%
Rent to Value Ratio
Active
$1,235,000
2
bds
|
3
ba
|
1,435
sqft
|
built
2017
288 Marginal St, Boston, MA 02128
$-4,989
Cash flow
-21.1%
Cash-on-Cash Return
1.5%
Cap rate
0.4%
Rent to Value Ratio
Active
$725,000
2
bds
|
2
ba
|
1,000
sqft
|
built
1920
70 Webster St, Boston, MA 02128
$-2,219
Cash flow
-16.0%
Cash-on-Cash Return
2.6%
Cap rate
0.4%
Rent to Value Ratio
Active
$900,000
1
bds
|
1
ba
|
974
sqft
|
built
1878
175 Commonwealth Ave, Boston, MA 02116
$-2,982
Cash flow
-17.3%
Cash-on-Cash Return
2.3%
Cap rate
0.5%
Rent to Value Ratio
Active
$599,000
1
bds
|
1
ba
|
865
sqft
|
built
1920
51 Park Dr, Boston, MA 02215
$-2,208
Cash flow
-19.2%
Cash-on-Cash Return
1.9%
Cap rate
0.5%
Rent to Value Ratio
Active
$499,000
1
bds
|
1
ba
|
500
sqft
|
built
2015
45 1st Ave, Boston, MA 02129
$-1,607
Cash flow
-16.8%
Cash-on-Cash Return
2.5%
Cap rate
0.6%
Rent to Value Ratio
Active
$1,495,000
2
bds
|
2
ba
|
1,370
sqft
|
built
2013
580 Washington St, Boston, MA 02111
$-3,784
Cash flow
-13.2%
Cash-on-Cash Return
3.3%
Cap rate
0.5%
Rent to Value Ratio
Active
$485,000
bds
|
1
ba
|
439
sqft
|
built
2020
99 Sumner St, Boston, MA 02128
$-1,667
Cash flow
-17.9%
Cash-on-Cash Return
2.2%
Cap rate
0.5%
Rent to Value Ratio
Active
$1,280,000
1
bds
|
2
ba
|
1,229
sqft
|
built
2004
25 Channel Ctr St, Boston, MA 02210
$-4,414
Cash flow
-18.0%
Cash-on-Cash Return
2.2%
Cap rate
0.5%
Rent to Value Ratio
Active
$999,000
2
bds
|
2
ba
|
1,082
sqft
|
built
2020
20 W 5th St, Boston, MA 02127
$-3,679
Cash flow
-19.2%
Cash-on-Cash Return
1.9%
Cap rate
0.5%
Rent to Value Ratio
Active
$795,000
1
bds
|
1
ba
|
616
sqft
|
built
1890
17 Dwight St, Boston, MA 02118
$-2,277
Cash flow
-14.9%
Cash-on-Cash Return
2.9%
Cap rate
0.5%
Rent to Value Ratio
Active
$699,000
1
bds
|
1
ba
|
650
sqft
|
built
1865
12 Lindall Pl, Boston, MA 02114
$-1,982
Cash flow
-14.8%
Cash-on-Cash Return
2.9%
Cap rate
0.5%
Rent to Value Ratio
Active
$725,000
2
bds
|
3
ba
|
1,200
sqft
|
built
1900
187 London St, Boston, MA 02128
$-1,894
Cash flow
-13.6%
Cash-on-Cash Return
3.2%
Cap rate
0.5%
Rent to Value Ratio
Active
$850,000
5
bds
|
2
ba
|
1,732
sqft
|
built
1899
14 Horace St, Boston, MA 02128
$-2,360
Cash flow
-14.5%
Cash-on-Cash Return
3.0%
Cap rate
0.5%
Rent to Value Ratio
Active
$975,000
1
bds
|
1
ba
|
799
sqft
|
built
2013
580 Washington St, Boston, MA 02111
$-3,349
Cash flow
-17.9%
Cash-on-Cash Return
2.2%
Cap rate
0.5%
Rent to Value Ratio
Active
$849,000
2
bds
|
1
ba
|
641
sqft
|
built
1935
80 E Brookline St, Boston, MA 02118
$-2,674
Cash flow
-16.4%
Cash-on-Cash Return
2.5%
Cap rate
0.4%
Rent to Value Ratio
Active
$2,595,000
2
bds
|
2
ba
|
1,754
sqft
|
built
1855
343 Commercial St, Boston, MA 02109
$-11,295
Cash flow
-22.7%
Cash-on-Cash Return
1.1%
Cap rate
0.3%
Rent to Value Ratio

Active
$899,000
5
bds
|
2
ba
|
1,950
sqft
|
built
1900
27 Chilcott Pl, Boston, MA 02130
$-2,091
Cash flow
-12.1%
Cash-on-Cash Return
3.5%
Cap rate
0.6%
Rent to Value Ratio
Active
$3,679,000
2
bds
|
3
ba
|
1,811
sqft
|
built
2019
300 Pier 4 Blvd, Boston, MA 02210
$-18,345
Cash flow
-26.0%
Cash-on-Cash Return
0.3%
Cap rate
0.3%
Rent to Value Ratio