Boston, MA Investment Properties for Sale
Browse homes for sale and investment properties in Boston, MA. Refine your search by price, property type, or more.
Best cash flowing properties in Boston, MA
Active under contract
$199,900
1
bds
|
1
ba
|
650
sqft
|
built
1960
175 Clare Ave, Boston, MA 02136
$-194
Cash flow
-5.1%
Cash-on-Cash Return
5.1%
Cap rate
1.1%
Rent to Value Ratio
Pending
$599,000
3
bds
|
2
ba
|
1,492
sqft
|
built
1950
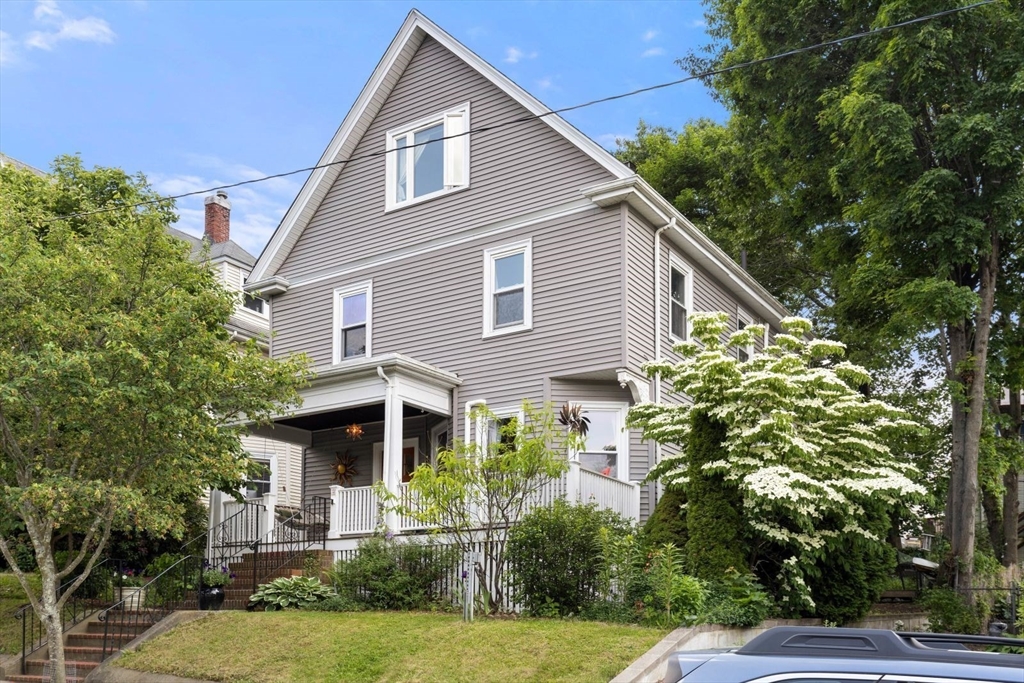
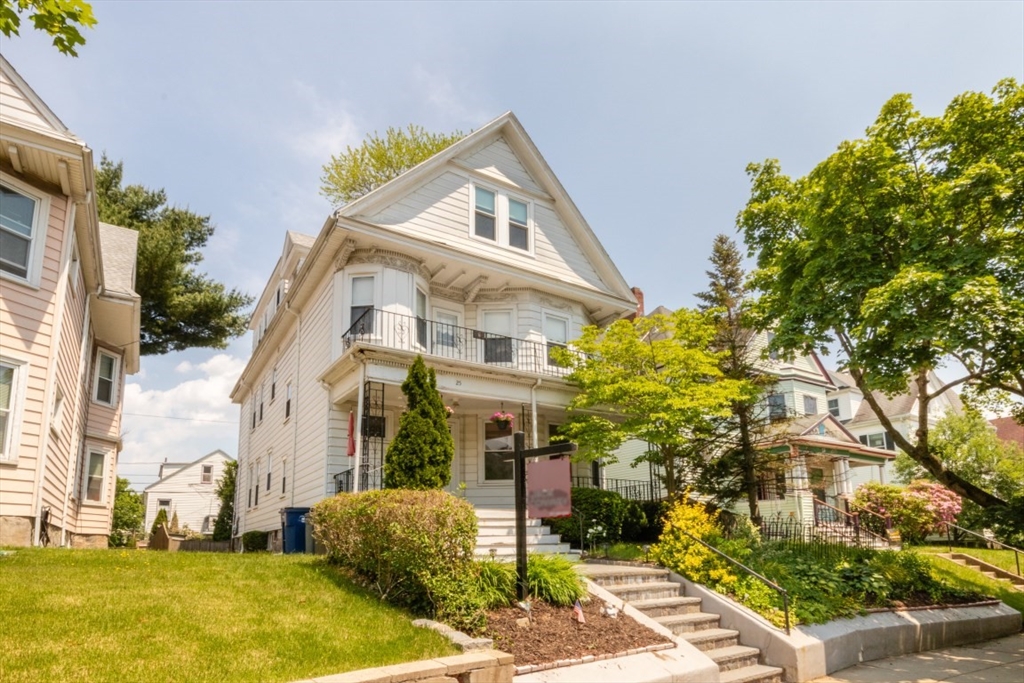
25 Grandview St, Boston, MA 02131
$-956
Cash flow
-8.3%
Cash-on-Cash Return
4.3%
Cap rate
0.6%
Rent to Value Ratio
1,049 out of 1,672 properties for sale in Boston, MA
Limited Results Shown
Create a free account, or log in to reveal all property listings and enjoy the complete experience.
Pending
$599,000
3
bds
|
2
ba
|
1,492
sqft
|
built
1950
25 Grandview St, Boston, MA 02131
$-956
Cash flow
-8.3%
Cash-on-Cash Return
4.3%
Cap rate
0.6%
Rent to Value Ratio
Active under contract
$600,000
2
bds
|
1
ba
|
1,112
sqft
|
built
1910
301 Allston St, Boston, MA 02135
$-2,214
Cash flow
-19.3%
Cash-on-Cash Return
1.8%
Cap rate
0.5%
Rent to Value Ratio
Active
$1,195,000
4
bds
|
2
ba
|
1,953
sqft
|
built
1926
51 Southbourne Rd, Boston, MA 02130
$-3,668
Cash flow
-16.0%
Cash-on-Cash Return
2.6%
Cap rate
0.4%
Rent to Value Ratio
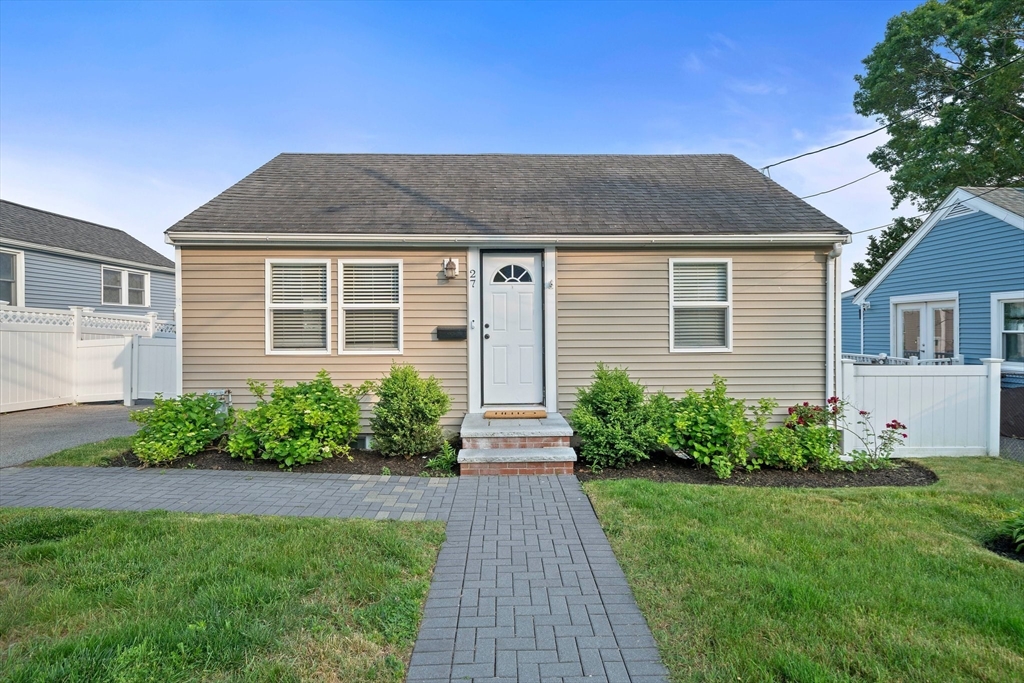
Active
$630,000
2
bds
|
1
ba
|
1,188
sqft
|
built
1940
27 Hallron St, Boston, MA 02136
$-1,641
Cash flow
-13.6%
Cash-on-Cash Return
3.1%
Cap rate
0.5%
Rent to Value Ratio
Active
$1,249,000
2
bds
|
2
ba
|
1,035
sqft
|
built
2009
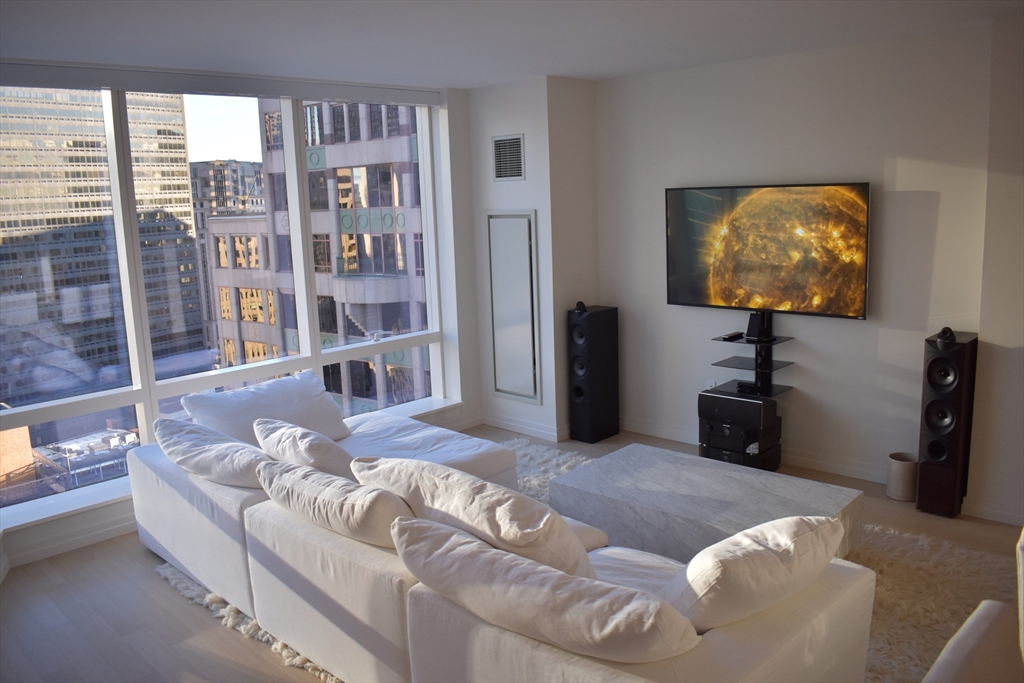
110 Stuart St, Boston, MA 02116
$-5,240
Cash flow
-21.9%
Cash-on-Cash Return
1.2%
Cap rate
0.4%
Rent to Value Ratio
Active
$1,275,000
2
bds
|
2
ba
|
1,075
sqft
|
built
2020
45 Lewis St, Boston, MA 02128
$-4,332
Cash flow
-17.7%
Cash-on-Cash Return
2.2%
Cap rate
0.4%
Rent to Value Ratio
Active
$699,000
1
bds
|
1
ba
|
802
sqft
|
built
2002
300 Allston St, Boston, MA 02135
$-2,628
Cash flow
-19.6%
Cash-on-Cash Return
1.8%
Cap rate
0.4%
Rent to Value Ratio
Pending
$899,000
6
bds
|
2
ba
|
2,151
sqft
|
built
1910
43 Bradwood St, Boston, MA 02131
$-2,388
Cash flow
-13.9%
Cash-on-Cash Return
3.1%
Cap rate
0.5%
Rent to Value Ratio
Active under contract
$1,249,900
7
bds
|
3
ba
|
3,566
sqft
|
built
1895
25 Congreve St, Boston, MA 02131
$-4,945
Cash flow
-20.6%
Cash-on-Cash Return
1.5%
Cap rate
0.3%
Rent to Value Ratio
Active
$2,499,000
5
bds
|
4
ba
|
3,618
sqft
|
built
1885
782 E 4th St, Boston, MA 02127
$-9,479
Cash flow
-19.8%
Cash-on-Cash Return
1.7%
Cap rate
0.3%
Rent to Value Ratio
Active
$869,000
2
bds
|
2
ba
|
1,330
sqft
|
built
2021
45 Dorset St, Boston, MA 02125
$-2,966
Cash flow
-17.8%
Cash-on-Cash Return
2.2%
Cap rate
0.4%
Rent to Value Ratio
Active
$1,199,999
4
bds
|
2
ba
|
1,580
sqft
|
built
1900
69 Hopedale St, Boston, MA 02134
$-3,467
Cash flow
-15.1%
Cash-on-Cash Return
2.8%
Cap rate
0.4%
Rent to Value Ratio
Active
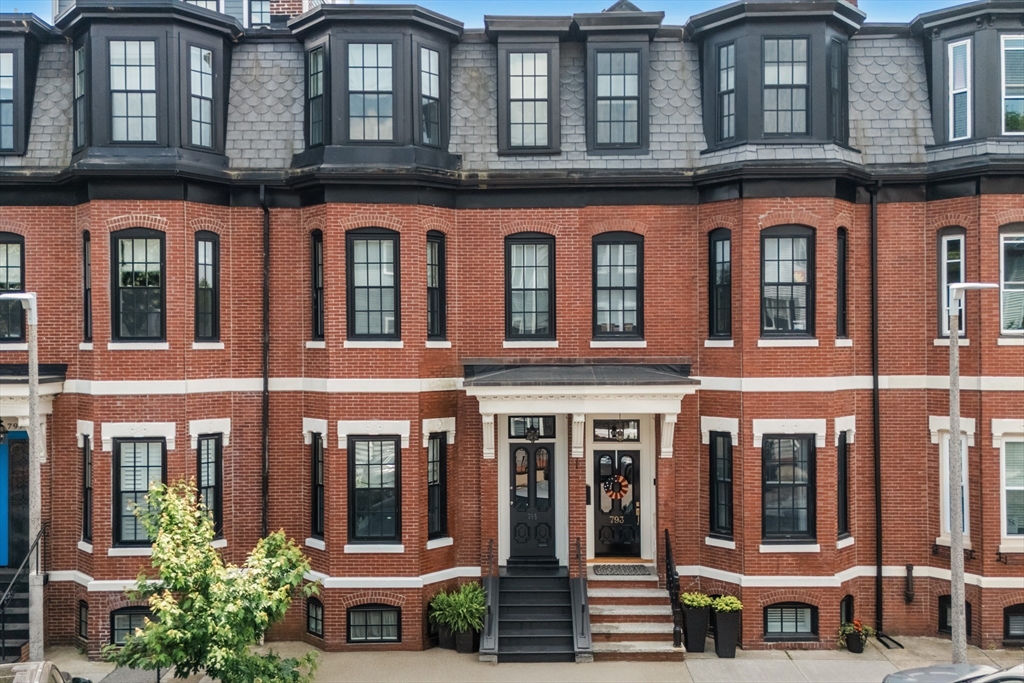
$2,800,000
4
bds
|
4
ba
|
2,783
sqft
|
built
1910
795 E 4th St, Boston, MA 02127
$-10,989
Cash flow
-20.5%
Cash-on-Cash Return
1.6%
Cap rate
0.3%
Rent to Value Ratio
Active
$749,000
2
bds
|
1
ba
|
857
sqft
|
built
1905
10 Peters St, Boston, MA 02127
$-1,889
Cash flow
-13.2%
Cash-on-Cash Return
3.2%
Cap rate
0.5%
Rent to Value Ratio
Active under contract
$1,599,000
5
bds
|
3
ba
|
2,458
sqft
|
built
1888
10 John A Andrew St, Boston, MA 02130
$-5,302
Cash flow
-17.3%
Cash-on-Cash Return
2.3%
Cap rate
0.4%
Rent to Value Ratio
Active under contract
$979,000
3
bds
|
3
ba
|
1,634
sqft
|
built
1993
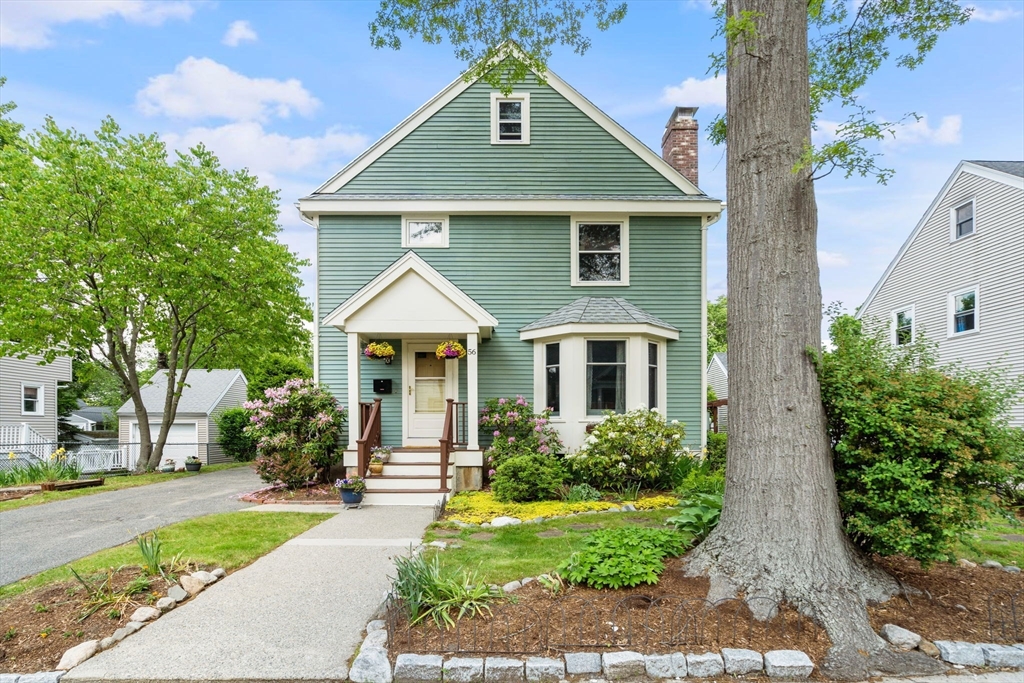
56 Wren St, Boston, MA 02132
$-2,929
Cash flow
-15.6%
Cash-on-Cash Return
2.7%
Cap rate
0.4%
Rent to Value Ratio
Active under contract
$1,689,000
10
bds
|
7
ba
|
6,109
sqft
|
built
1900
108 Homestead St, Boston, MA 02121
$-6,527
Cash flow
-20.2%
Cash-on-Cash Return
1.6%
Cap rate
0.3%
Rent to Value Ratio
Active
$605,000
2
bds
|
1
ba
|
807
sqft
|
built
1910
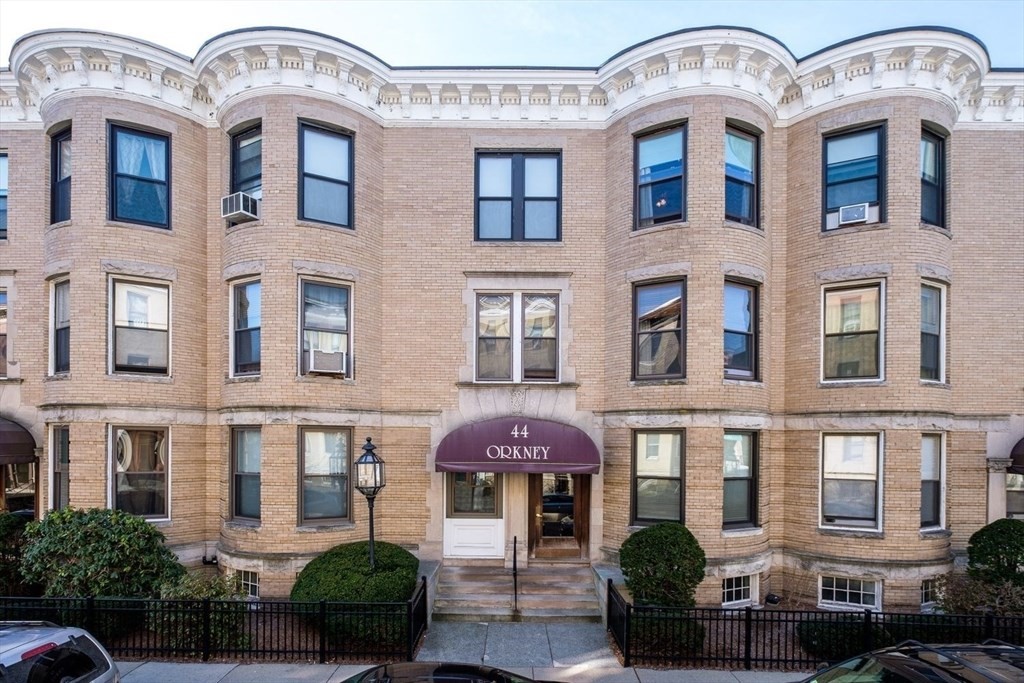
44 Orkney Rd, Boston, MA 02135
$-2,269
Cash flow
-19.6%
Cash-on-Cash Return
1.8%
Cap rate
0.5%
Rent to Value Ratio
Active
$599,900
2
bds
|
1
ba
|
840
sqft
|
built
1900
269 Webster St, Boston, MA 02128
$-1,608
Cash flow
-14.0%
Cash-on-Cash Return
3.0%
Cap rate
0.5%
Rent to Value Ratio
Active
$475,000
2
bds
|
1
ba
|
846
sqft
|
built
1940
114 Strathmore Rd, Boston, MA 02135
$-1,648
Cash flow
-18.1%
Cash-on-Cash Return
2.1%
Cap rate
0.5%
Rent to Value Ratio
Active
$1,350,000
2
bds
|
2
ba
|
1,140
sqft
|
built
2013
580 Washington St, Boston, MA 02111
$-5,474
Cash flow
-21.2%
Cash-on-Cash Return
1.4%
Cap rate
0.5%
Rent to Value Ratio
Active
$2,700,000
2
bds
|
3
ba
|
1,338
sqft
|
built
2022
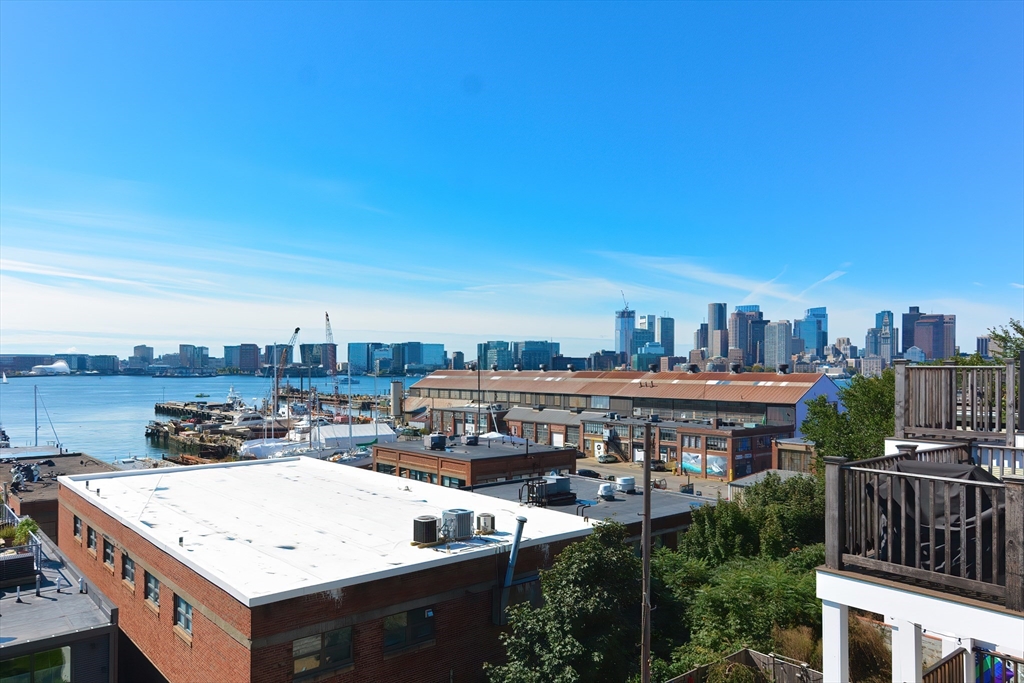
150 Seaport Blvd, Boston, MA 02210
$-14,267
Cash flow
-27.6%
Cash-on-Cash Return
-0.1%
Cap rate
0.3%
Rent to Value Ratio
Pending
$3,995,000
2
bds
|
3
ba
|
2,080
sqft
|
built
1868
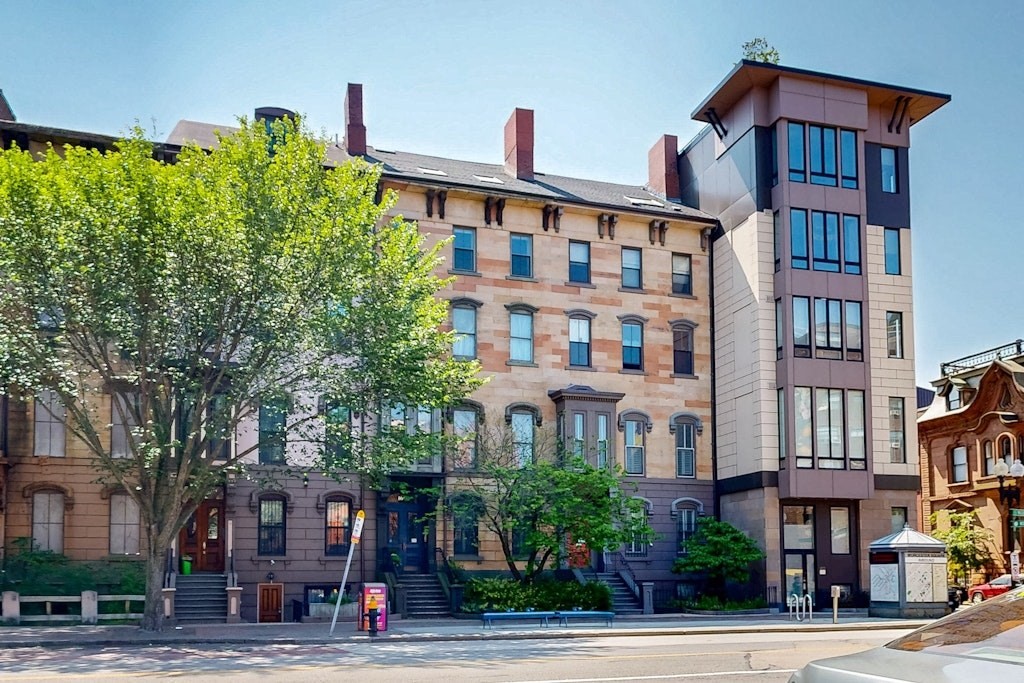
128 Marlborough St, Boston, MA 02116
$-19,715
Cash flow
-25.7%
Cash-on-Cash Return
0.3%
Cap rate
0.2%
Rent to Value Ratio
Pending
$429,000
2
bds
|
1
ba
|
671
sqft
|
built
1920
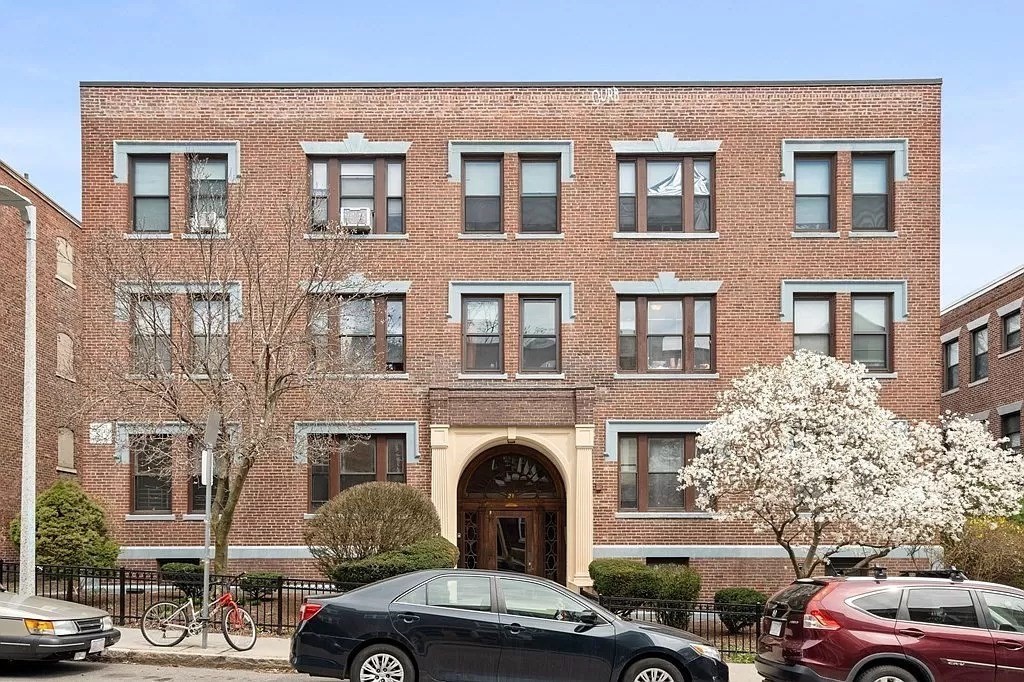
75 Strathmore Rd, Boston, MA 02135
$-1,013
Cash flow
-12.3%
Cash-on-Cash Return
3.4%
Cap rate
0.7%
Rent to Value Ratio
Pending
$899,000
3
bds
|
2
ba
|
1,818
sqft
|
built
1900
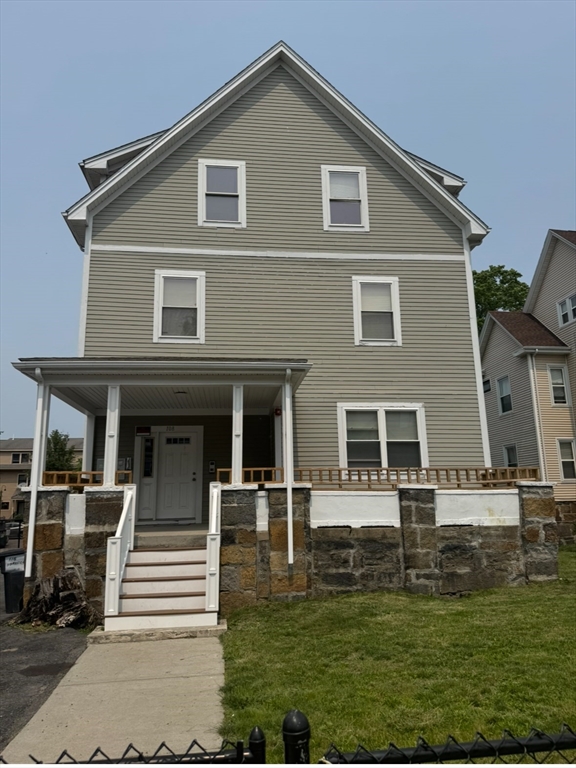
100 Maple St, Boston, MA 02121
$-2,728
Cash flow
-15.8%
Cash-on-Cash Return
2.6%
Cap rate
0.4%
Rent to Value Ratio

Active
$1,279,000
2
bds
|
3
ba
|
1,396
sqft
|
built
2012
242 Shawmut Ave, Boston, MA 02118
$-4,336
Cash flow
-17.7%
Cash-on-Cash Return
2.2%
Cap rate
0.4%
Rent to Value Ratio
Pending
$5,250,000
3
bds
|
3
ba
|
2,315
sqft
|
built
2021
110 Sudbury St, Boston, MA 02114
$-28,488
Cash flow
-28.3%
Cash-on-Cash Return
-0.2%
Cap rate
0.2%
Rent to Value Ratio
Active
$1,699,000
4
bds
|
3
ba
|
2,268
sqft
|
built
1890
874 E 2nd St, Boston, MA 02127
$-6,650
Cash flow
-20.4%
Cash-on-Cash Return
1.6%
Cap rate
0.3%
Rent to Value Ratio
Active
$1,295,000
4
bds
|
4
ba
|
2,533
sqft
|
built
2025
349 Baker St, Boston, MA 02132
$-5,476
Cash flow
-22.1%
Cash-on-Cash Return
1.2%
Cap rate
0.2%
Rent to Value Ratio
Active
$420,000
2
bds
|
1
ba
|
845
sqft
|
built
1963
5 Cass St, Boston, MA 02132
$-1,249
Cash flow
-15.5%
Cash-on-Cash Return
2.7%
Cap rate
0.6%
Rent to Value Ratio
Active
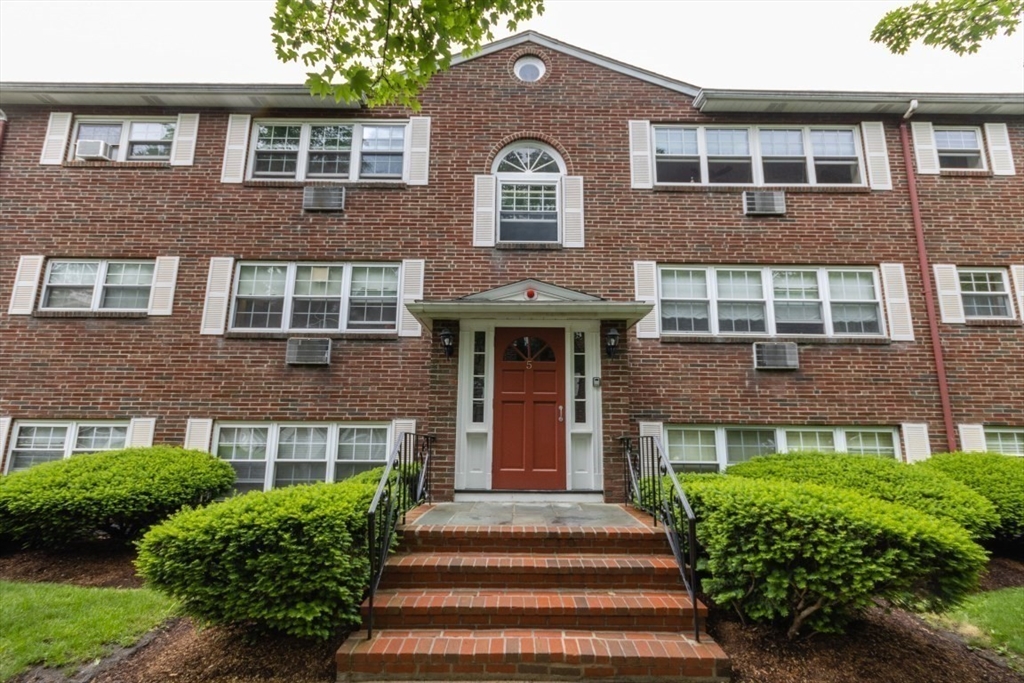
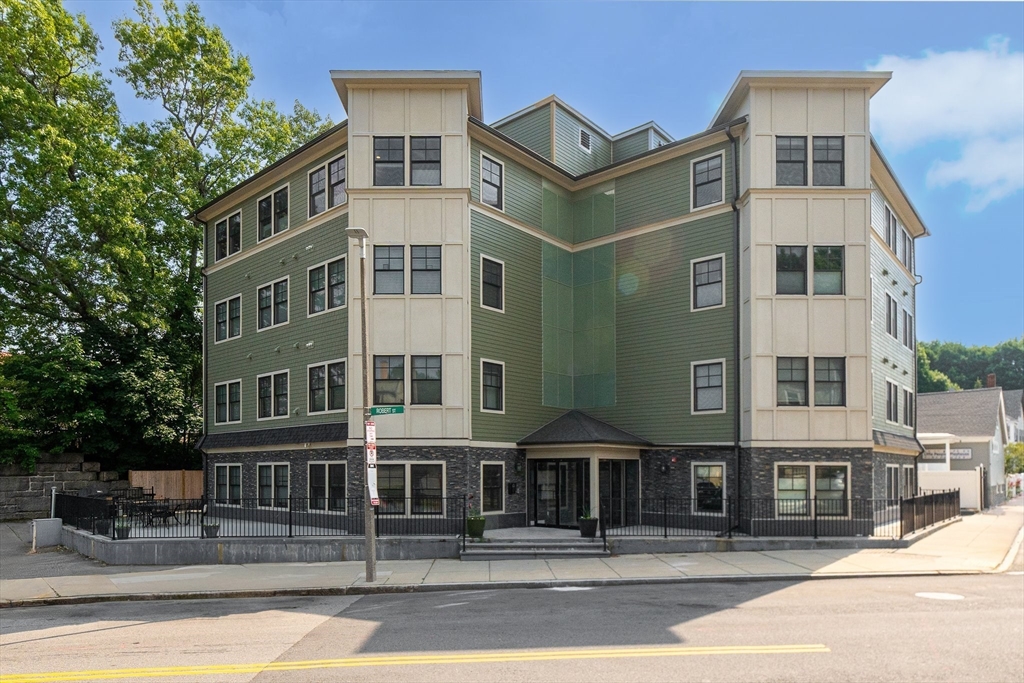
$615,000
2
bds
|
2
ba
|
965
sqft
|
built
2015
18 Robert St, Boston, MA 02131
$-2,110
Cash flow
-17.9%
Cash-on-Cash Return
2.1%
Cap rate
0.5%
Rent to Value Ratio
Active under contract
$1,499,000
4
bds
|
3
ba
|
1,682
sqft
|
built
1890
576 E 8th St, Boston, MA 02127
$-4,650
Cash flow
-16.2%
Cash-on-Cash Return
2.5%
Cap rate
0.4%
Rent to Value Ratio
Active
$1,099,000
2
bds
|
2
ba
|
1,273
sqft
|
built
1875
823 E Broadway, Boston, MA 02127
$-4,008
Cash flow
-19.0%
Cash-on-Cash Return
1.9%
Cap rate
0.4%
Rent to Value Ratio
Active
$4,895,000
3
bds
|
4
ba
|
2,550
sqft
|
built
1900
8 Rutland Sq, Boston, MA 02118
$-21,894
Cash flow
-23.3%
Cash-on-Cash Return
0.9%
Cap rate
0.2%
Rent to Value Ratio
Active
$3,250,000
3
bds
|
3
ba
|
2,183
sqft
|
built
1901
255 Commonwealth Ave, Boston, MA 02116
$-13,852
Cash flow
-22.2%
Cash-on-Cash Return
1.2%
Cap rate
0.3%
Rent to Value Ratio
Active
$690,000
2
bds
|
1
ba
|
610
sqft
|
built
1850
11 Revere St, Boston, MA 02114
$-2,386
Cash flow
-18.0%
Cash-on-Cash Return
2.1%
Cap rate
0.5%
Rent to Value Ratio
Active under contract
$199,900
1
bds
|
1
ba
|
650
sqft
|
built
1960
175 Clare Ave, Boston, MA 02136
$-194
Cash flow
-5.1%
Cash-on-Cash Return
5.1%
Cap rate
1.1%
Rent to Value Ratio
Active
$1,300,000
1
bds
|
1
ba
|
873
sqft
|
built
2016
1 Franklin St, Boston, MA 02110
$-5,150
Cash flow
-20.7%
Cash-on-Cash Return
1.5%
Cap rate
0.4%
Rent to Value Ratio
Active
$1,750,000
3
bds
|
3
ba
|
1,646
sqft
|
built
1899
1666 Washington St, Boston, MA 02118
$-6,253
Cash flow
-18.6%
Cash-on-Cash Return
2.0%
Cap rate
0.4%
Rent to Value Ratio
Active
$649,700
3
bds
|
2
ba
|
780
sqft
|
built
1910
21 Park Vale Ave, Boston, MA 02134
$-2,260
Cash flow
-18.1%
Cash-on-Cash Return
2.1%
Cap rate
0.5%
Rent to Value Ratio