Boynton Beach, FL Investment Properties for Sale
Browse homes for sale and investment properties in Boynton Beach, FL. Refine your search by price, property type, or more.
Best cash flowing properties in Boynton Beach, FL
Active
$139,000
1
bds
|
2
ba
|
1,022
sqft
|
built
1968
312 NE 17th Ave, Boynton Beach, FL 33435
$-62
Cash flow
-2.3%
Cash-on-Cash Return
5.6%
Cap rate
1.3%
Rent to Value Ratio
Active
$199,900
2
bds
|
2
ba
|
986
sqft
|
built
1980
1901 W Woolbright Rd, Boynton Beach, FL 33426
$-131
Cash flow
-3.4%
Cash-on-Cash Return
5.4%
Cap rate
1.0%
Rent to Value Ratio
188 out of 252 properties for sale in Boynton Beach, FL
Limited Results Shown
Create a free account, or log in to reveal all property listings and enjoy the complete experience.
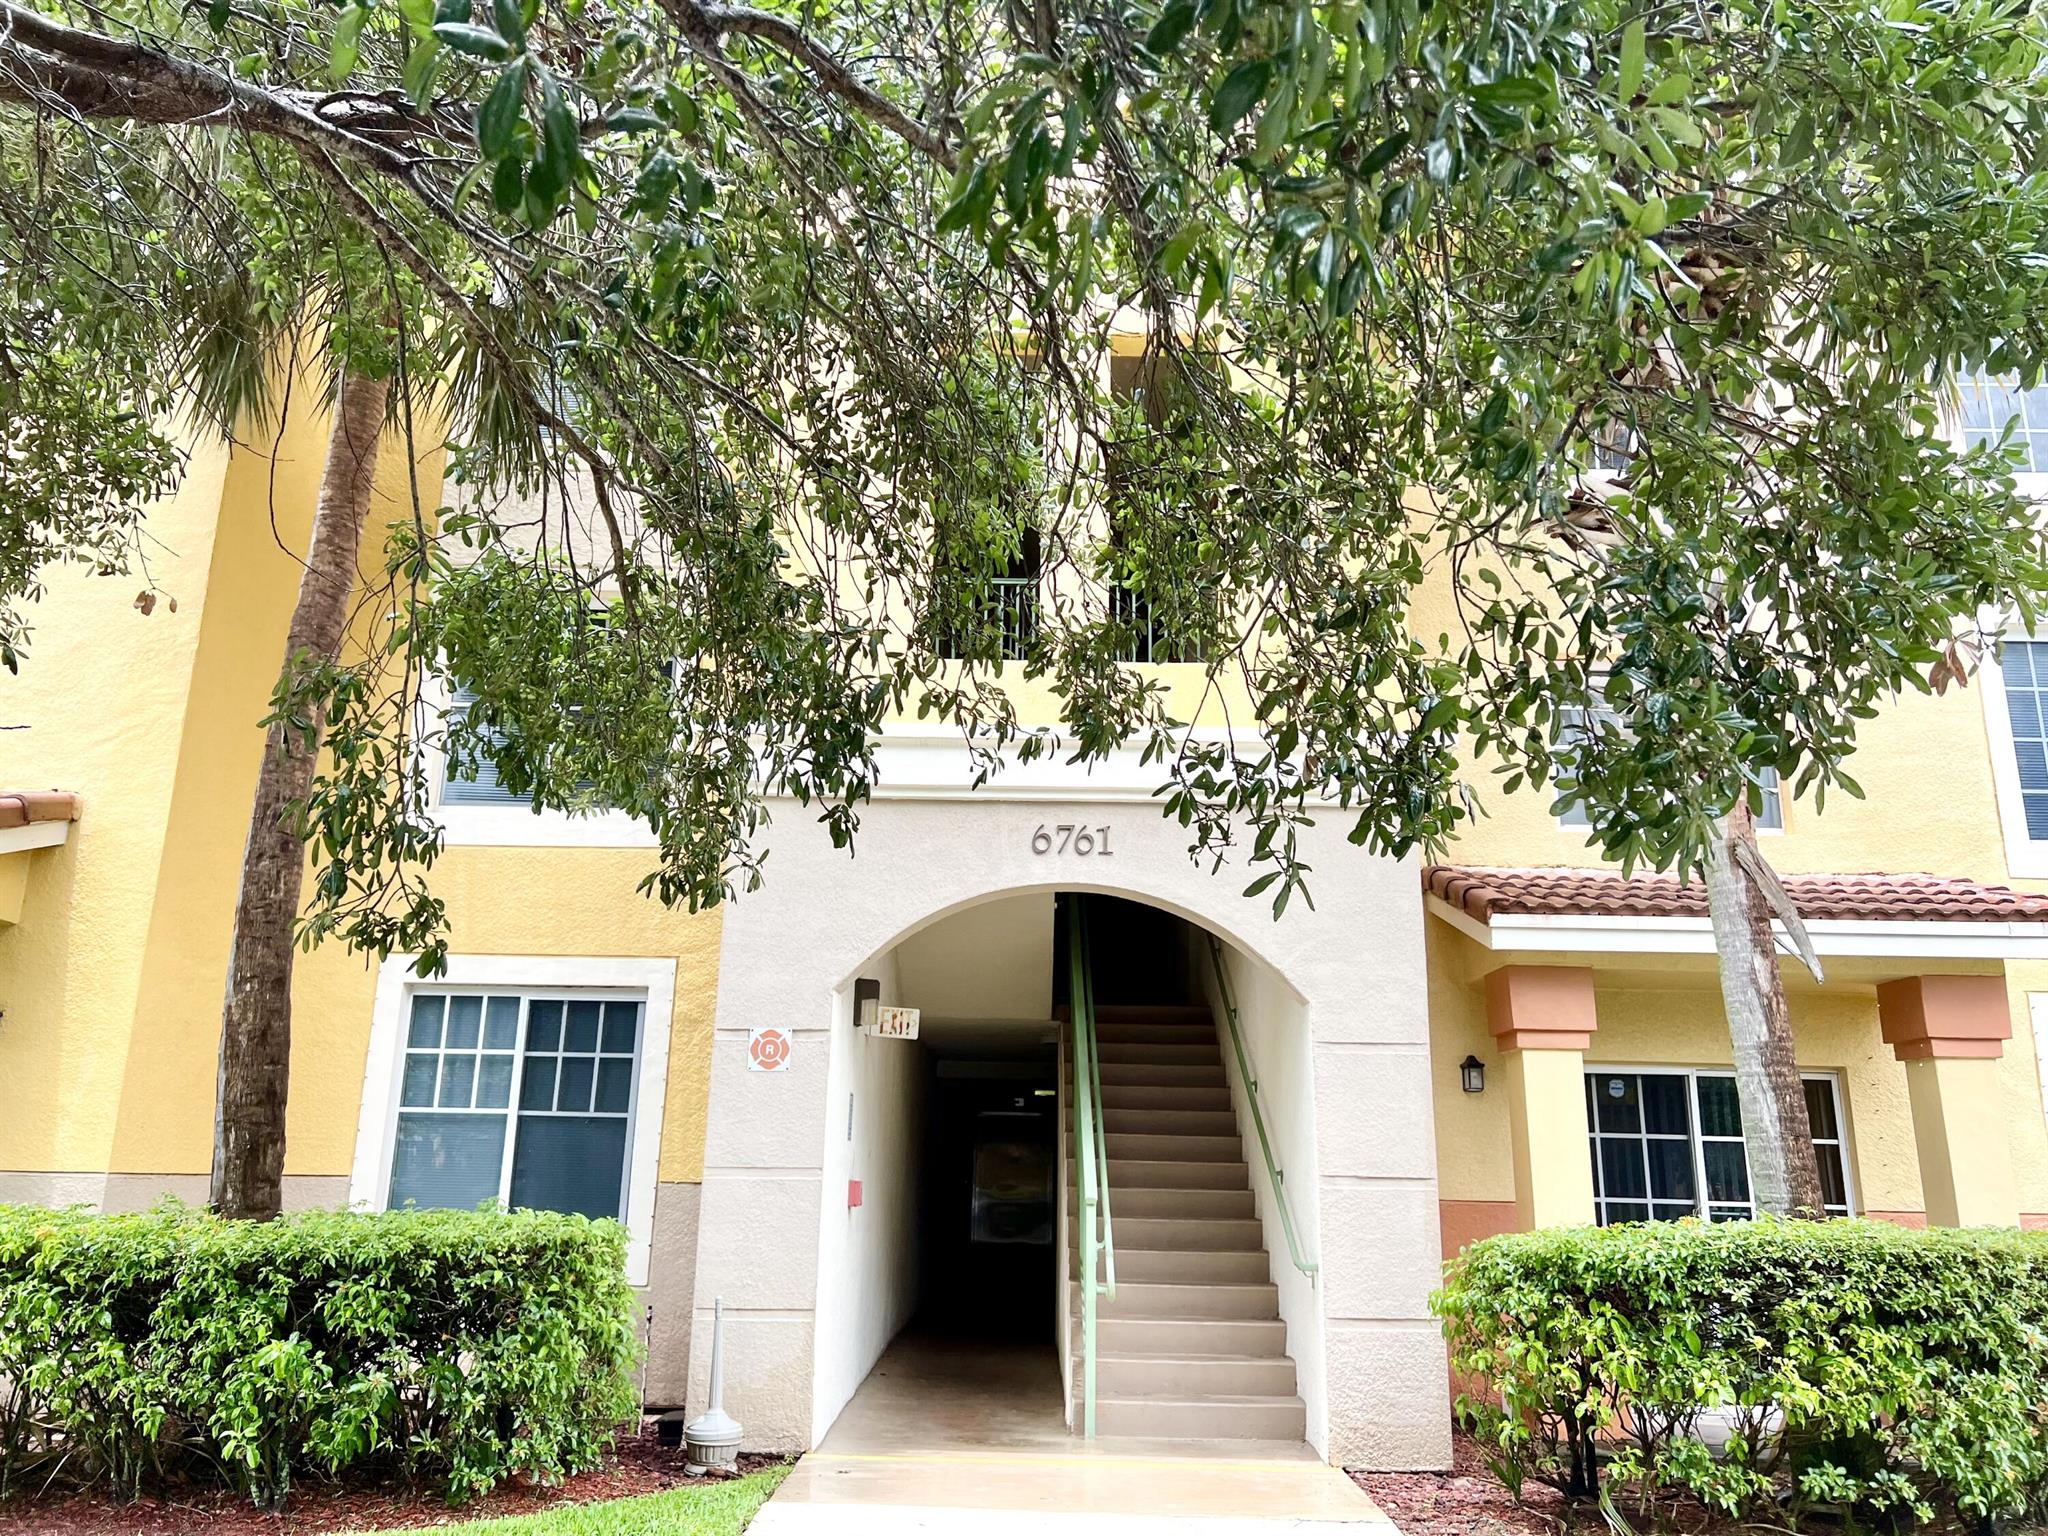
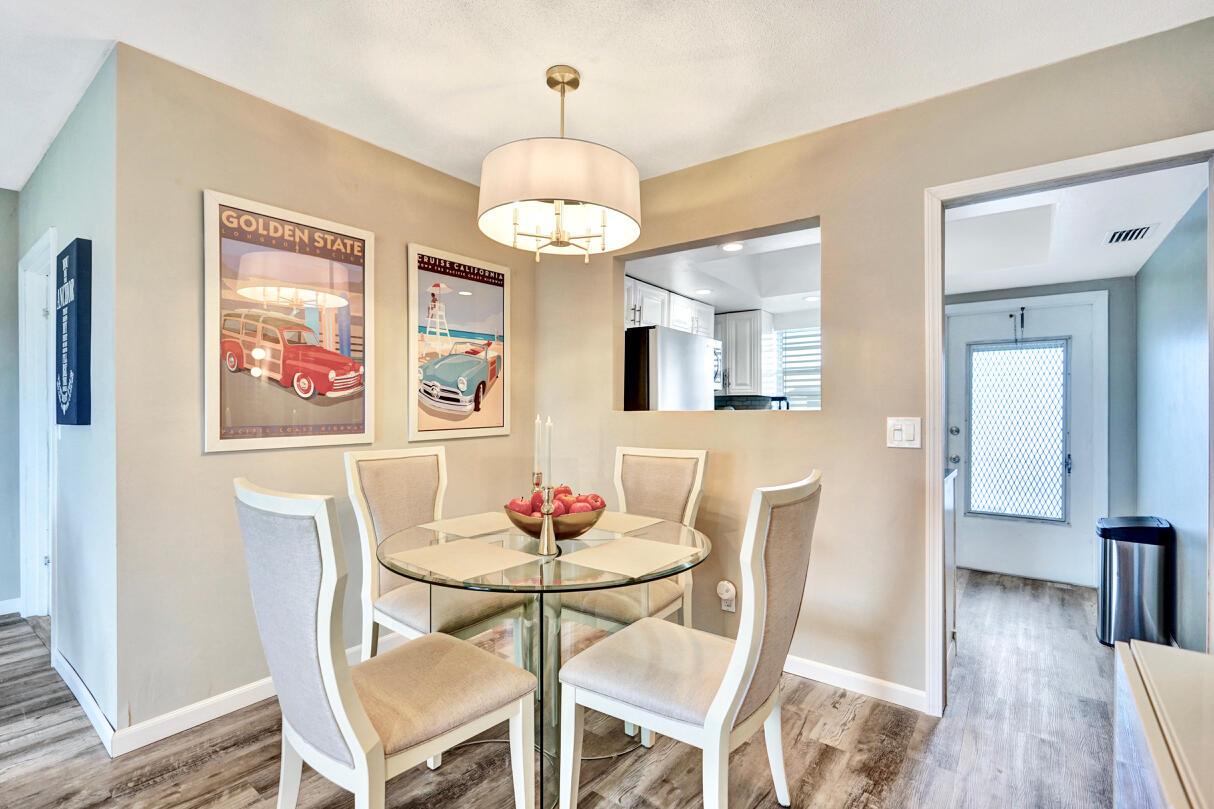
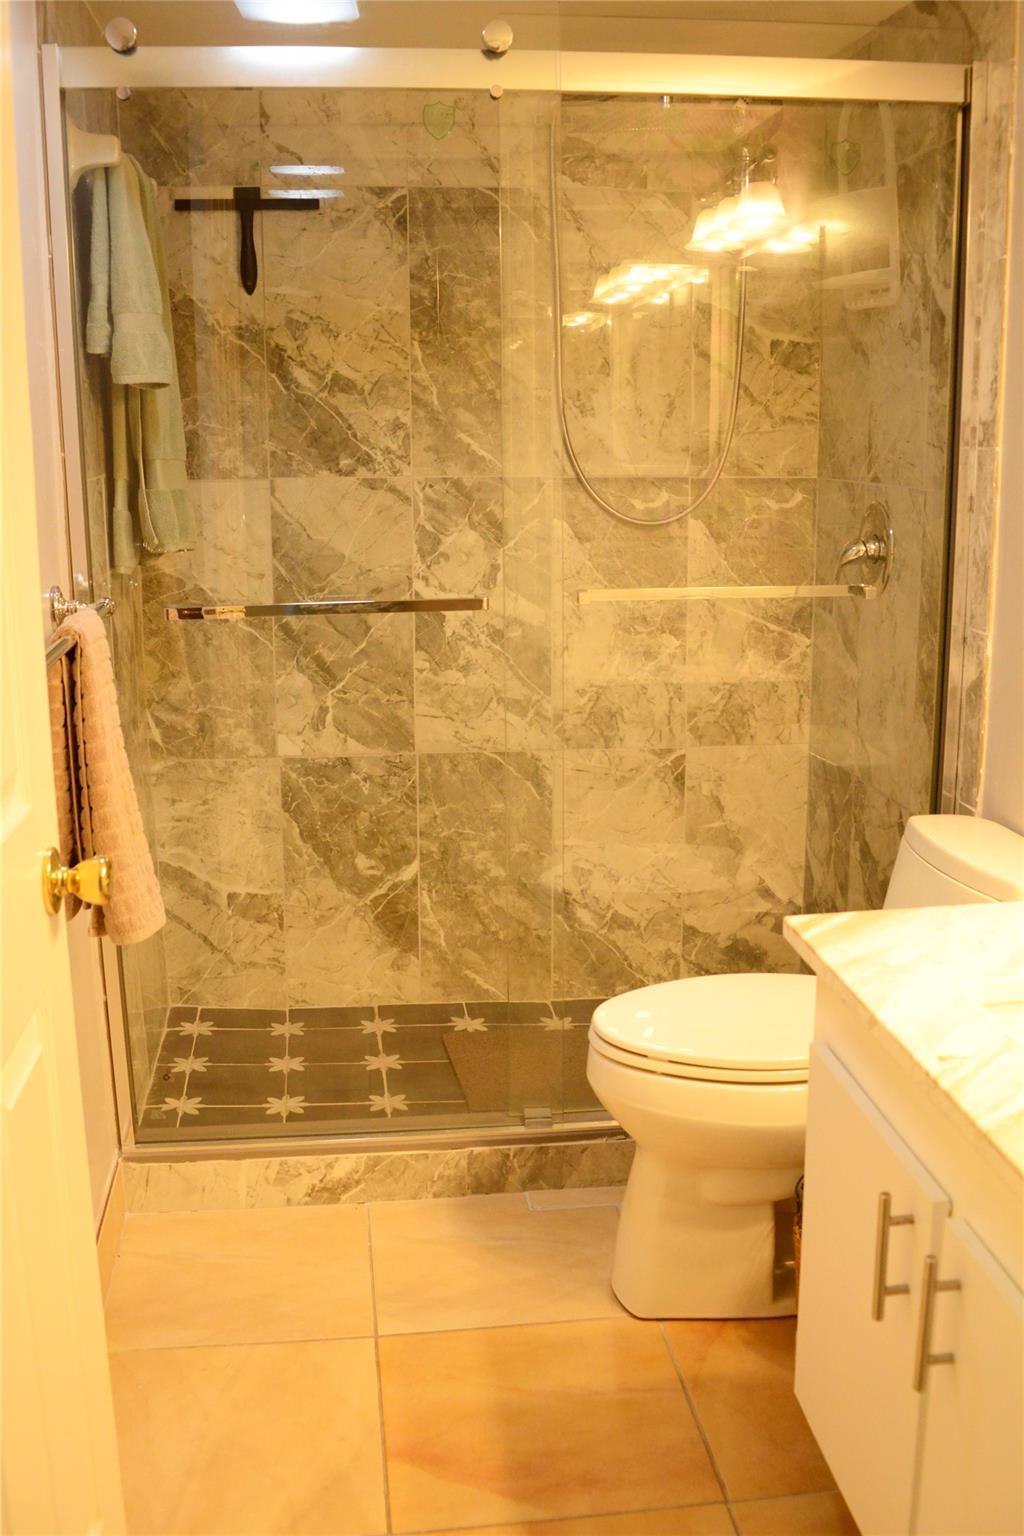
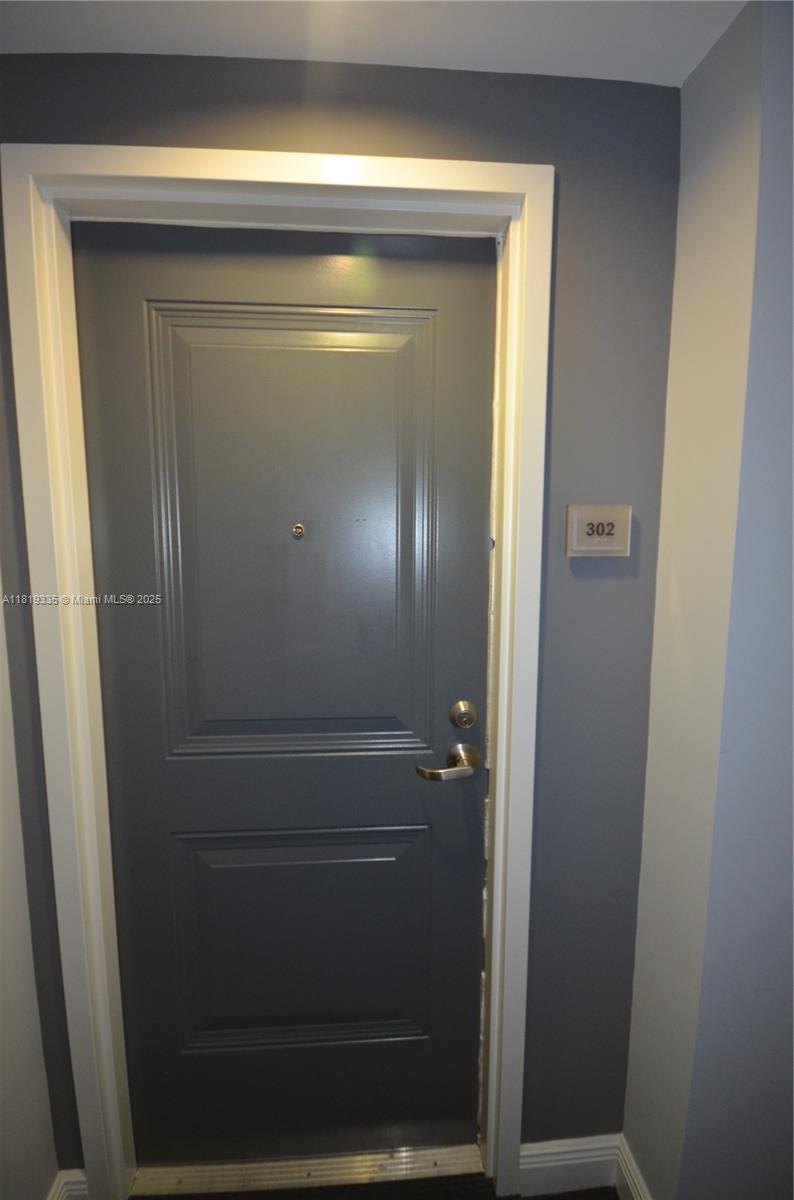
Active
$230,000
2
bds
|
2
ba
|
880
sqft
|
built
2007
6761 Heritage Grande, Boynton Beach, FL 33437
$-650
Cash flow
-14.7%
Cash-on-Cash Return
2.8%
Cap rate
0.9%
Rent to Value Ratio
Active
$350,000
1
bds
|
2
ba
|
835
sqft
|
built
2010
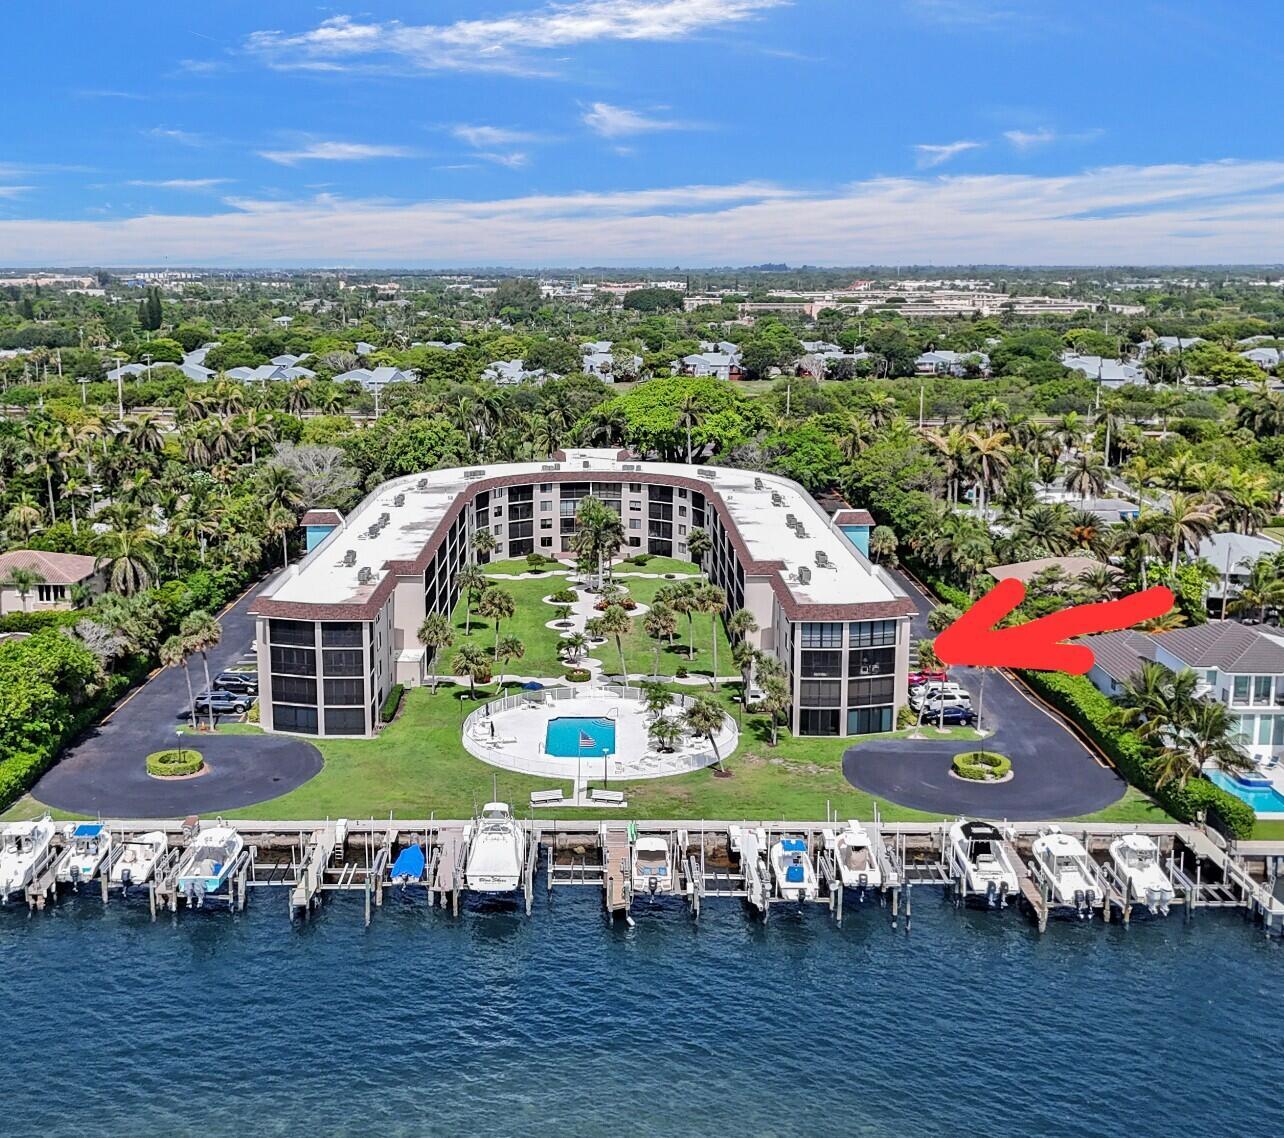
400 N Federal Hwy, Boynton Beach, FL 33435
$-1,535
Cash flow
-22.9%
Cash-on-Cash Return
0.9%
Cap rate
0.6%
Rent to Value Ratio
Active
$320,000
3
bds
|
2
ba
|
1,560
sqft
|
built
1980
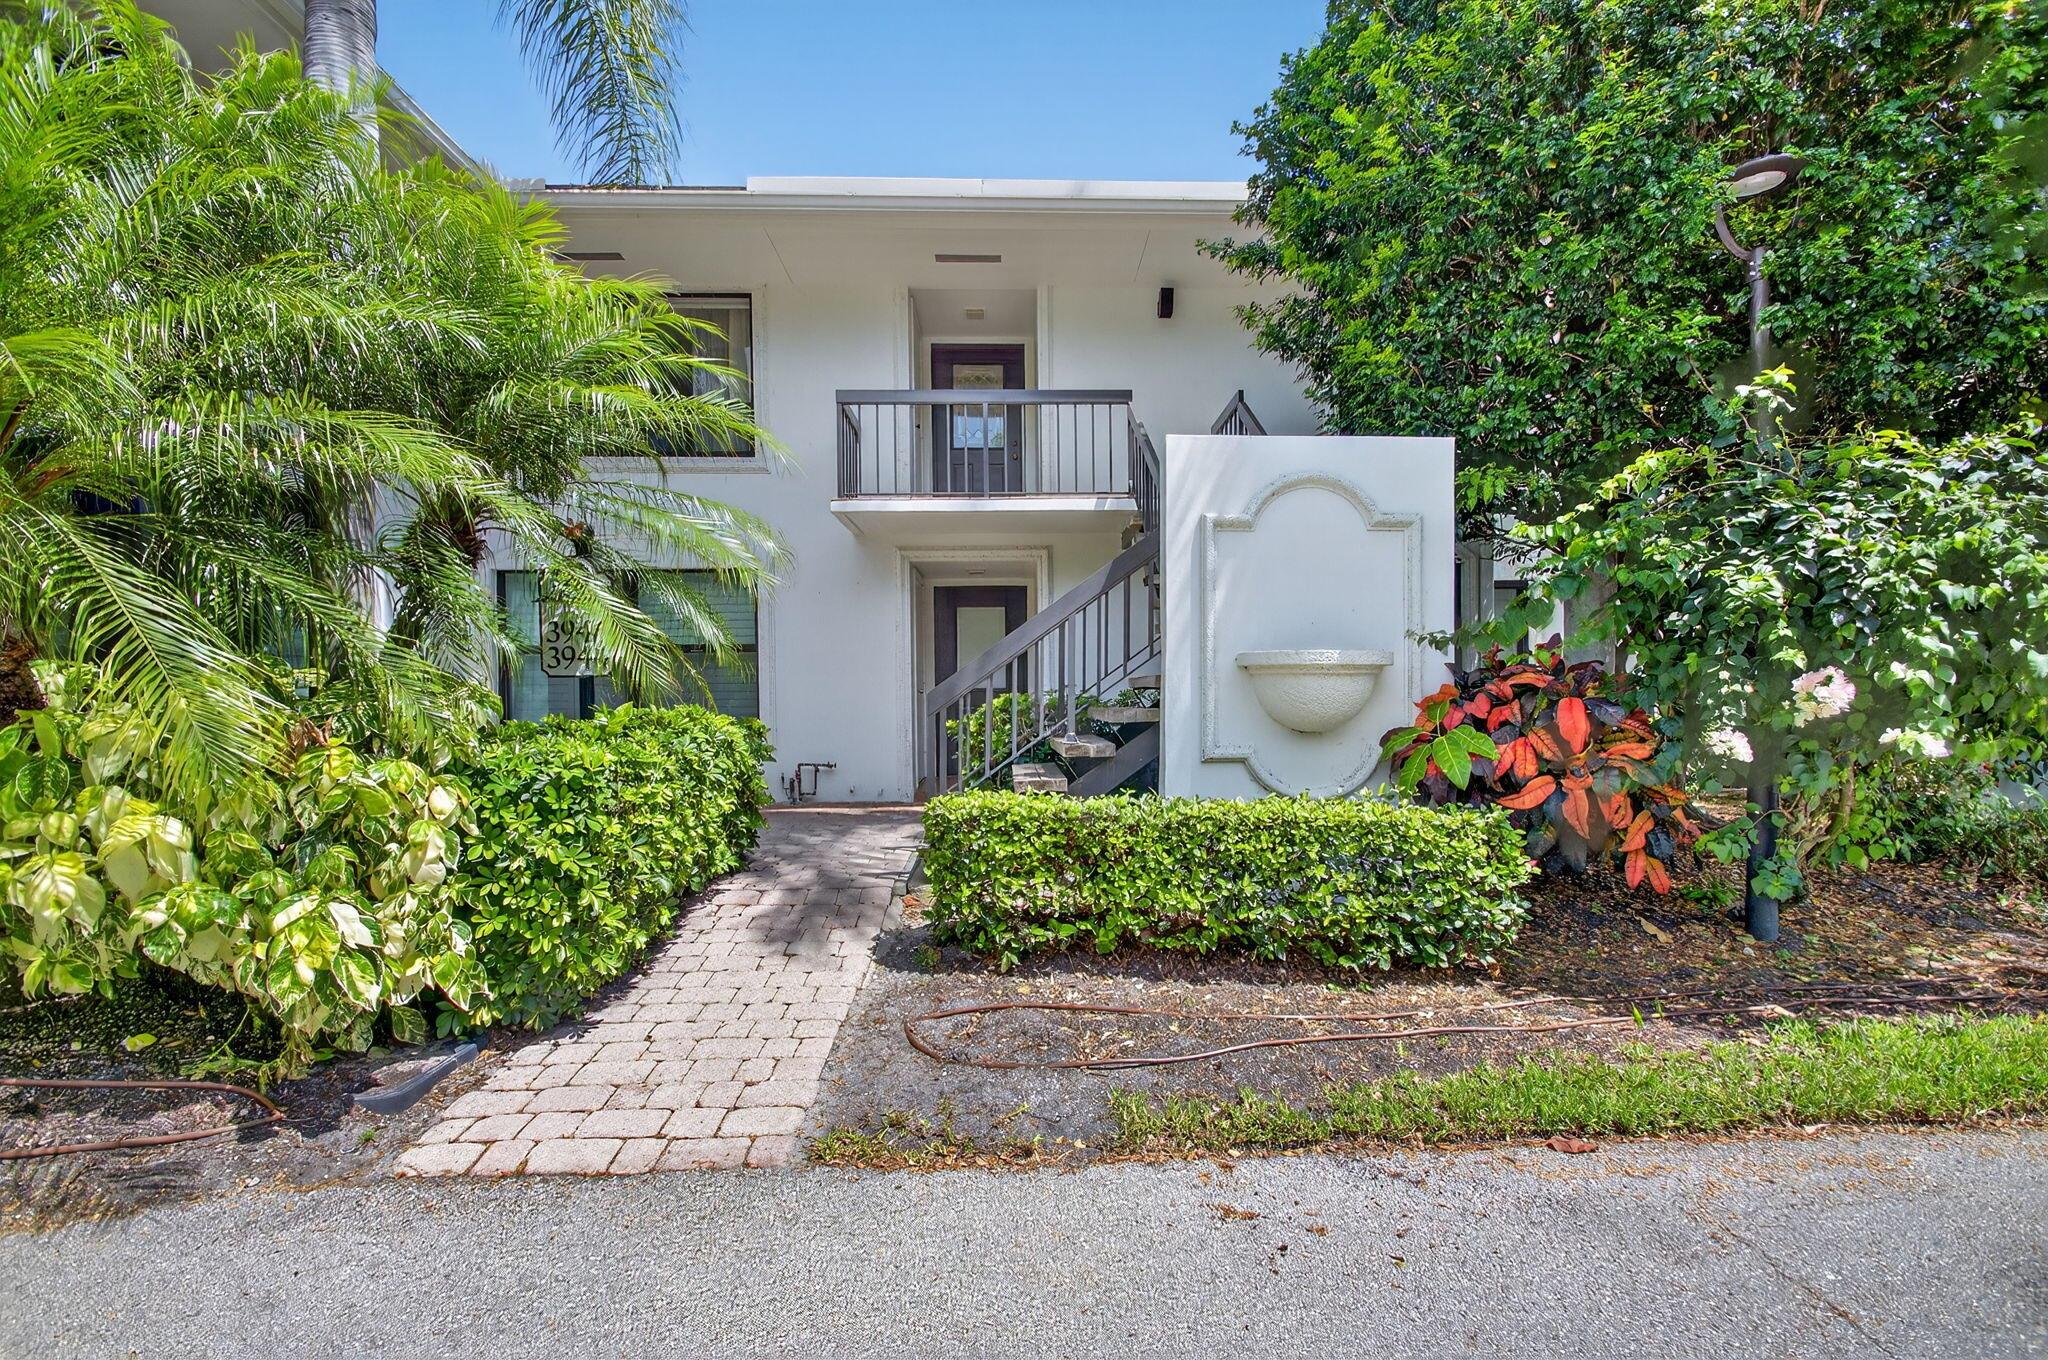
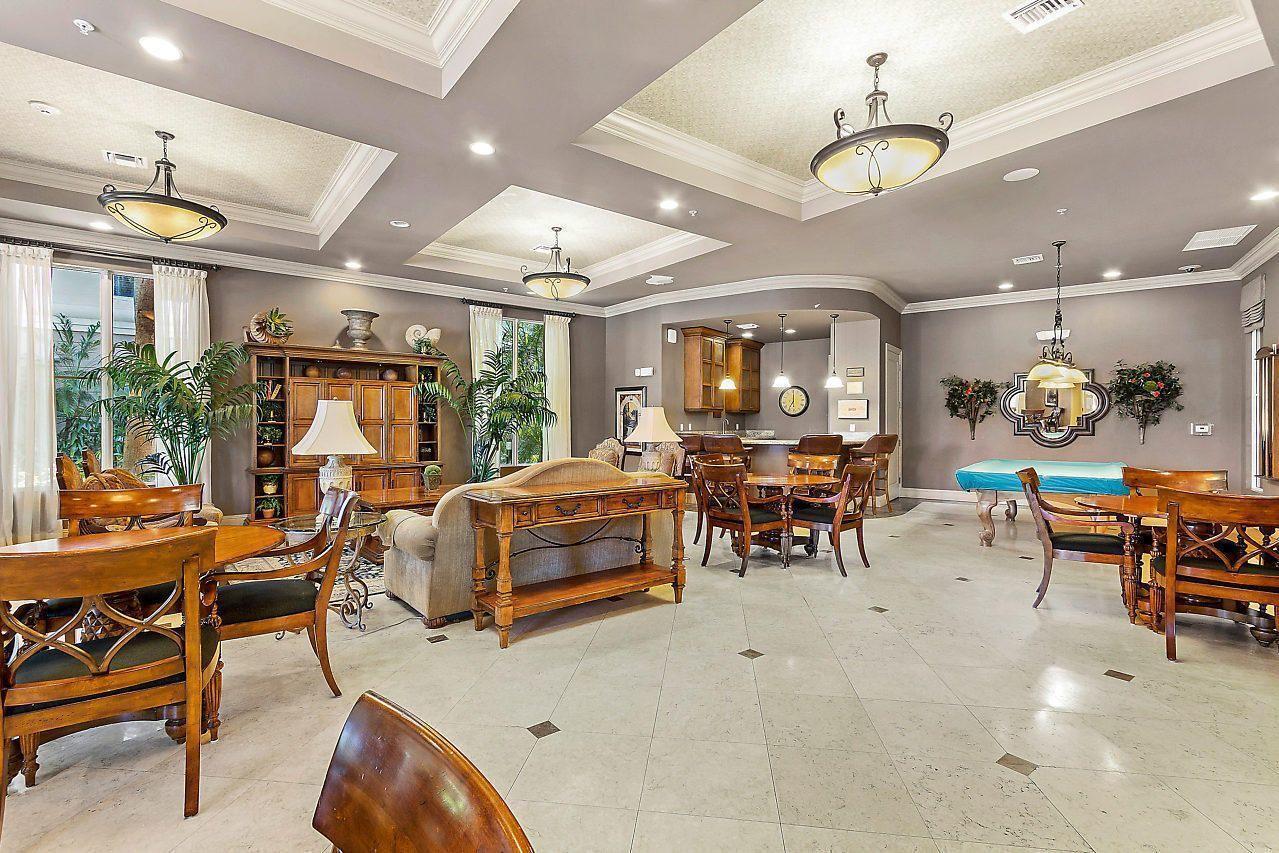
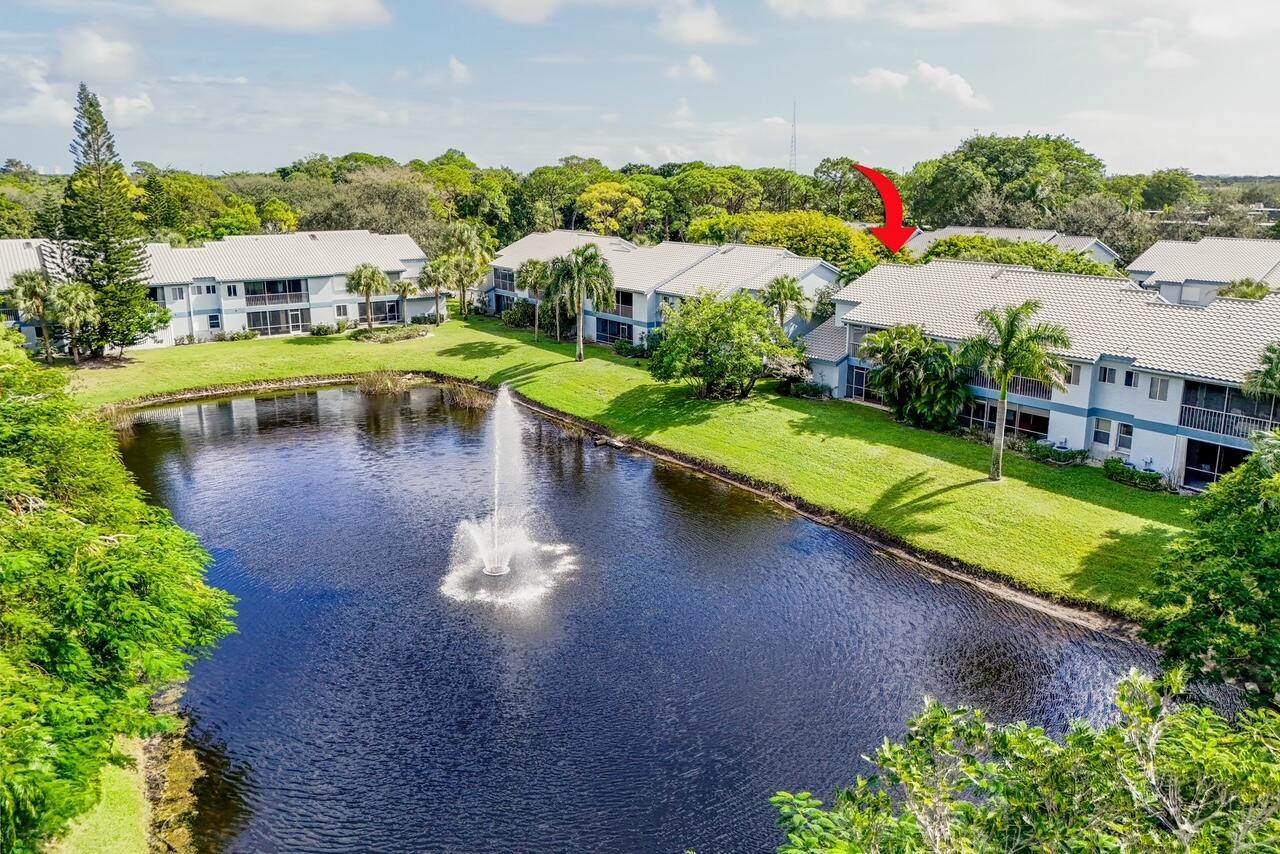
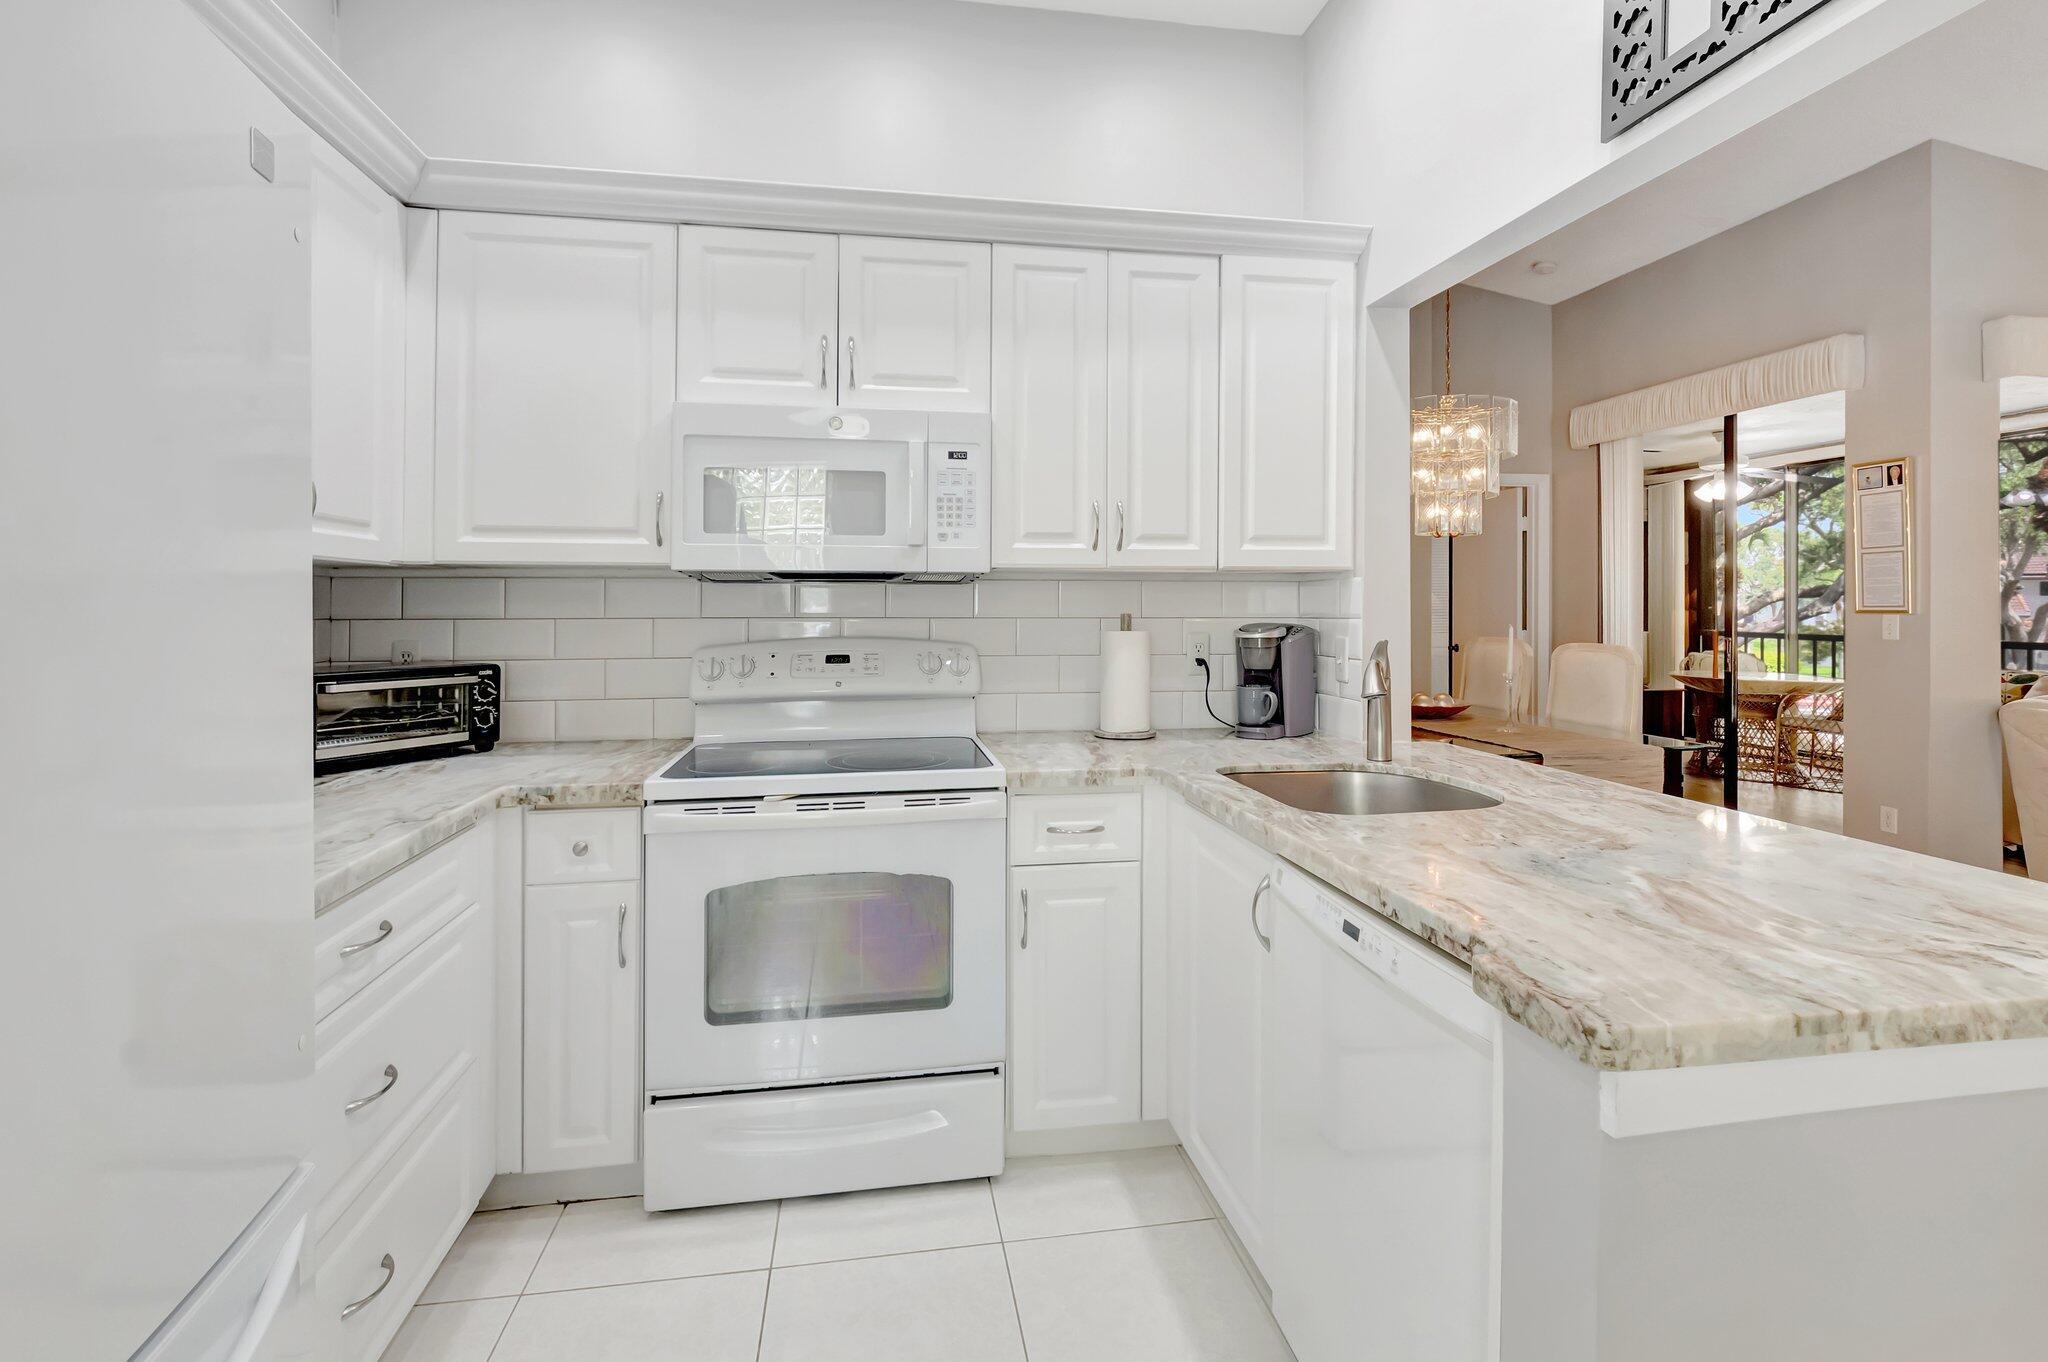
3946 Quail Ridge Dr N, Boynton Beach, FL 33436
$-954
Cash flow
-15.6%
Cash-on-Cash Return
2.6%
Cap rate
1.0%
Rent to Value Ratio
Active
$310,000
2
bds
|
2
ba
|
1,137
sqft
|
built
2007
1660 Renaissance Commons Blvd, Boynton Beach, FL 33426
$-1,133
Cash flow
-19.1%
Cash-on-Cash Return
1.8%
Cap rate
0.8%
Rent to Value Ratio
Active
$339,000
3
bds
|
2
ba
|
1,458
sqft
|
built
1992
9777 Nickels Blvd, Boynton Beach, FL 33436
$-729
Cash flow
-11.2%
Cash-on-Cash Return
3.6%
Cap rate
0.8%
Rent to Value Ratio
Active
$300,000
3
bds
|
2
ba
|
1,282
sqft
|
built
1990
5414 Venetia Ct, Boynton Beach, FL 33437
$-870
Cash flow
-15.1%
Cash-on-Cash Return
2.7%
Cap rate
0.8%
Rent to Value Ratio
Active
$659,000
2
bds
|
2
ba
|
1,509
sqft
|
built
1976
2424 N Federal Hwy, Boynton Beach, FL 33435
$-3,011
Cash flow
-23.8%
Cash-on-Cash Return
0.7%
Cap rate
0.5%
Rent to Value Ratio
Active
$215,000
2
bds
|
2
ba
|
864
sqft
|
built
1987
25 Crossings Cir, Boynton Beach, FL 33435
$-313
Cash flow
-7.6%
Cash-on-Cash Return
4.4%
Cap rate
0.9%
Rent to Value Ratio
Active
$204,900
2
bds
|
2
ba
|
986
sqft
|
built
1979
2181 W Woolbright Rd, Boynton Beach, FL 33426
$-205
Cash flow
-5.2%
Cash-on-Cash Return
4.9%
Cap rate
1.0%
Rent to Value Ratio
Active
$325,000
3
bds
|
2
ba
|
1,580
sqft
|
built
1990
9770 Nickels Blvd, Boynton Beach, FL 33436
$-810
Cash flow
-13.0%
Cash-on-Cash Return
3.2%
Cap rate
0.9%
Rent to Value Ratio
Active
$355,000
2
bds
|
2
ba
|
899
sqft
|
built
1978
689 NE 6th Ct, Boynton Beach, FL 33435
$-1,399
Cash flow
-20.6%
Cash-on-Cash Return
1.4%
Cap rate
0.8%
Rent to Value Ratio

Active
$214,900
2
bds
|
2
ba
|
1,008
sqft
|
built
1981
9965 Pineapple Tree Dr, Boynton Beach, FL 33436
$-371
Cash flow
-9.0%
Cash-on-Cash Return
4.1%
Cap rate
1.0%
Rent to Value Ratio
Active
$329,000
3
bds
|
2
ba
|
1,846
sqft
|
built
1991
5419 Firenze Dr, Boynton Beach, FL 33437
$-856
Cash flow
-13.6%
Cash-on-Cash Return
3.0%
Cap rate
1.0%
Rent to Value Ratio
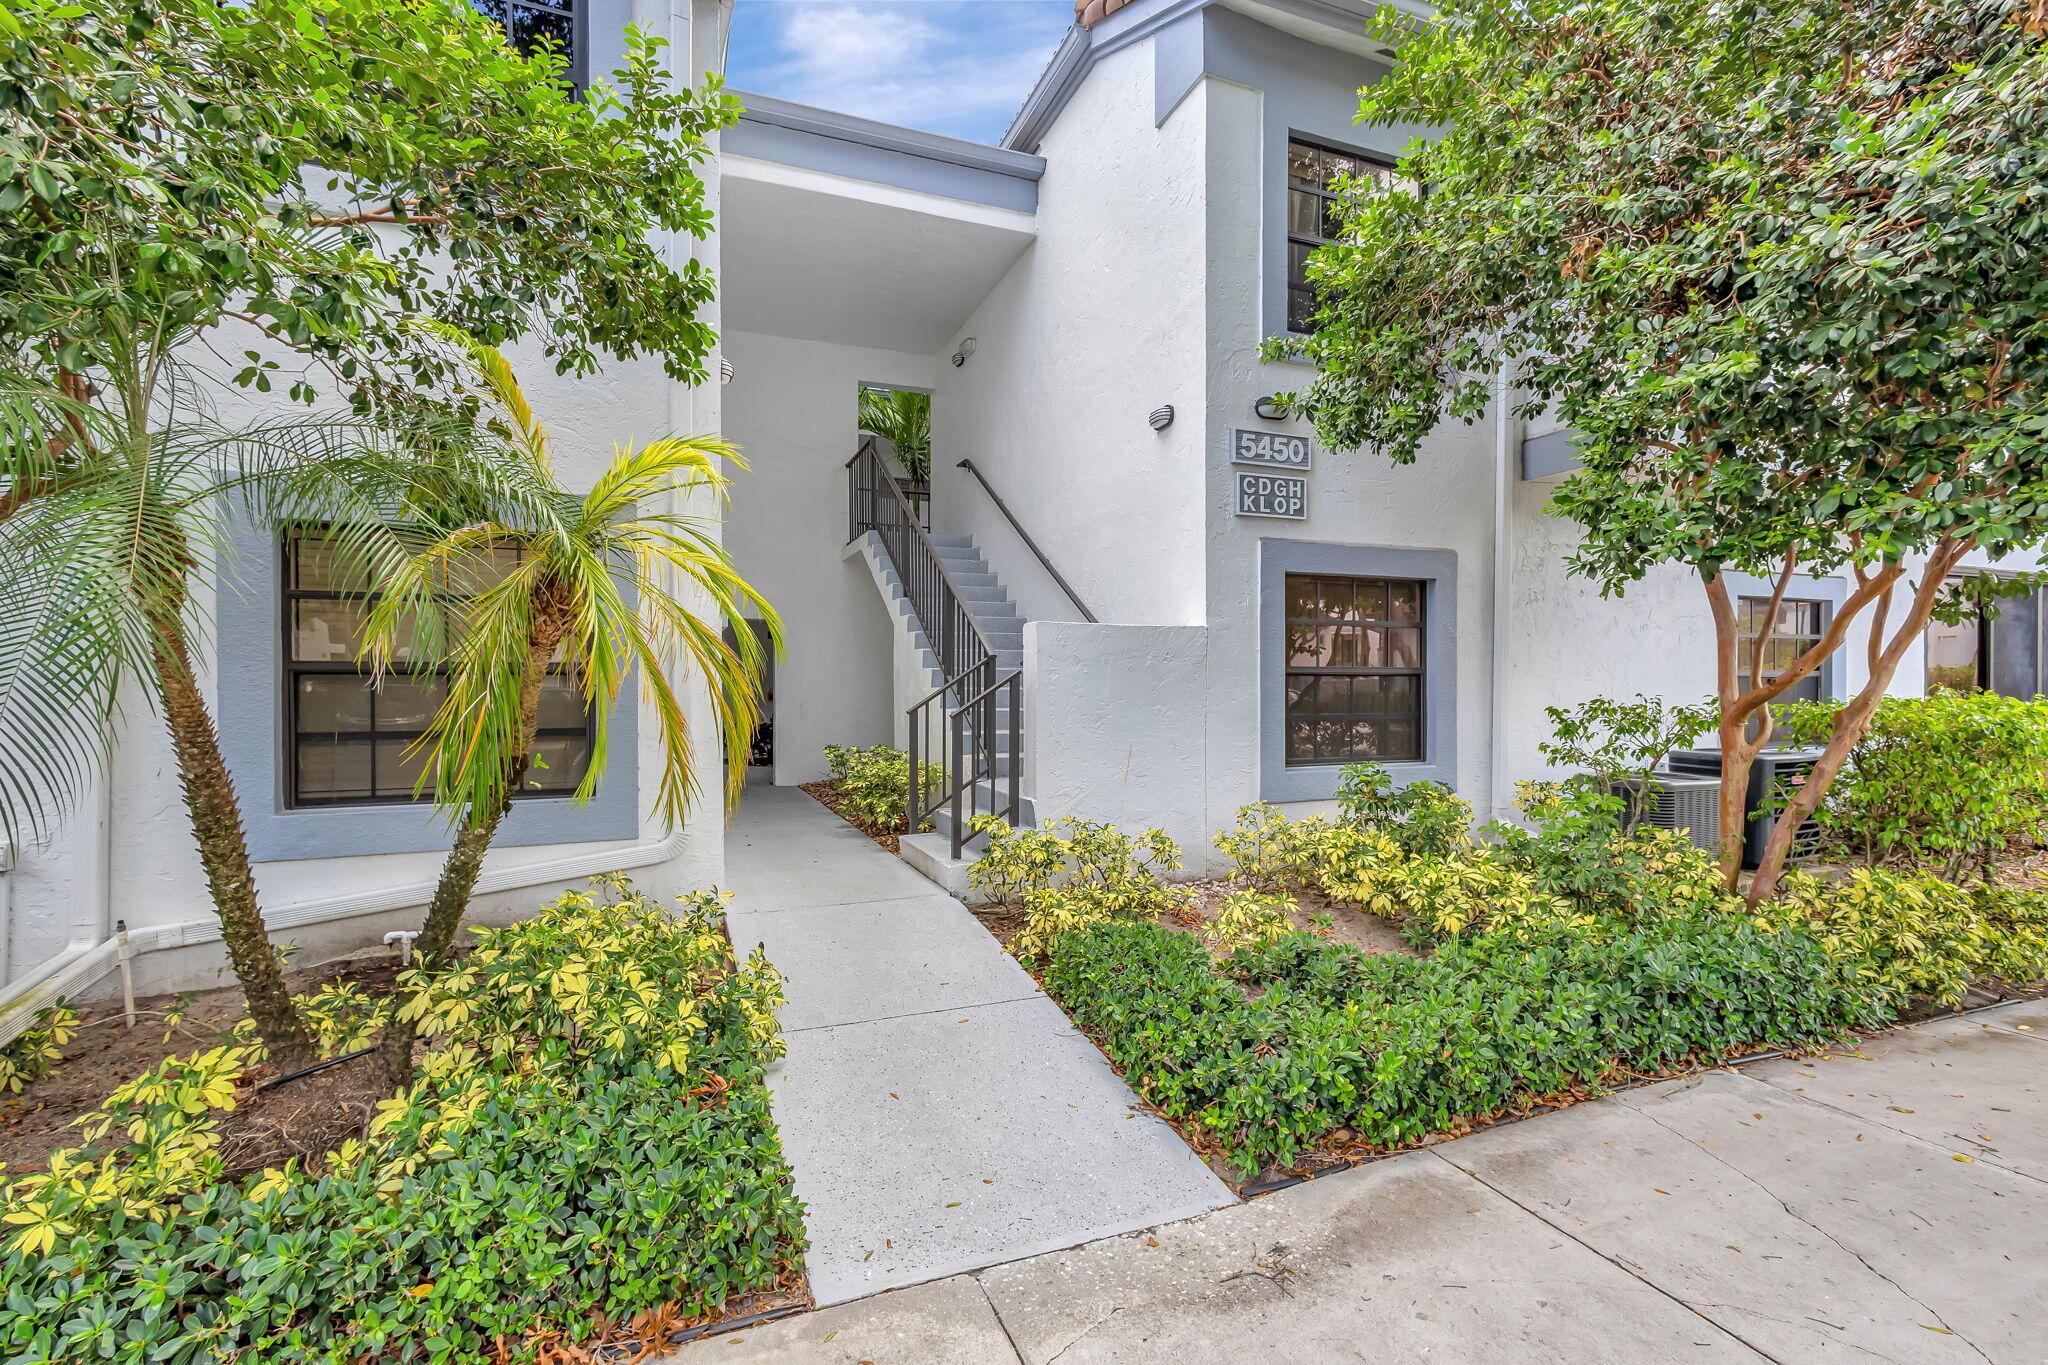
Active
$229,900
2
bds
|
2
ba
|
1,139
sqft
|
built
1990
5450 Verona Dr, Boynton Beach, FL 33437
$-804
Cash flow
-18.2%
Cash-on-Cash Return
2.0%
Cap rate
1.0%
Rent to Value Ratio
Active
$119,000
1
bds
|
2
ba
|
624
sqft
|
built
1970
2191 NE 1st Ct, Boynton Beach, FL 33435
$-216
Cash flow
-9.5%
Cash-on-Cash Return
4.0%
Cap rate
1.3%
Rent to Value Ratio
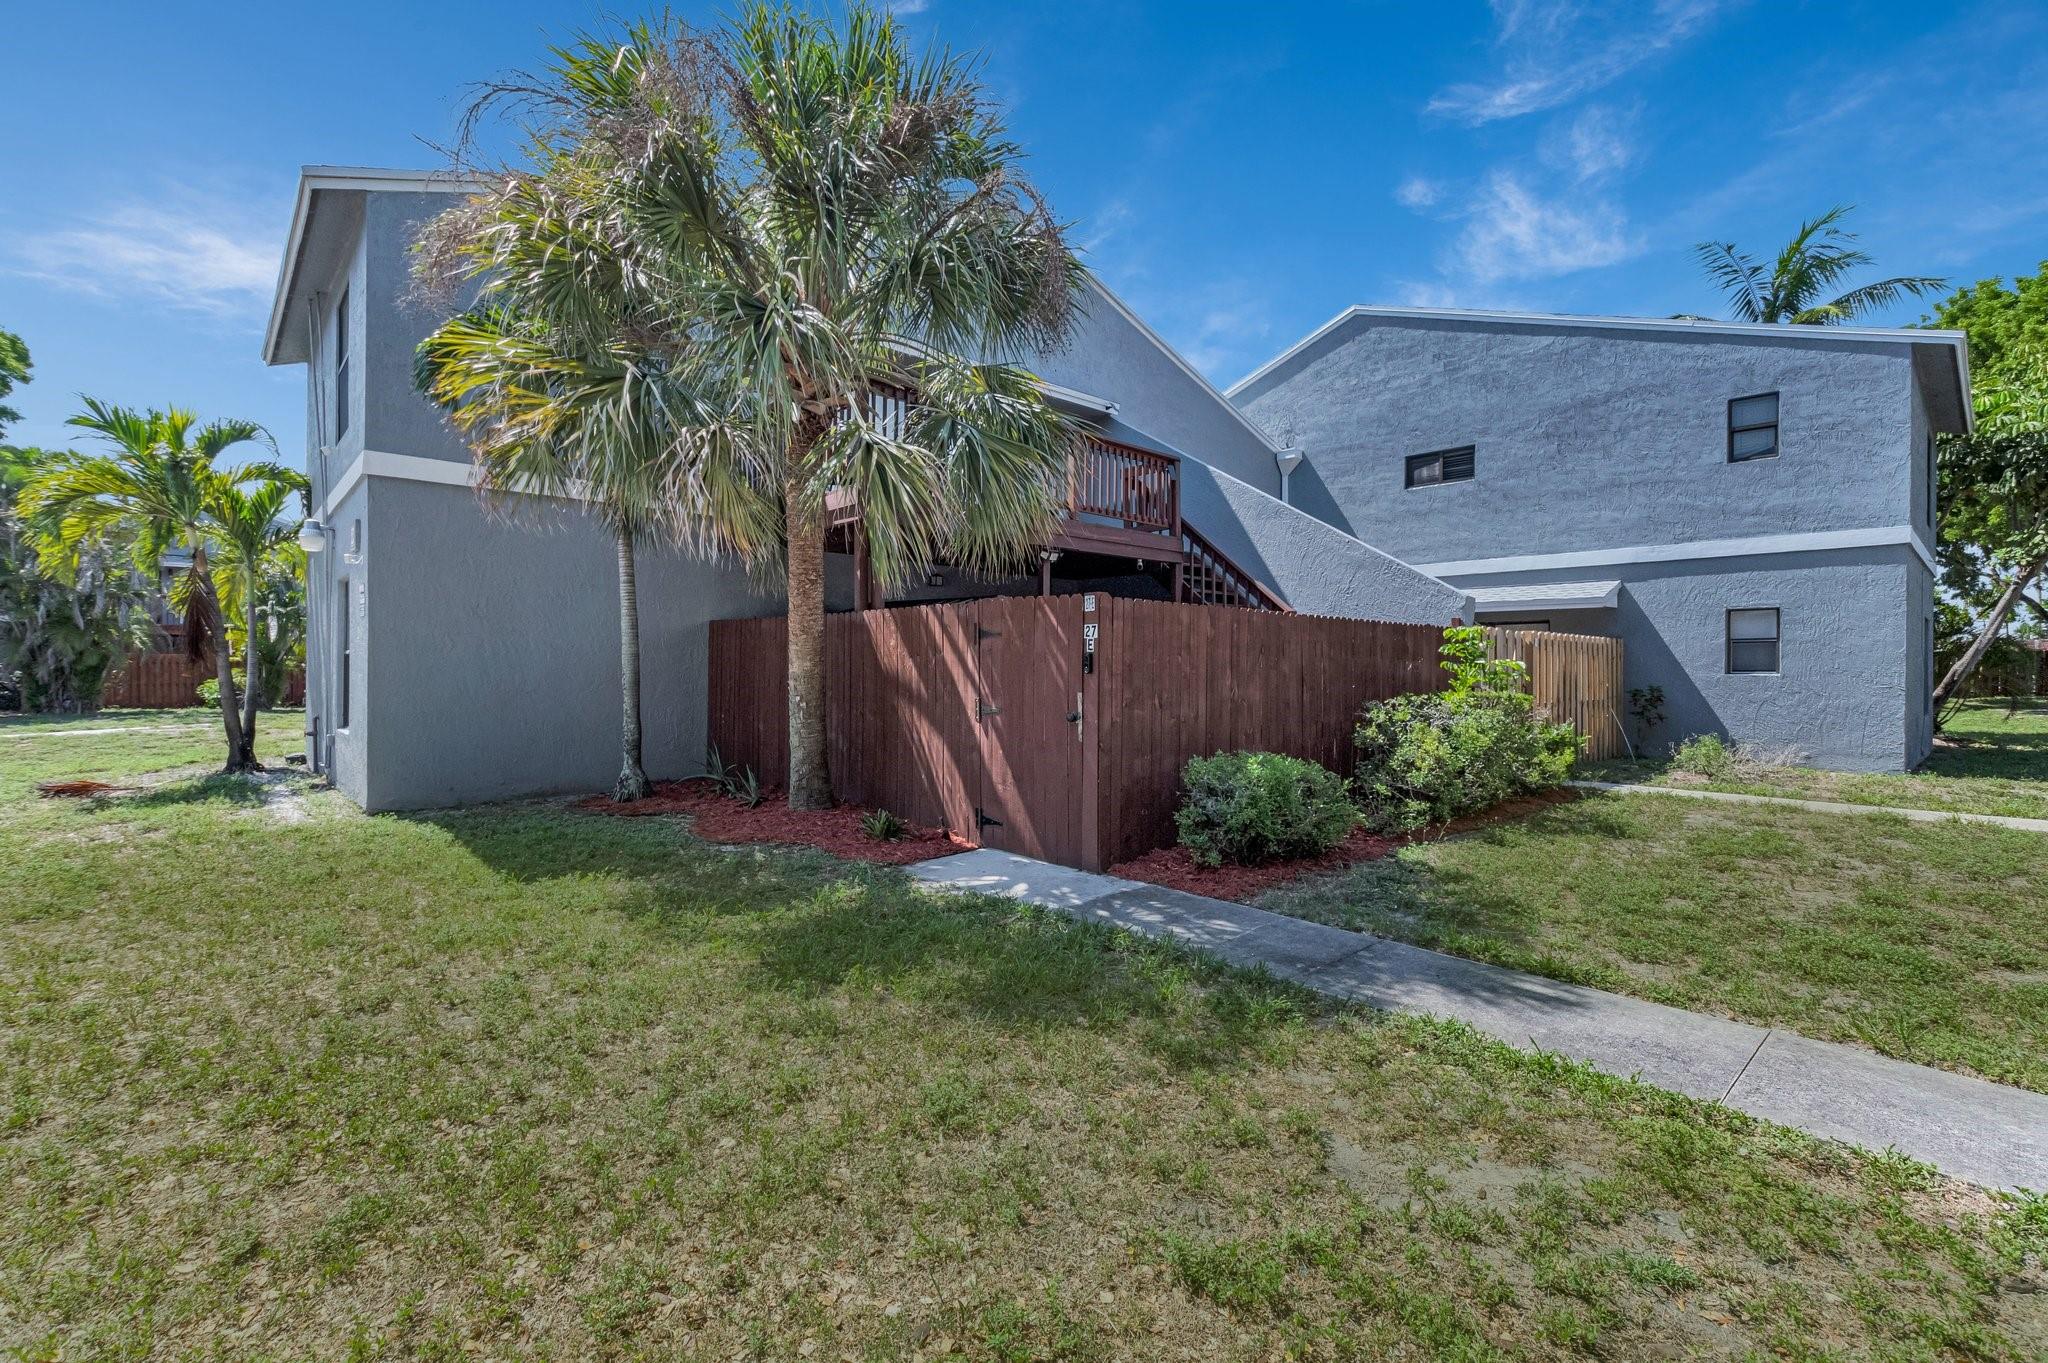
Active
$220,000
2
bds
|
2
ba
|
953
sqft
|
built
1985
27 Crossings Cir, Boynton Beach, FL 33435
$-466
Cash flow
-11.1%
Cash-on-Cash Return
3.6%
Cap rate
0.8%
Rent to Value Ratio
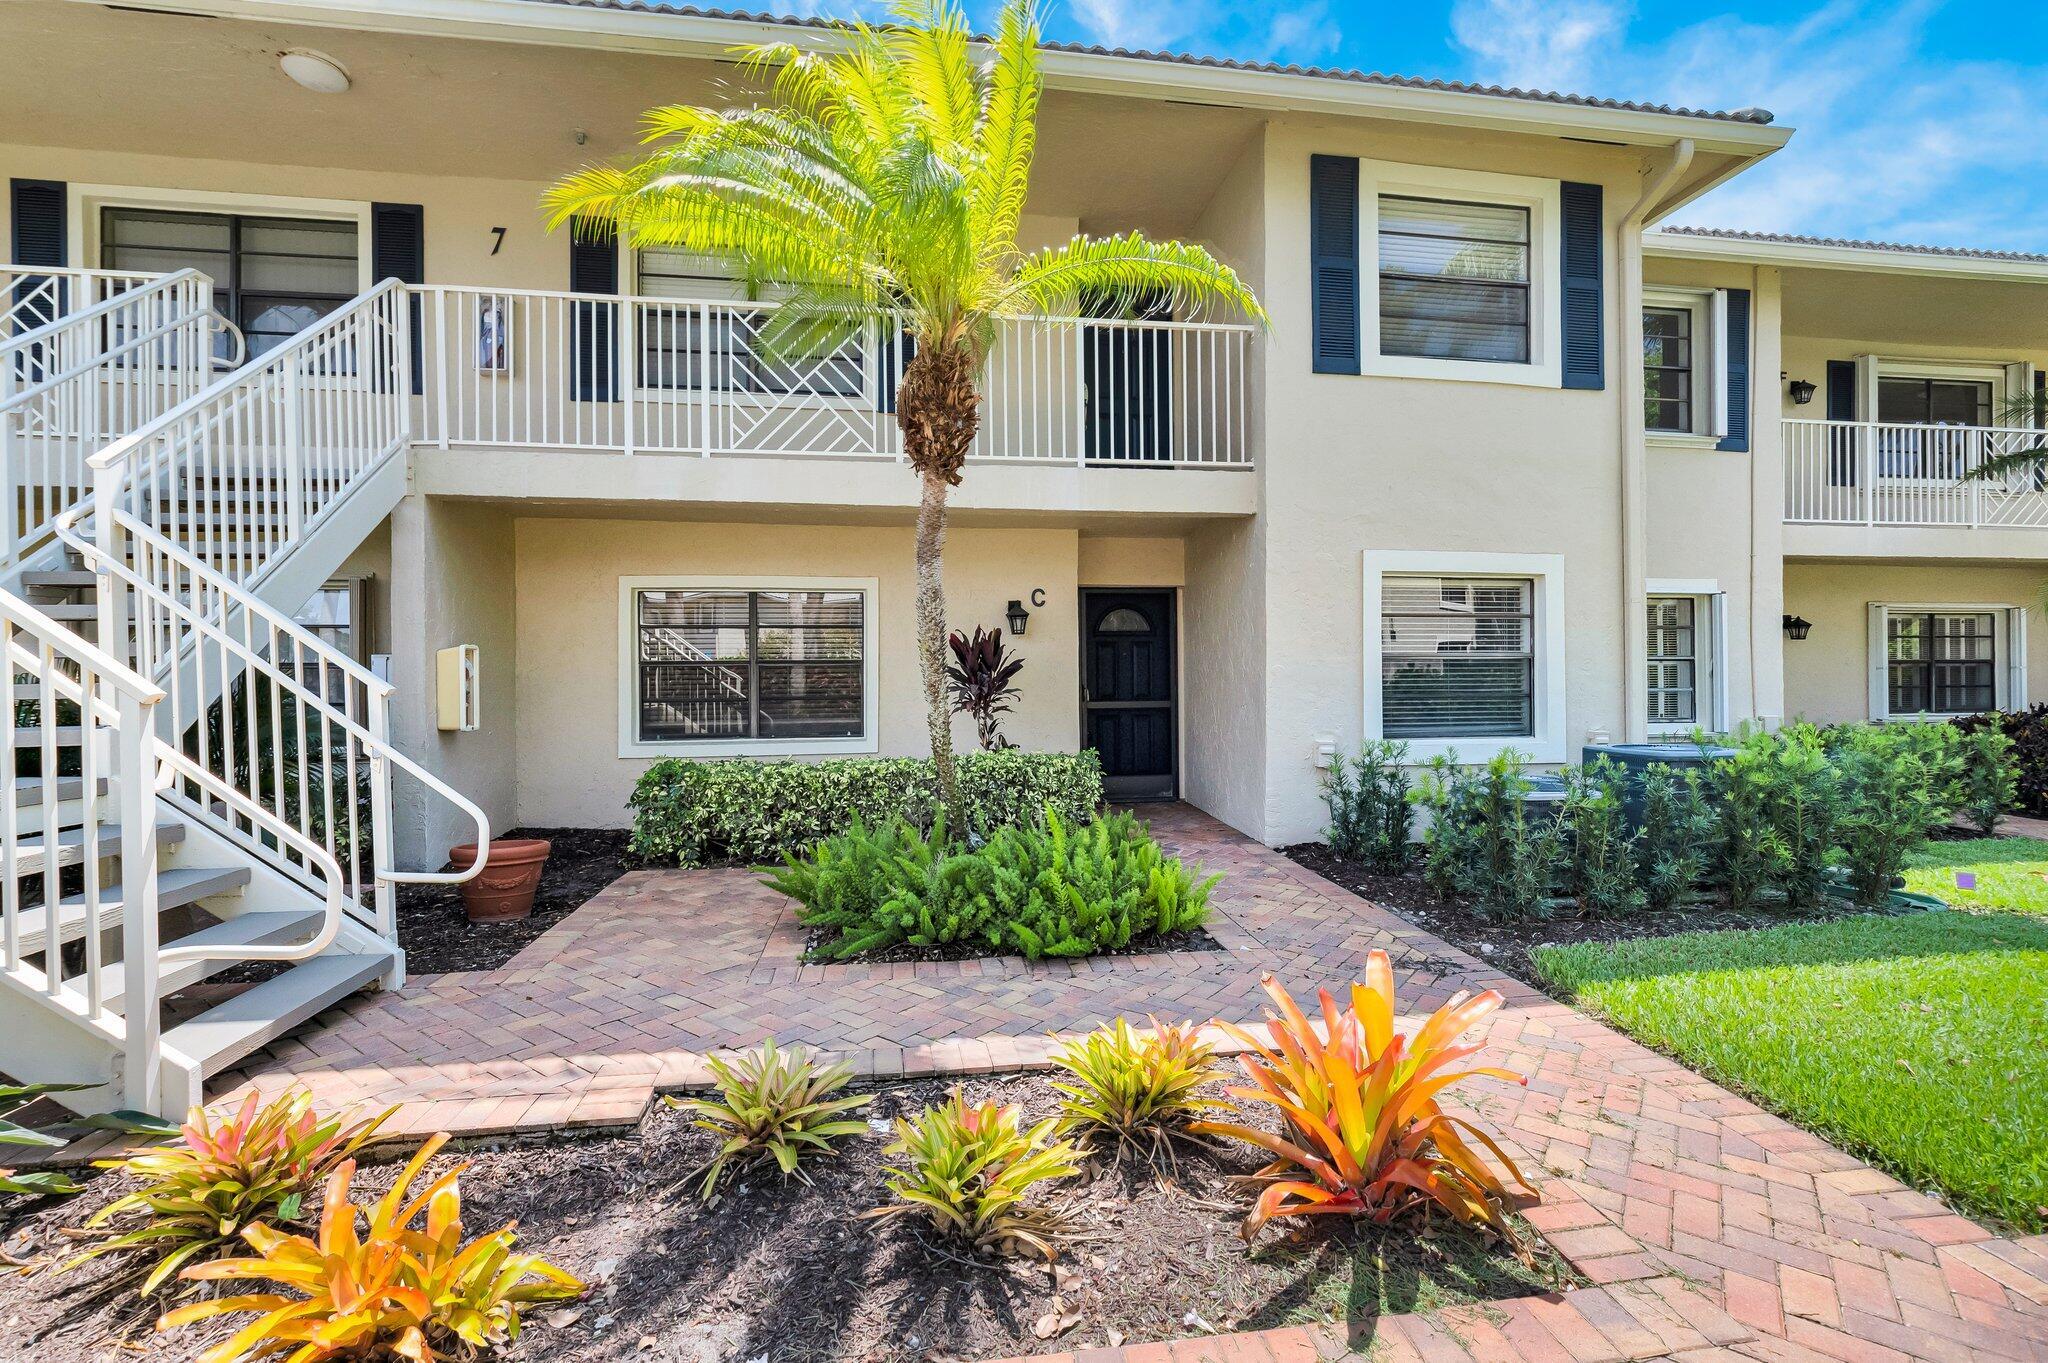
Active
$1,000
2
bds
|
2
ba
|
1,388
sqft
|
built
1980
7 Stratford Dr E, Boynton Beach, FL 33436
$-235
Cash flow
-273.8%
Cash-on-Cash Return
-282.0%
Cap rate
200.0%
Rent to Value Ratio
Active
$269,900
3
bds
|
2
ba
|
1,495
sqft
|
built
1995
5154 Floria Dr, Boynton Beach, FL 33437
$-502
Cash flow
-9.7%
Cash-on-Cash Return
3.9%
Cap rate
1.0%
Rent to Value Ratio
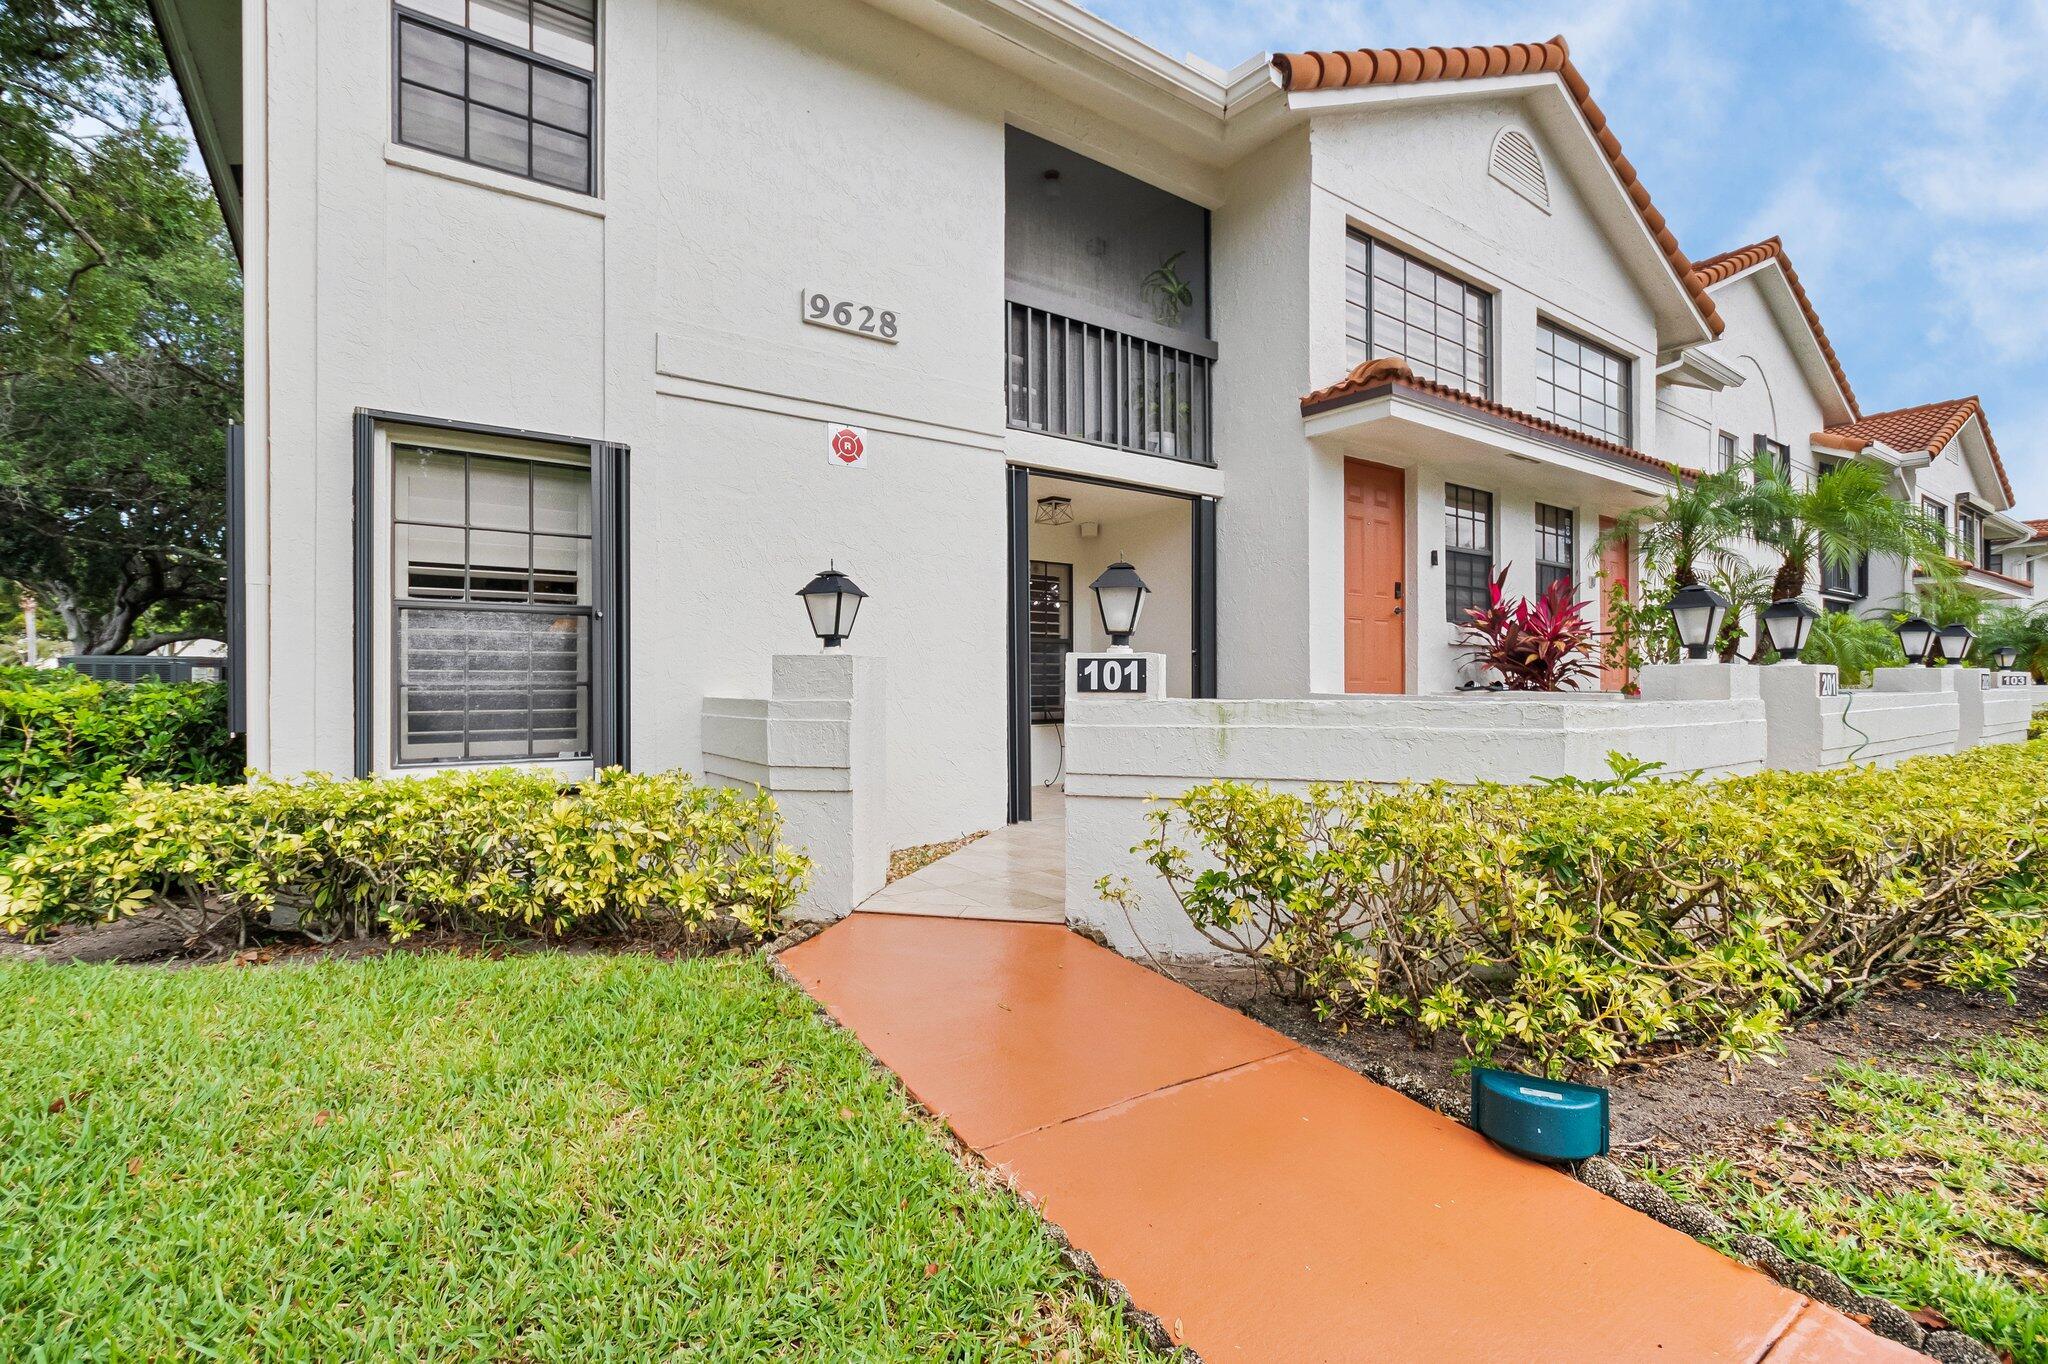
Active
$319,900
2
bds
|
2
ba
|
1,498
sqft
|
built
1990
9628 Pavarotti Ter, Boynton Beach, FL 33437
$-357
Cash flow
-5.8%
Cash-on-Cash Return
4.8%
Cap rate
1.0%
Rent to Value Ratio
Active
$269,900
3
bds
|
2
ba
|
1,813
sqft
|
built
1998
5874 Crystal Shores Dr, Boynton Beach, FL 33437
$-637
Cash flow
-12.3%
Cash-on-Cash Return
3.3%
Cap rate
1.0%
Rent to Value Ratio
Active
$407,500
2
bds
|
2
ba
|
1,361
sqft
|
built
2003
6365 Bella Cir, Boynton Beach, FL 33437
$-814
Cash flow
-10.4%
Cash-on-Cash Return
3.7%
Cap rate
0.8%
Rent to Value Ratio
Active
$250,000
3
bds
|
2
ba
|
1,216
sqft
|
built
1975
1920 Palmland Dr, Boynton Beach, FL 33436
$-487
Cash flow
-10.2%
Cash-on-Cash Return
3.8%
Cap rate
1.0%
Rent to Value Ratio
Active
$315,000
2
bds
|
2
ba
|
1,225
sqft
|
built
2002
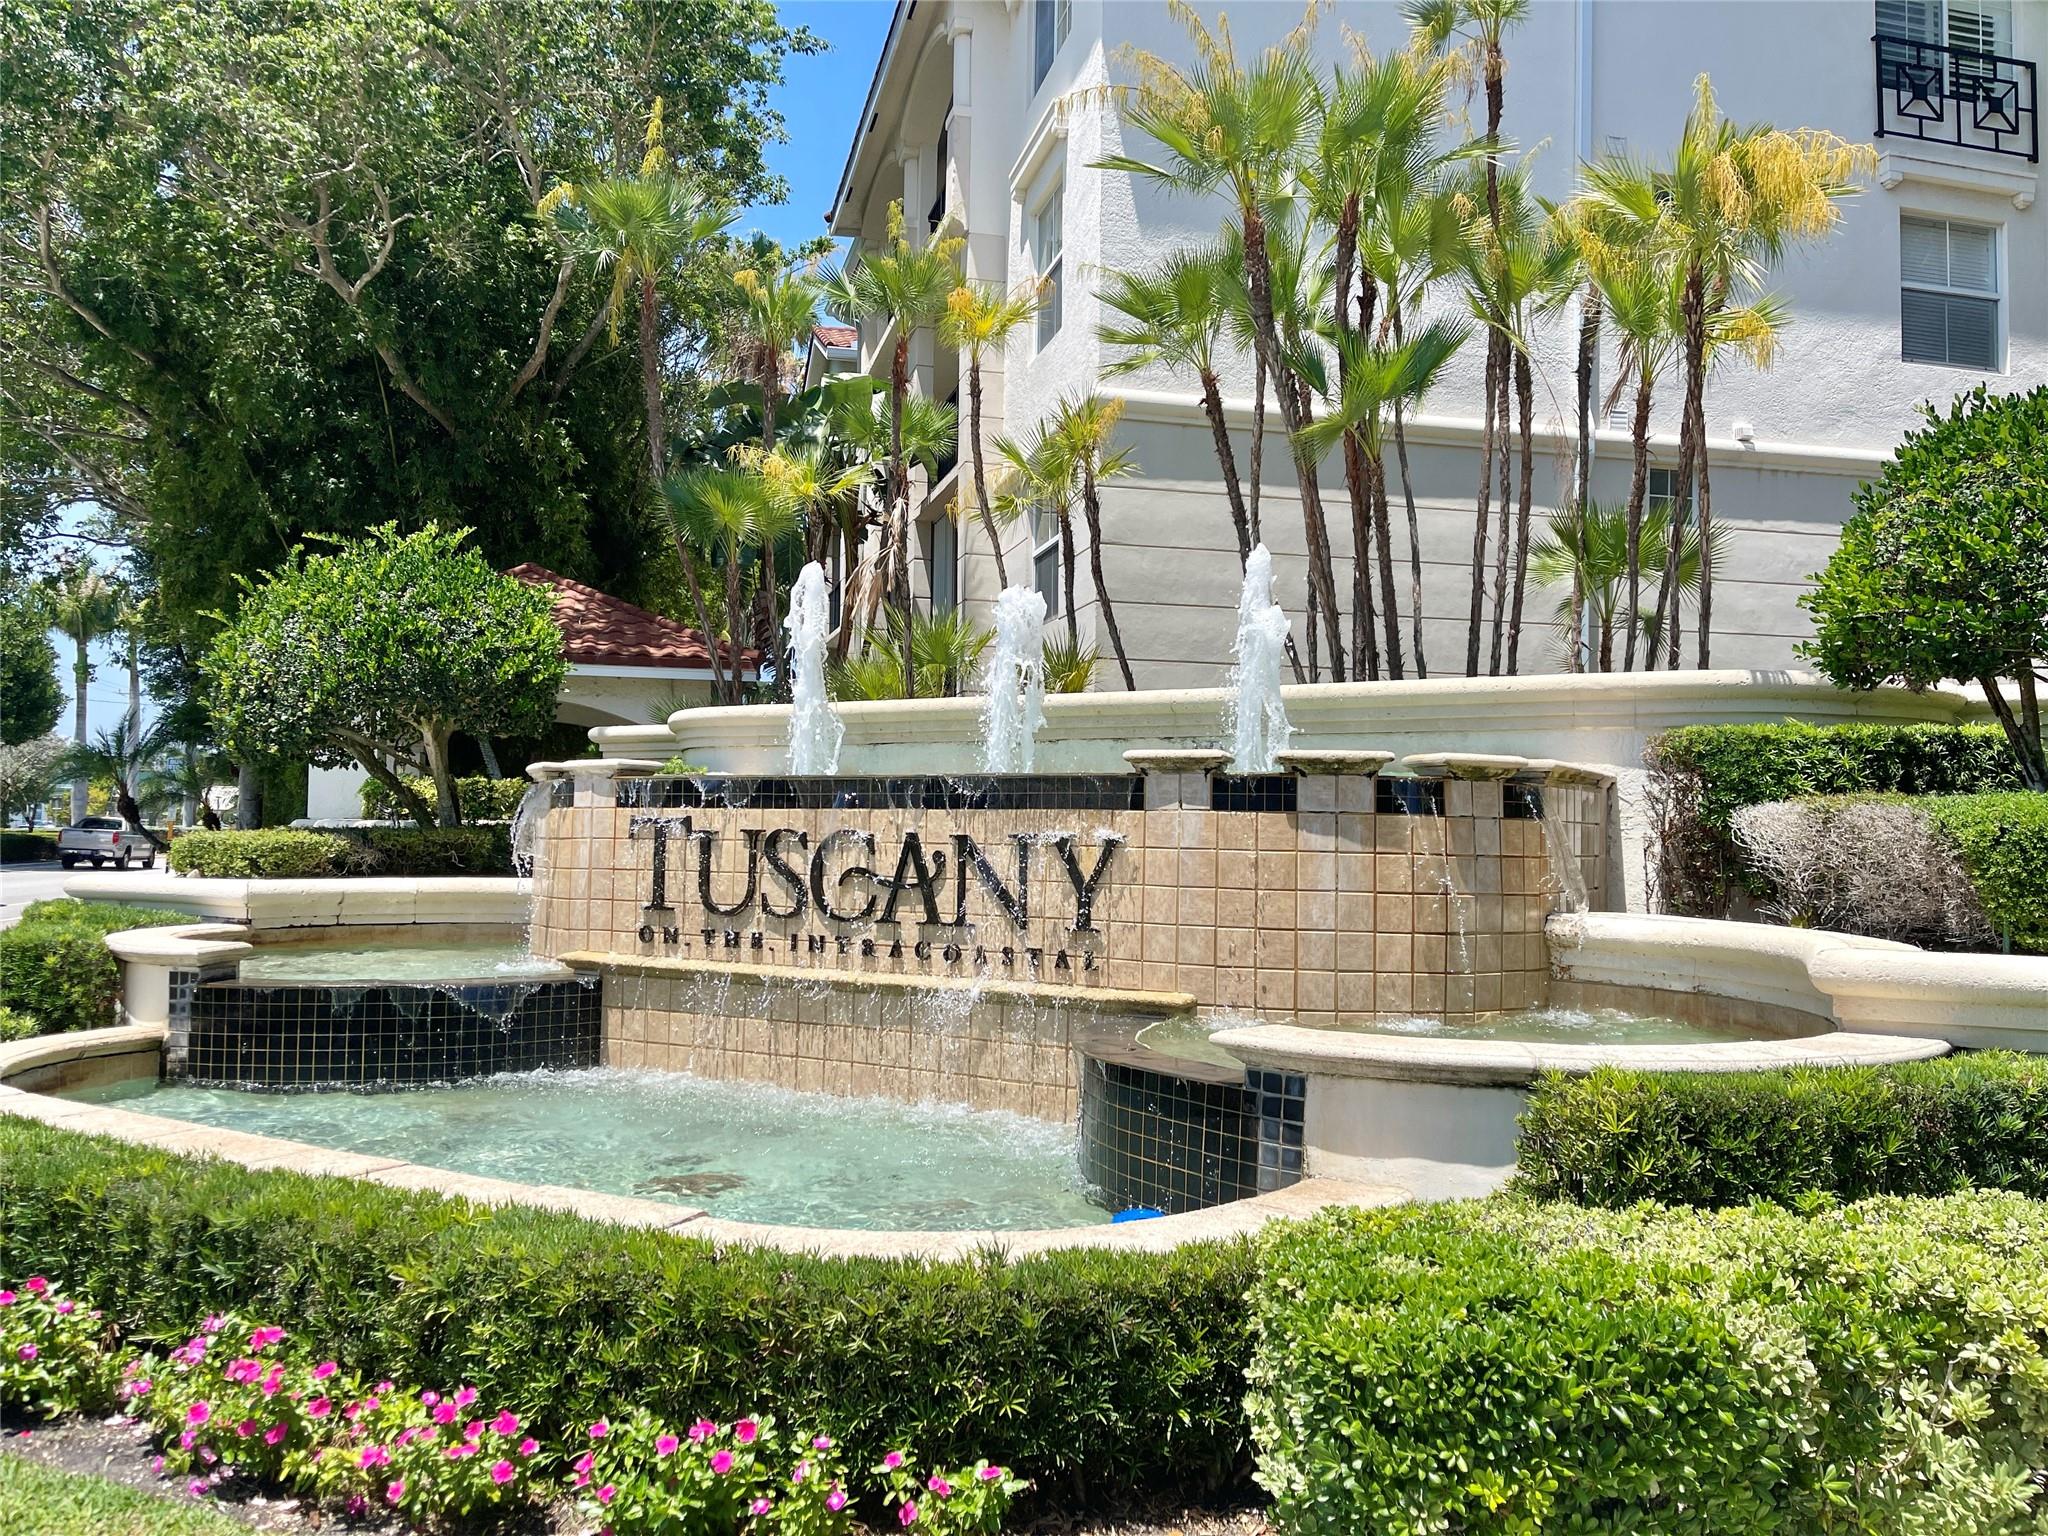
3409 Tuscany Way, Boynton Beach, FL 33435
$-1,305
Cash flow
-21.6%
Cash-on-Cash Return
1.2%
Cap rate
0.8%
Rent to Value Ratio
Active
$139,000
1
bds
|
2
ba
|
1,022
sqft
|
built
1968
312 NE 17th Ave, Boynton Beach, FL 33435
$-62
Cash flow
-2.3%
Cash-on-Cash Return
5.6%
Cap rate
1.3%
Rent to Value Ratio
Active
$284,900
3
bds
|
2
ba
|
1,724
sqft
|
built
1992
5219 Europa Dr, Boynton Beach, FL 33437
$-562
Cash flow
-10.3%
Cash-on-Cash Return
3.8%
Cap rate
1.0%
Rent to Value Ratio
Active
$230,000
2
bds
|
2
ba
|
953
sqft
|
built
1984
15 Crossings Cir, Boynton Beach, FL 33435
$-214
Cash flow
-4.9%
Cash-on-Cash Return
5.0%
Cap rate
0.9%
Rent to Value Ratio
Active
$199,900
2
bds
|
2
ba
|
986
sqft
|
built
1980
1901 W Woolbright Rd, Boynton Beach, FL 33426
$-131
Cash flow
-3.4%
Cash-on-Cash Return
5.4%
Cap rate
1.0%
Rent to Value Ratio
Active
$423,999
2
bds
|
2
ba
|
1,185
sqft
|
built
2010
350 N Federal Hwy, Boynton Beach, FL 33435
$-1,576
Cash flow
-19.4%
Cash-on-Cash Return
1.7%
Cap rate
0.8%
Rent to Value Ratio
Active
$295,000
3
bds
|
2
ba
|
1,134
sqft
|
built
1990
5451 Verona Dr, Boynton Beach, FL 33437
$-1,040
Cash flow
-18.4%
Cash-on-Cash Return
1.9%
Cap rate
0.8%
Rent to Value Ratio
Active
$429,900
2
bds
|
3
ba
|
1,620
sqft
|
built
2003
6379 Bella Cir, Boynton Beach, FL 33437
$-1,004
Cash flow
-12.2%
Cash-on-Cash Return
3.3%
Cap rate
0.7%
Rent to Value Ratio
Active
$235,000
1
bds
|
1
ba
|
726
sqft
|
built
2002
2105 Tuscany Way, Boynton Beach, FL 33435
$-856
Cash flow
-19.0%
Cash-on-Cash Return
1.8%
Cap rate
0.8%
Rent to Value Ratio
Active
$162,500
1
bds
|
1
ba
|
704
sqft
|
built
1986
1432 Meadows Cir W, Boynton Beach, FL 33436
$-255
Cash flow
-8.2%
Cash-on-Cash Return
4.3%
Cap rate
1.0%
Rent to Value Ratio
Active
$255,000
3
bds
|
2
ba
|
1,622
sqft
|
built
1980
6 Stratford Dr E, Boynton Beach, FL 33436
$-1,353
Cash flow
-27.7%
Cash-on-Cash Return
-0.2%
Cap rate
0.9%
Rent to Value Ratio
Active
$221,999
2
bds
|
2
ba
|
998
sqft
|
built
1985
3 Via De Casas Sur, Boynton Beach, FL 33426
$-444
Cash flow
-10.4%
Cash-on-Cash Return
3.7%
Cap rate
0.9%
Rent to Value Ratio
Active
$175,000
1
bds
|
1
ba
|
504
sqft
|
built
1979
111 SE 1st St, Boynton Beach, FL 33435
$-296
Cash flow
-8.8%
Cash-on-Cash Return
4.1%
Cap rate
1.0%
Rent to Value Ratio
Active
$425,000
2
bds
|
2
ba
|
1,470
sqft
|
built
1977
4078 Quail Ridge Dr N, Boynton Beach, FL 33436
$-1,881
Cash flow
-23.1%
Cash-on-Cash Return
0.8%
Cap rate
0.7%
Rent to Value Ratio
Active
$259,900
3
bds
|
2
ba
|
1,447
sqft
|
built
1993
5155 Europa Dr, Boynton Beach, FL 33437
$-820
Cash flow
-16.5%
Cash-on-Cash Return
2.4%
Cap rate
1.0%
Rent to Value Ratio
Active
$259,900
2
bds
|
2
ba
|
996
sqft
|
built
1986
7 Via De Casas Sur, Boynton Beach, FL 33426
$-1,181
Cash flow
-23.7%
Cash-on-Cash Return
0.7%
Cap rate
0.8%
Rent to Value Ratio
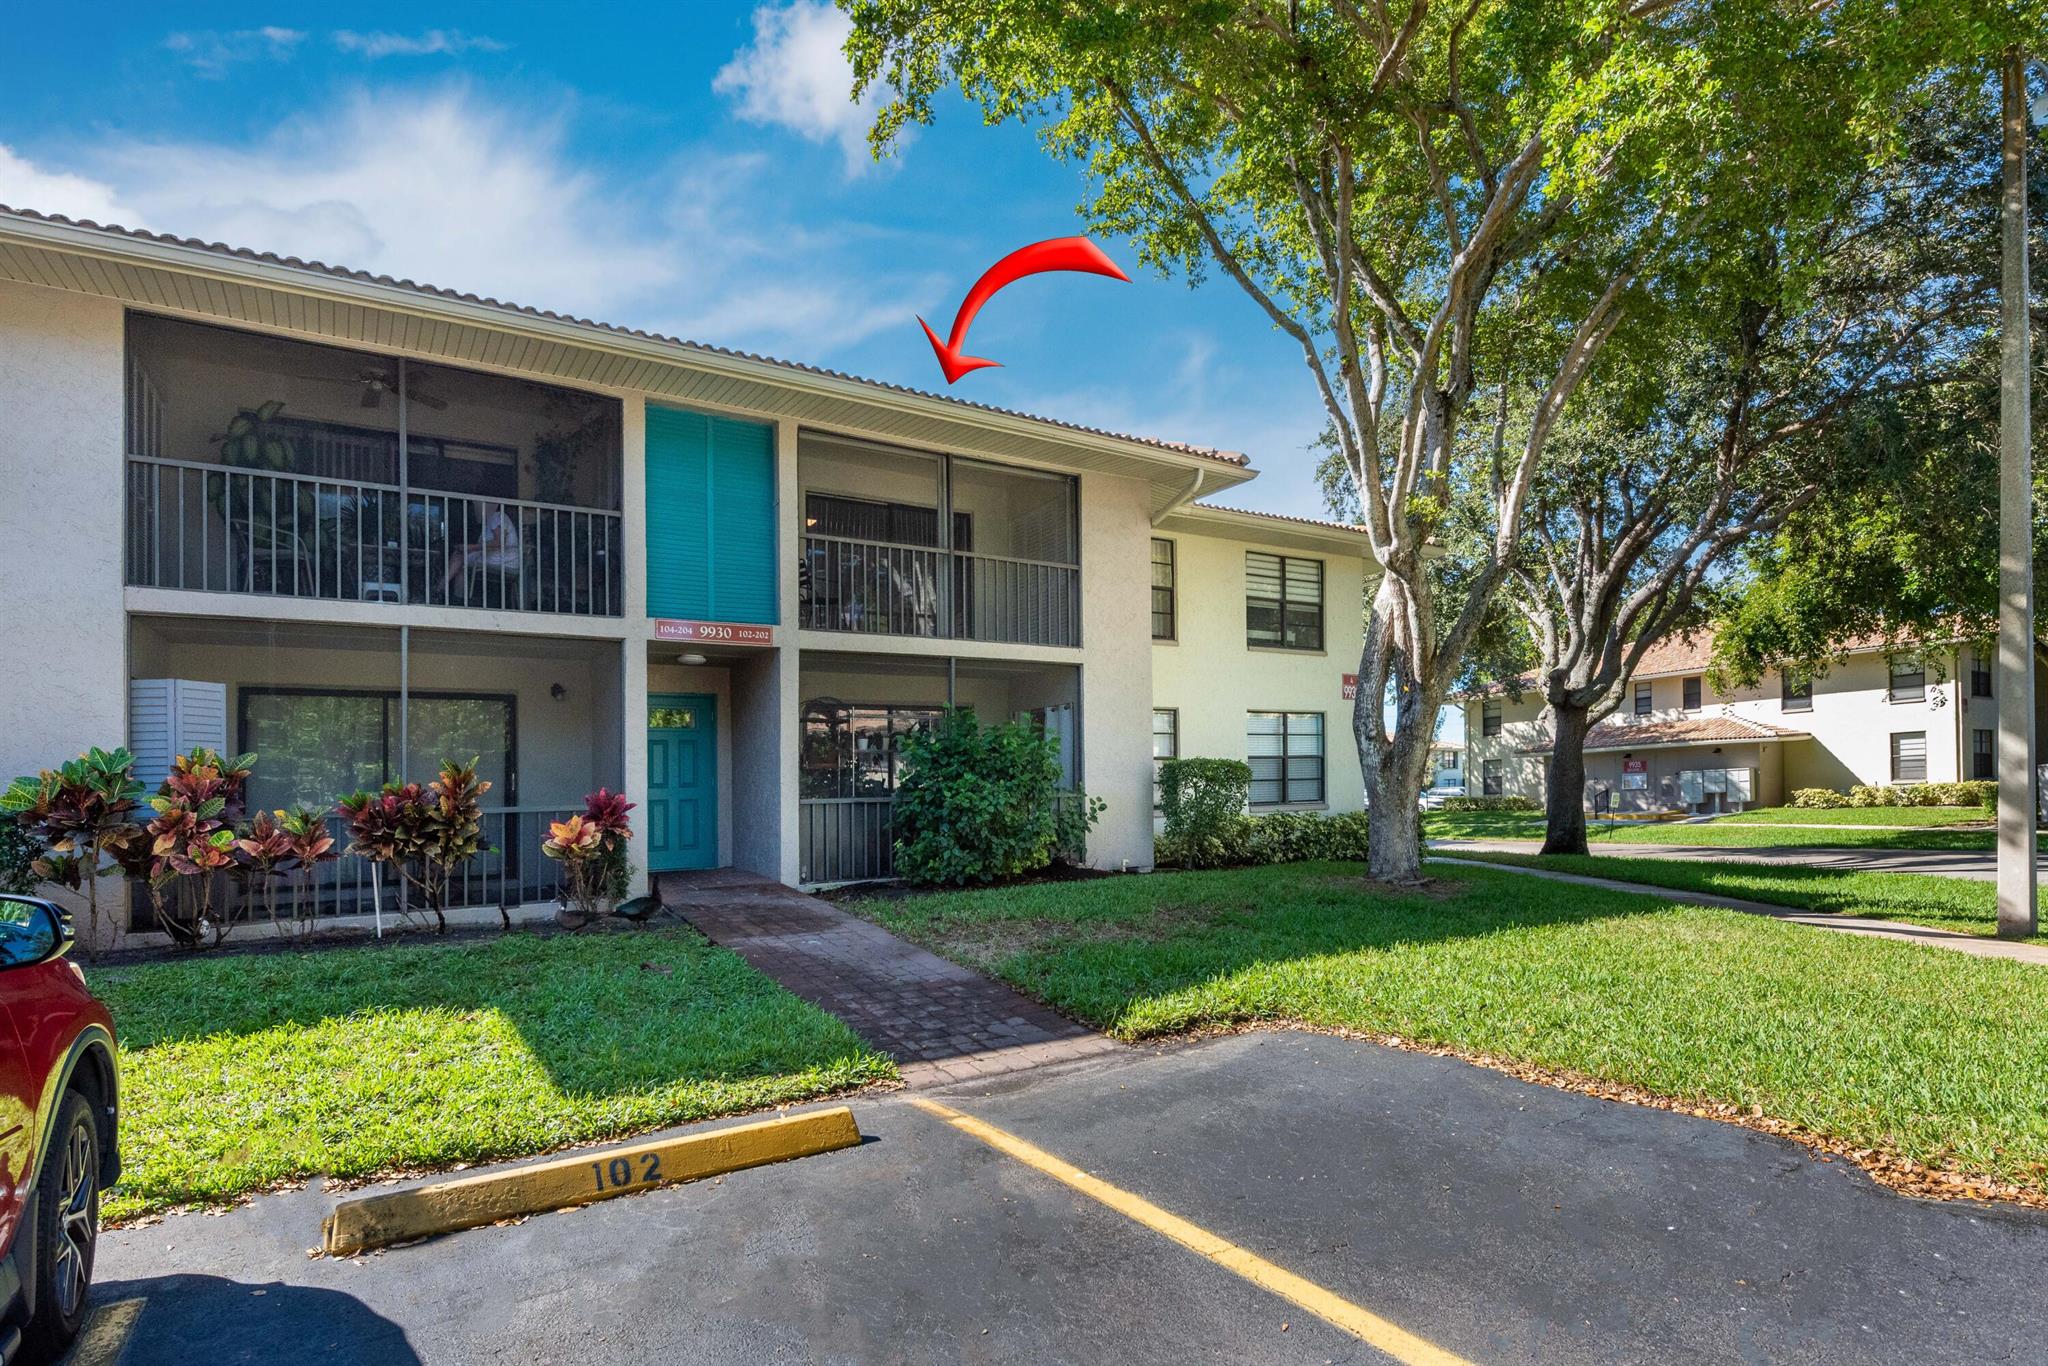
Active
$260,000
2
bds
|
2
ba
|
1,008
sqft
|
built
1981
9930 Pineapple Tree Dr, Boynton Beach, FL 33436
$-375
Cash flow
-7.5%
Cash-on-Cash Return
4.4%
Cap rate
1.0%
Rent to Value Ratio
Active
$235,000
3
bds
|
2
ba
|
1,447
sqft
|
built
1993
5099 Splendido Ct, Boynton Beach, FL 33437
$-676
Cash flow
-15.0%
Cash-on-Cash Return
2.7%
Cap rate
1.1%
Rent to Value Ratio