San Benito County Investment Properties for Sale
Browse homes for sale and investment properties in San Benito County. Refine your search by price, property type, or more.
Best cash flowing properties in San Benito County

Active
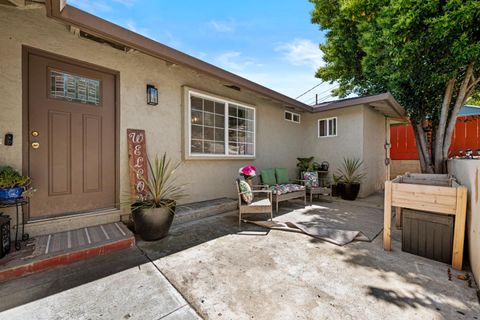
$605,000
3
bds
|
2
ba
|
1,229
sqft
|
built
1955
713 7th St, Hollister, CA 95023
$-1,020
Cash flow
-8.8%
Cash-on-Cash Return
4.2%
Cap rate
0.5%
Rent to Value Ratio
Active
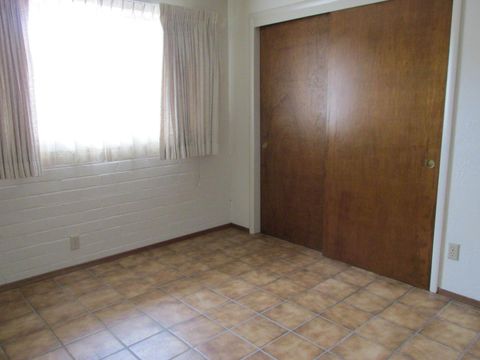
$625,000
3
bds
|
3
ba
|
1,405
sqft
|
built
1963
337 Hill St, Hollister, CA 95023
$-1,055
Cash flow
-8.8%
Cash-on-Cash Return
4.2%
Cap rate
0.5%
Rent to Value Ratio
66 out of 121 properties for sale in San Benito County
Limited Results Shown
Create a free account, or log in to reveal all property listings and enjoy the complete experience.
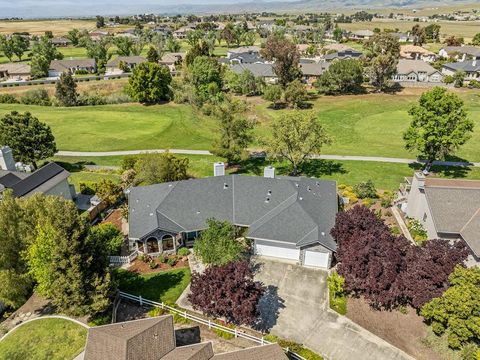
Active
$734,000
3
bds
|
3
ba
|
2,058
sqft
|
built
1948
861 Enterprise Rd, Hollister, CA 95023
$-2,038
Cash flow
-14.5%
Cash-on-Cash Return
2.9%
Cap rate
0.4%
Rent to Value Ratio
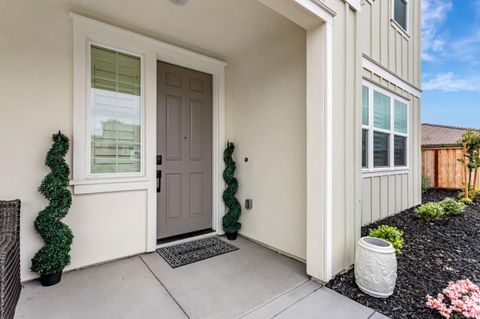
Active
$899,900
3
bds
|
3
ba
|
2,780
sqft
|
built
1988
105 Louise Cir, Hollister, CA 95023
$-1,938
Cash flow
-11.2%
Cash-on-Cash Return
3.7%
Cap rate
0.4%
Rent to Value Ratio
Active
$1,249,950
4
bds
|
4
ba
|
3,249
sqft
|
built
2024
172 Vienna Way, Hollister, CA 95023
$-3,691
Cash flow
-15.4%
Cash-on-Cash Return
2.7%
Cap rate
0.4%
Rent to Value Ratio
Active
$1,625,000
4
bds
|
3
ba
|
3,850
sqft
|
built
1989
290 Bonnie Ln, Hollister, CA 95023
$-3,831
Cash flow
-12.3%
Cash-on-Cash Return
3.4%
Cap rate
0.4%
Rent to Value Ratio

Active
$750,000
3
bds
|
2
ba
|
1,929
sqft
|
built
1990
2030 Clearview Dr, Hollister, CA 95023
$-1,501
Cash flow
-10.4%
Cash-on-Cash Return
3.9%
Cap rate
0.5%
Rent to Value Ratio

Active
$790,000
3
bds
|
2
ba
|
1,960
sqft
|
built
2024
2080 Fuchsia Dr, Hollister, CA 95023
$-2,192
Cash flow
-14.5%
Cash-on-Cash Return
2.9%
Cap rate
0.4%
Rent to Value Ratio
Active
$1,599,000
2
bds
|
1
ba
|
900
sqft
|
built
1990
13160 Cienega Rd, Hollister, CA 95023
$-6,554
Cash flow
-21.4%
Cash-on-Cash Return
1.3%
Cap rate
0.2%
Rent to Value Ratio
Active
$859,000
4
bds
|
3
ba
|
2,206
sqft
|
built
2016
1618 Lily Ct, Hollister, CA 95023
$-1,725
Cash flow
-10.5%
Cash-on-Cash Return
3.9%
Cap rate
0.5%
Rent to Value Ratio
Active
$749,000
4
bds
|
3
ba
|
1,847
sqft
|
built
2000
2260 Ventana Ct, Hollister, CA 95023
$-1,495
Cash flow
-10.4%
Cash-on-Cash Return
3.9%
Cap rate
0.5%
Rent to Value Ratio
Active
$2,300,000
3
bds
|
2
ba
|
2,000
sqft
|
built
1957
4211 Bolsa Rd, Hollister, CA 95023
$-10,283
Cash flow
-23.3%
Cash-on-Cash Return
0.9%
Cap rate
0.1%
Rent to Value Ratio
Active
$815,000
4
bds
|
3
ba
|
2,270
sqft
|
built
1997
2181 Burlwood Dr, Hollister, CA 95023
$-1,495
Cash flow
-9.6%
Cash-on-Cash Return
4.1%
Cap rate
0.5%
Rent to Value Ratio
Active
$799,000
4
bds
|
3
ba
|
2,374
sqft
|
built
2019
410 Thistle Ct, Hollister, CA 95023
$-2,256
Cash flow
-14.7%
Cash-on-Cash Return
2.9%
Cap rate
0.4%
Rent to Value Ratio

Active
$799,999
4
bds
|
3
ba
|
2,159
sqft
|
built
1999
721 Hillock Dr, Hollister, CA 95023
$-1,486
Cash flow
-9.7%
Cash-on-Cash Return
4.0%
Cap rate
0.5%
Rent to Value Ratio

Active
$799,000
3
bds
|
2
ba
|
1,570
sqft
|
built
1960
820 Comstock Rd, Hollister, CA 95023
$-1,480
Cash flow
-9.7%
Cash-on-Cash Return
4.0%
Cap rate
0.5%
Rent to Value Ratio
Active
$749,000
3
bds
|
3
ba
|
1,883
sqft
|
built
2019
515 Shearwater St, Hollister, CA 95023
$-1,513
Cash flow
-10.5%
Cash-on-Cash Return
3.8%
Cap rate
0.5%
Rent to Value Ratio
Active
$715,000
3
bds
|
3
ba
|
1,759
sqft
|
built
2019
545 Shearwater St, Hollister, CA 95023
$-1,335
Cash flow
-9.7%
Cash-on-Cash Return
4.0%
Cap rate
0.5%
Rent to Value Ratio
Active
$625,000
3
bds
|
3
ba
|
1,405
sqft
|
built
1963
337 Hill St, Hollister, CA 95023
$-1,055
Cash flow
-8.8%
Cash-on-Cash Return
4.2%
Cap rate
0.5%
Rent to Value Ratio
Active
$895,000
3
bds
|
3
ba
|
2,580
sqft
|
built
1976
38 Barbras Ct, Hollister, CA 95023
$-3,056
Cash flow
-17.8%
Cash-on-Cash Return
2.2%
Cap rate
0.3%
Rent to Value Ratio
Active
$2,300,000
4
bds
|
4
ba
|
4,308
sqft
|
built
2001
1150 Stony Brook Dr, Hollister, CA 95023
$-8,213
Cash flow
-18.6%
Cash-on-Cash Return
2.0%
Cap rate
0.2%
Rent to Value Ratio
Active
$899,000
4
bds
|
2
ba
|
1,896
sqft
|
built
2021
2880 Grayson Ct, Hollister, CA 95023
$-2,209
Cash flow
-12.8%
Cash-on-Cash Return
3.3%
Cap rate
0.4%
Rent to Value Ratio

Active
$765,000
4
bds
|
2
ba
|
1,738
sqft
|
built
1999
1221 Jacqueline Dr, Hollister, CA 95023
$-1,510
Cash flow
-10.3%
Cash-on-Cash Return
3.9%
Cap rate
0.5%
Rent to Value Ratio
Active
$975,000
5
bds
|
4
ba
|
2,651
sqft
|
built
2020
3076 Palomino Way, Hollister, CA 95023
$-2,054
Cash flow
-11.0%
Cash-on-Cash Return
3.7%
Cap rate
0.5%
Rent to Value Ratio
Active
$798,888
4
bds
|
3
ba
|
1,950
sqft
|
built
1998
1660 Mimosa St, Hollister, CA 95023
$-1,480
Cash flow
-9.7%
Cash-on-Cash Return
4.0%
Cap rate
0.5%
Rent to Value Ratio
Active
$699,900
3
bds
|
2
ba
|
1,441
sqft
|
built
1983
1260 Heather Glen Cir, Hollister, CA 95023
$-1,446
Cash flow
-10.8%
Cash-on-Cash Return
3.8%
Cap rate
0.5%
Rent to Value Ratio
Active
$605,000
3
bds
|
2
ba
|
1,229
sqft
|
built
1955
713 7th St, Hollister, CA 95023
$-1,020
Cash flow
-8.8%
Cash-on-Cash Return
4.2%
Cap rate
0.5%
Rent to Value Ratio
Active
$815,000
4
bds
|
2
ba
|
1,778
sqft
|
built
1998
2351 Driftwood Ct, Hollister, CA 95023
$-1,840
Cash flow
-11.8%
Cash-on-Cash Return
3.6%
Cap rate
0.4%
Rent to Value Ratio