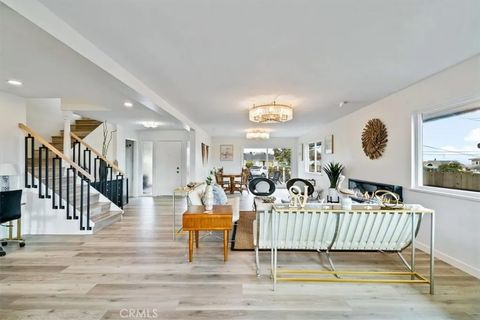
California Investment Properties for Sale
Browse homes for sale and investment properties in California. Refine your search by price, property type, or more.
Best cash flowing properties in California
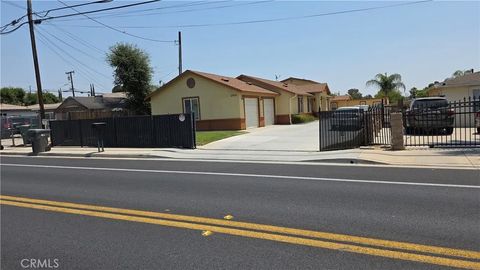
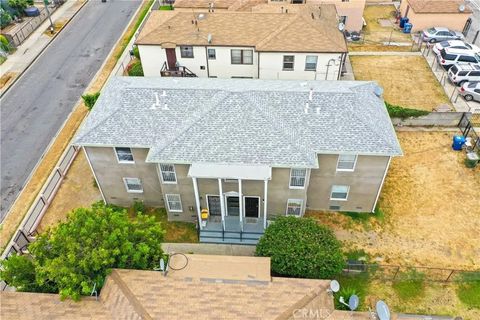
Active
$250,000
4
bds
|
2
ba
|
0
sqft
|
built
1977
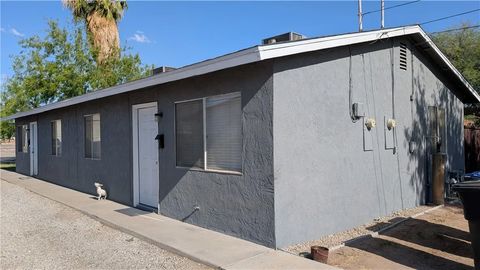
153 S Commercial St, Blythe, CA 92225
$-160
Cash flow
-3.3%
Cash-on-Cash Return
5.3%
Cap rate
0.6%
Rent to Value Ratio
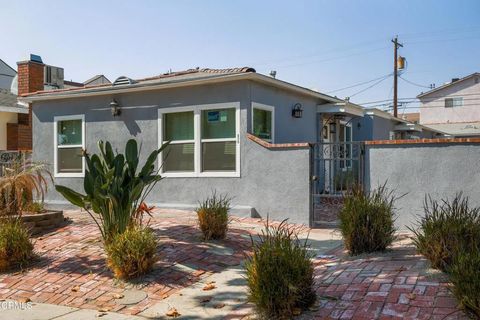
Active
$515,000
2
bds
|
3
ba
|
2,152
sqft
|
built
2019
43601 Brovello Dr, Indio, CA 92203
$-489
Cash flow
-5.0%
Cash-on-Cash Return
4.9%
Cap rate
0.7%
Rent to Value Ratio
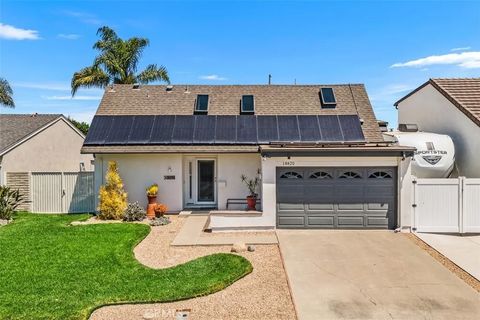
5,064 out of 27,623 properties for sale in California
Limited Results Shown
Create a free account, or log in to reveal all property listings and enjoy the complete experience.
Active
$1,639,000
9
bds
|
5
ba
|
0
sqft
|
built
1962
1103 S Hobart Blvd, Los Angeles, CA 90006
$-6,356
Cash flow
-20.2%
Cash-on-Cash Return
1.4%
Cap rate
0.2%
Rent to Value Ratio
Active
$2,100,000
3
bds
|
3
ba
|
2,850
sqft
|
built
1979
1694 Torrance St, San Diego, CA 92103
$-5,651
Cash flow
-14.0%
Cash-on-Cash Return
2.8%
Cap rate
0.3%
Rent to Value Ratio

Active
$849,000
3
bds
|
3
ba
|
1,653
sqft
|
built
2003
1250 Sand Drift Pt, San Diego, CA 92154
$-1,588
Cash flow
-9.8%
Cash-on-Cash Return
3.8%
Cap rate
0.5%
Rent to Value Ratio

Active
$1,725,000
6
bds
|
4
ba
|
0
sqft
|
built
1922
3252 Cattaraugus Ave, Los Angeles, CA 90034
$-4,376
Cash flow
-13.2%
Cash-on-Cash Return
3.0%
Cap rate
0.4%
Rent to Value Ratio
Active
$2,995,000
5
bds
|
5
ba
|
0
sqft
|
built
1926
542 N Kilkea Dr, Los Angeles, CA 90048
$-11,763
Cash flow
-20.5%
Cash-on-Cash Return
1.4%
Cap rate
0.2%
Rent to Value Ratio
Active
$1,420,000
3
bds
|
3
ba
|
2,309
sqft
|
built
2019
3072 Marron Rd, Carlsbad, CA 92010
$-3,115
Cash flow
-11.4%
Cash-on-Cash Return
3.4%
Cap rate
0.5%
Rent to Value Ratio

Active
$2,050,000
5
bds
|
4
ba
|
5,084
sqft
|
built
2017
16094 Mariposa Ave, Riverside, CA 92504
$-4,846
Cash flow
-12.3%
Cash-on-Cash Return
3.2%
Cap rate
0.4%
Rent to Value Ratio
Active
$3,360,000
4
bds
|
5
ba
|
4,194
sqft
|
built
1973
6347 Las Colinas, Rancho Santa Fe, CA 92067
$-9,193
Cash flow
-14.3%
Cash-on-Cash Return
2.8%
Cap rate
0.3%
Rent to Value Ratio
Active
$1,438,000
4
bds
|
3
ba
|
1,707
sqft
|
built
1996
31 Cayman Brac, Aliso Viejo, CA 92656
$-3,391
Cash flow
-12.3%
Cash-on-Cash Return
3.2%
Cap rate
0.4%
Rent to Value Ratio

Active
$1,557,000
9
bds
|
8
ba
|
0
sqft
|
built
1978
1727 E Natalie Ave, West Covina, CA 91792
$-6,280
Cash flow
-21.0%
Cash-on-Cash Return
1.2%
Cap rate
0.2%
Rent to Value Ratio

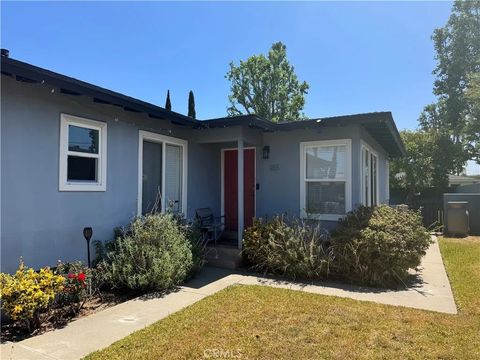
Active
$765,000
3
bds
|
2
ba
|
1,725
sqft
|
built
1967
1477 E Madison Ave, El Cajon, CA 92019
$-1,039
Cash flow
-7.1%
Cash-on-Cash Return
4.4%
Cap rate
0.5%
Rent to Value Ratio
Active
$1,198,000
8
bds
|
4
ba
|
0
sqft
|
built
1955
12902 Indian St, Moreno Valley, CA 92553
$-4,126
Cash flow
-18.0%
Cash-on-Cash Return
1.9%
Cap rate
0.2%
Rent to Value Ratio
Active
$2,750,000
8
bds
|
8
ba
|
0
sqft
|
built
1954
1830 E Villa St, Pasadena, CA 91107
$-11,491
Cash flow
-21.8%
Cash-on-Cash Return
1.1%
Cap rate
0.1%
Rent to Value Ratio
Active
$1,349,000
4
bds
|
2
ba
|
0
sqft
|
built
1952
185 N Batavia St, Orange, CA 92868
$-4,889
Cash flow
-18.9%
Cash-on-Cash Return
1.7%
Cap rate
0.2%
Rent to Value Ratio
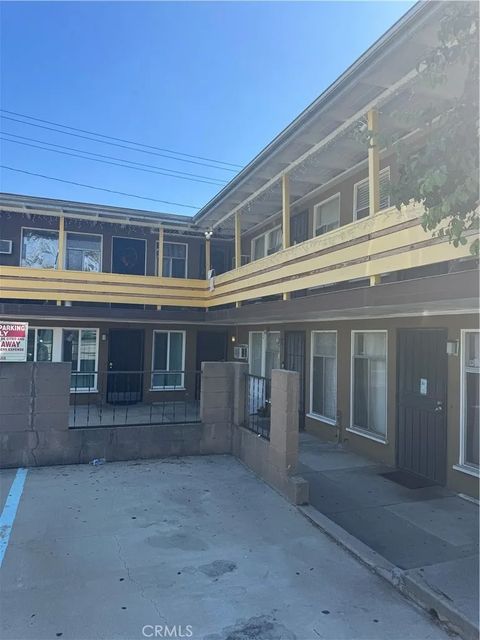
Active
$1,335,000
7
bds
|
6
ba
|
0
sqft
|
built
2010
1038 E 8th St, National City, CA 91950
$-4,335
Cash flow
-16.9%
Cash-on-Cash Return
2.2%
Cap rate
0.3%
Rent to Value Ratio

Active
$375,000
2
bds
|
2
ba
|
1,632
sqft
|
built
2018
18935 Lariat St, Apple Valley, CA 92308
$-494
Cash flow
-6.9%
Cash-on-Cash Return
4.5%
Cap rate
0.6%
Rent to Value Ratio
Active
$3,249,900
7
bds
|
0
ba
|
0
sqft
|
built
1966
31 N 3rd St, Cayucos, CA 93430
$-14,432
Cash flow
-23.2%
Cash-on-Cash Return
0.7%
Cap rate
0.1%
Rent to Value Ratio
Active
$610,000
5
bds
|
3
ba
|
2,469
sqft
|
built
2007
29104 Escalante Rd, Canyon Lake, CA 92587
$-1,045
Cash flow
-8.9%
Cash-on-Cash Return
4.0%
Cap rate
0.5%
Rent to Value Ratio
Active
$795,000
5
bds
|
3
ba
|
2,434
sqft
|
built
2001
32991 Adelante St, Temecula, CA 92592
$-1,794
Cash flow
-11.8%
Cash-on-Cash Return
3.4%
Cap rate
0.4%
Rent to Value Ratio

Active
$1,895,000
5
bds
|
3
ba
|
3,366
sqft
|
built
1990
3412 Buena Creek Rd, Vista, CA 92084
$-3,510
Cash flow
-9.7%
Cash-on-Cash Return
3.8%
Cap rate
0.5%
Rent to Value Ratio
Active
$619,000
3
bds
|
3
ba
|
2,028
sqft
|
built
1960
211 Sunset Dr, Lake Arrowhead, CA 92352
$-1,543
Cash flow
-13.0%
Cash-on-Cash Return
3.1%
Cap rate
0.4%
Rent to Value Ratio
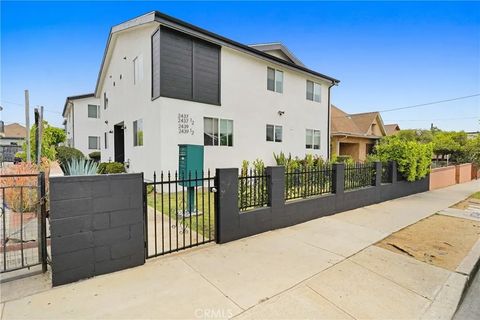
Active
$2,500,000
16
bds
|
12
ba
|
0
sqft
|
built
1909
2437 Malabar St, Los Angeles, CA 90033
$-10,433
Cash flow
-21.8%
Cash-on-Cash Return
1.1%
Cap rate
0.1%
Rent to Value Ratio

Active
$1,059,000
4
bds
|
3
ba
|
2,350
sqft
|
built
1964
1835 Westward Ho Cir, El Cajon, CA 92021
$-2,250
Cash flow
-11.1%
Cash-on-Cash Return
3.5%
Cap rate
0.4%
Rent to Value Ratio
Active
$1,089,900
4
bds
|
2
ba
|
1,522
sqft
|
built
1974
13218 Olive Grove Dr, Poway, CA 92064
$-2,475
Cash flow
-11.8%
Cash-on-Cash Return
3.3%
Cap rate
0.4%
Rent to Value Ratio
Active
$649,000
4
bds
|
3
ba
|
2,000
sqft
|
built
1964
28721 Lebanon Rd, Pine Valley, CA 91962
$-798
Cash flow
-6.4%
Cash-on-Cash Return
4.6%
Cap rate
0.6%
Rent to Value Ratio

Active
$880,000
4
bds
|
3
ba
|
1,818
sqft
|
built
1984
11438 Pegeen Pl, El Cajon, CA 92021
$-1,483
Cash flow
-8.8%
Cash-on-Cash Return
4.0%
Cap rate
0.5%
Rent to Value Ratio
Active
$1,050,000
4
bds
|
3
ba
|
1,912
sqft
|
built
1954
6333 Bigelow St, Lakewood, CA 90713
$-2,273
Cash flow
-11.3%
Cash-on-Cash Return
3.5%
Cap rate
0.4%
Rent to Value Ratio
Active
$775,000
2
bds
|
1
ba
|
1,050
sqft
|
built
1957
3135 S Bonita St, Spring Valley, CA 91977
$-1,435
Cash flow
-9.7%
Cash-on-Cash Return
3.8%
Cap rate
0.5%
Rent to Value Ratio
Active
$1,350,000
3
bds
|
2
ba
|
1,152
sqft
|
built
1959
1230 Tamarack Ave, Carlsbad, CA 92008
$-3,445
Cash flow
-13.3%
Cash-on-Cash Return
3.0%
Cap rate
0.4%
Rent to Value Ratio
Active
$800,000
3
bds
|
2
ba
|
1,753
sqft
|
built
1957
15043 Tuba St, Mission Hills, CA 91345
$-1,354
Cash flow
-8.8%
Cash-on-Cash Return
4.0%
Cap rate
0.5%
Rent to Value Ratio
Active
$1,297,000
6
bds
|
3
ba
|
3,057
sqft
|
built
1977
6036 Eastwood Ave, Alta Loma, CA 91737
$-3,177
Cash flow
-12.8%
Cash-on-Cash Return
3.1%
Cap rate
0.4%
Rent to Value Ratio

Active
$1,699,000
4
bds
|
3
ba
|
2,030
sqft
|
built
1982
3526 Ticonderoga St, San Diego, CA 92117
$-4,727
Cash flow
-14.5%
Cash-on-Cash Return
2.7%
Cap rate
0.3%
Rent to Value Ratio
Active
$1,399,999
8
bds
|
4
ba
|
0
sqft
|
built
1945
1931 W 35th St, Los Angeles, CA 90018
$-5,354
Cash flow
-20.0%
Cash-on-Cash Return
1.5%
Cap rate
0.2%
Rent to Value Ratio
Active
$1,695,000
5
bds
|
4
ba
|
0
sqft
|
built
1948
315 E Valencia Ave, Burbank, CA 91502
$-6,363
Cash flow
-19.6%
Cash-on-Cash Return
1.6%
Cap rate
0.2%
Rent to Value Ratio

Active
$1,029,000
4
bds
|
3
ba
|
2,733
sqft
|
built
2002
2157 Crystal Clear Dr, Spring Valley, CA 91978
$-1,648
Cash flow
-8.4%
Cash-on-Cash Return
4.1%
Cap rate
0.5%
Rent to Value Ratio
Active
$1,600,000
5
bds
|
3
ba
|
2,334
sqft
|
built
1970
18820 Cordata St, Fountain Valley, CA 92708
$-4,295
Cash flow
-14.0%
Cash-on-Cash Return
2.8%
Cap rate
0.3%
Rent to Value Ratio
Active
$1,445,000
4
bds
|
3
ba
|
2,582
sqft
|
built
1975
4375 Calle De Vida, San Diego, CA 92124
$-3,305
Cash flow
-11.9%
Cash-on-Cash Return
3.3%
Cap rate
0.4%
Rent to Value Ratio
Active
$544,999
2
bds
|
1
ba
|
938
sqft
|
built
1949
2208 W Olympic Blvd, Montebello, CA 90640
$-755
Cash flow
-7.2%
Cash-on-Cash Return
4.4%
Cap rate
0.5%
Rent to Value Ratio