Chicopee, MA Investment Properties for Sale
Browse homes for sale and investment properties in Chicopee, MA. Refine your search by price, property type, or more.
Best cash flowing properties in Chicopee, MA
Active
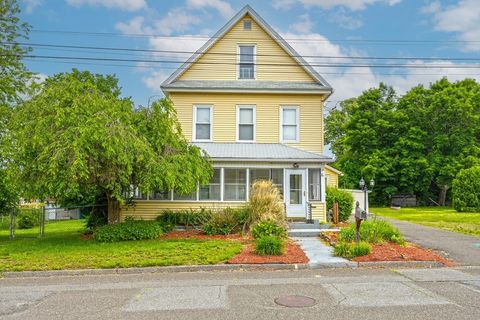
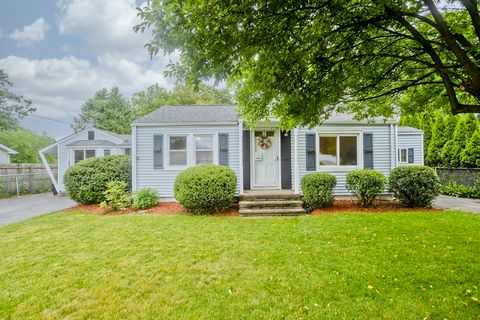
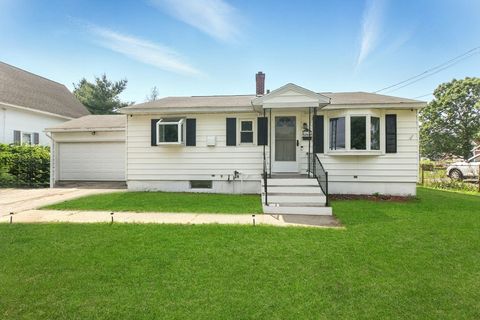
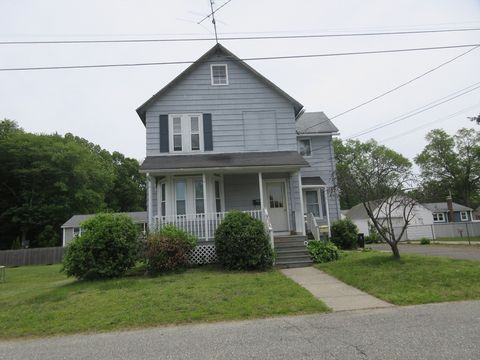
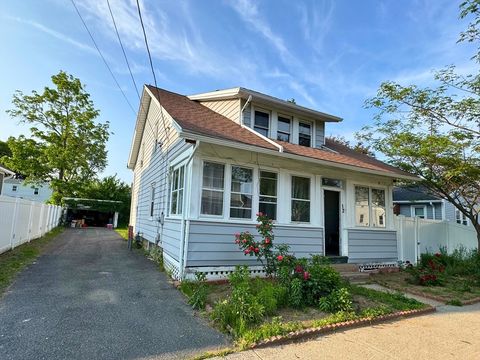
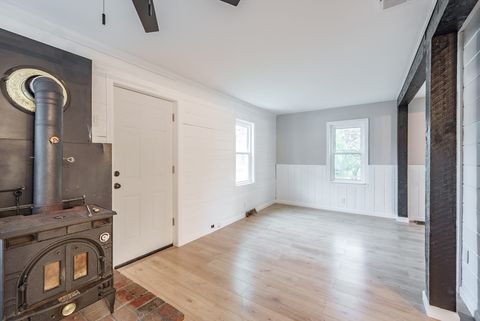
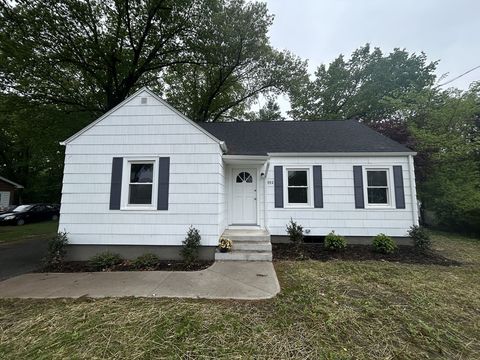
$310,000
3
bds
|
2
ba
|
1,914
sqft
|
built
1915
38 Nye St, Chicopee, MA 01020
$1
Cash flow
0.0%
Cash-on-Cash Return
6.3%
Cap rate
0.9%
Rent to Value Ratio
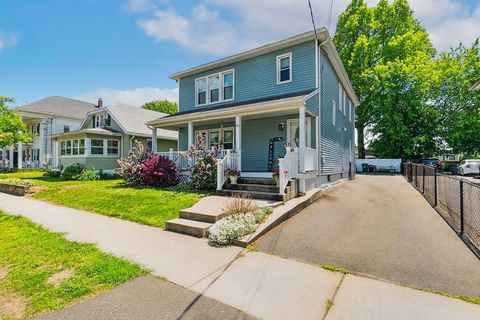
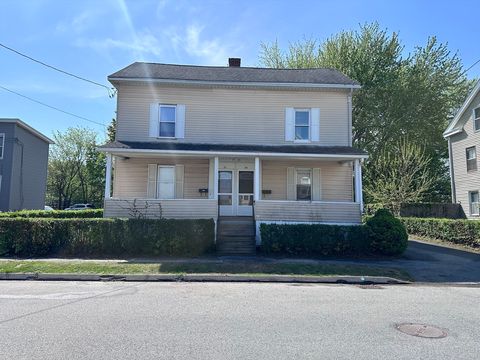
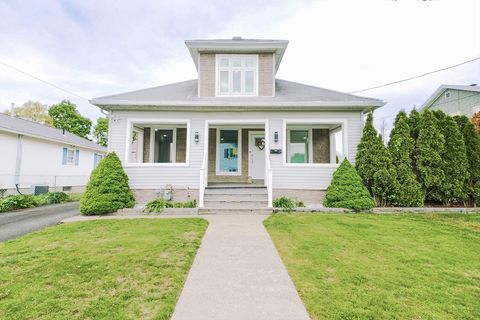
Active
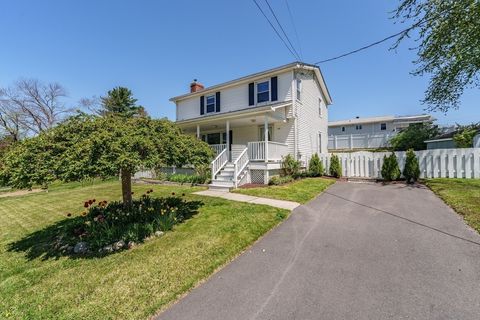
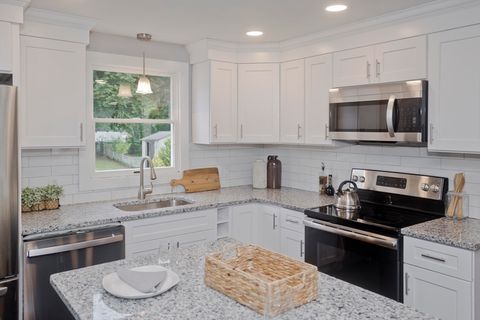
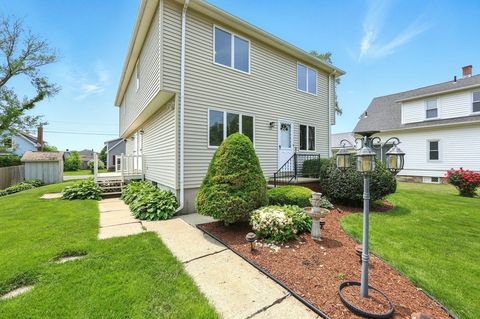
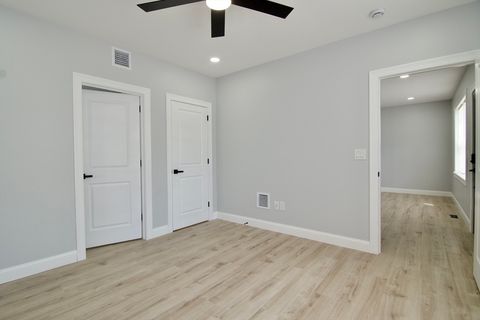
$324,900
3
bds
|
2
ba
|
1,470
sqft
|
built
1980
48 Laclede Ave, Chicopee, MA 01020
$-135
Cash flow
-2.2%
Cash-on-Cash Return
5.8%
Cap rate
0.9%
Rent to Value Ratio
29 out of 33 properties for sale in Chicopee, MA
Limited Results Shown
Create a free account, or log in to reveal all property listings and enjoy the complete experience.
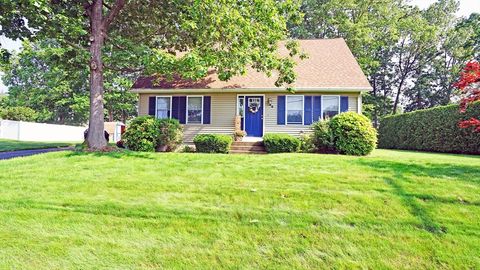
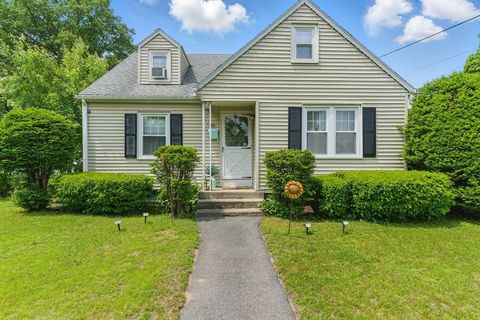
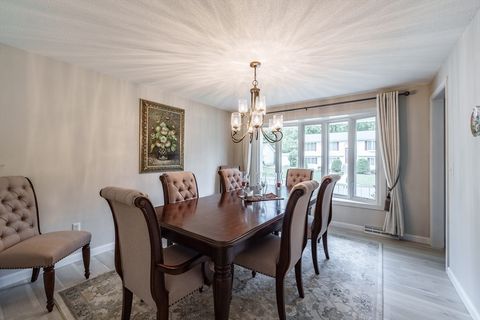
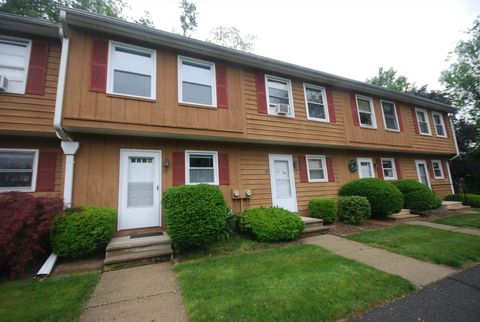
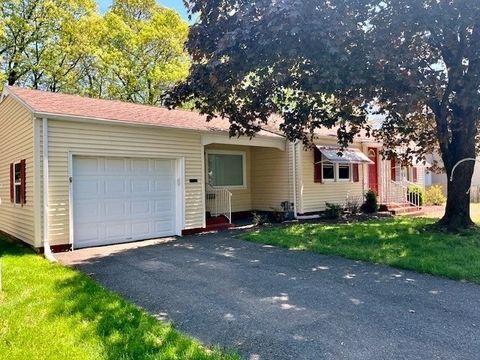
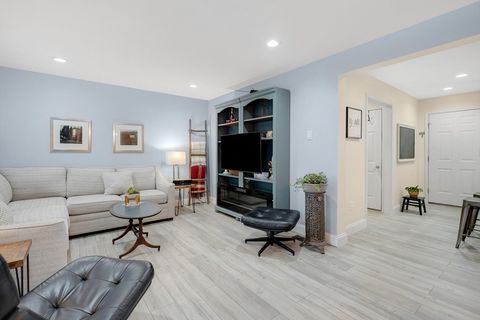
Pending
$350,000
3
bds
|
2
ba
|
1,426
sqft
|
built
1997
30 Dobek Ave, Chicopee, MA 01020
$-338
Cash flow
-5.0%
Cash-on-Cash Return
5.1%
Cap rate
0.8%
Rent to Value Ratio
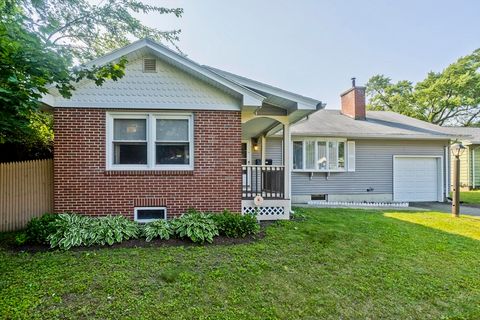
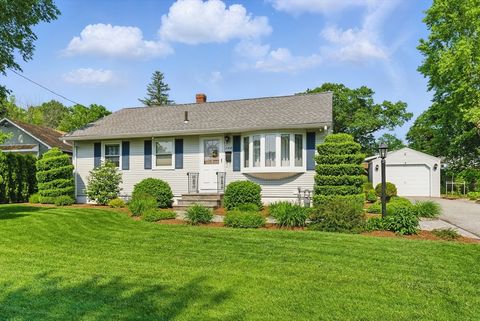
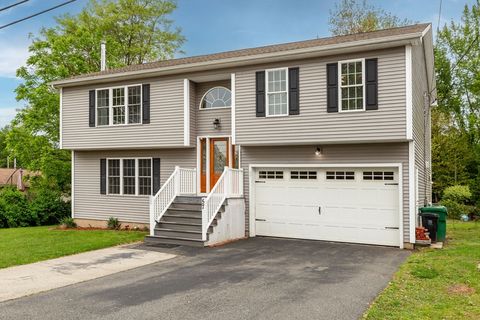
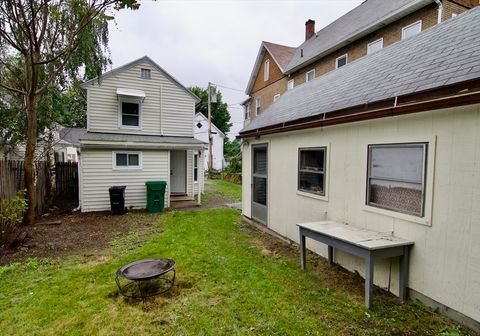
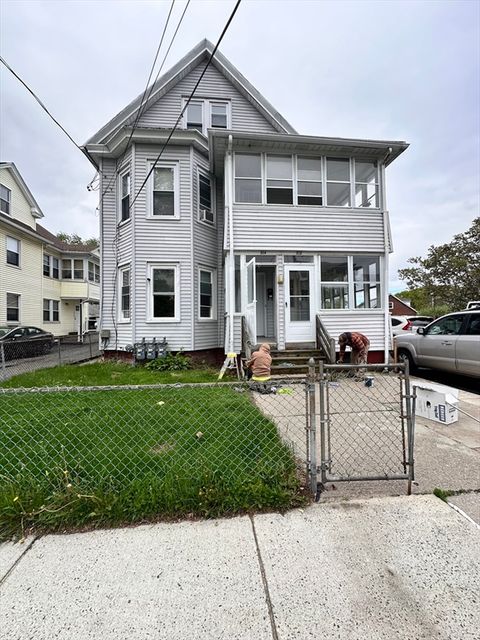
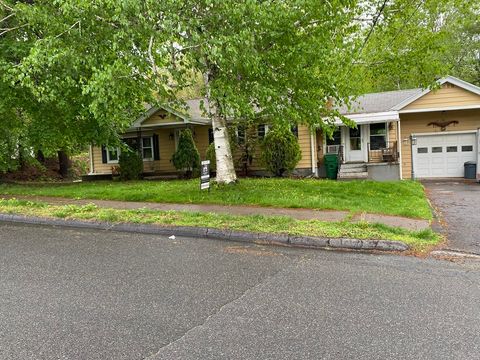
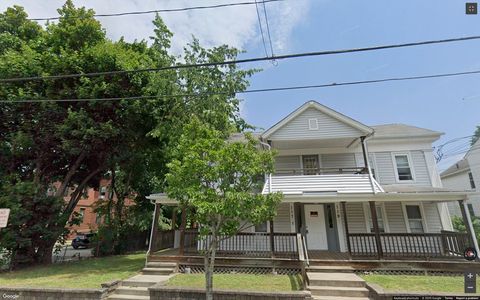
Active
$319,900
3
bds
|
1
ba
|
1,299
sqft
|
built
1955
70 Watson St, Chicopee, MA 01020
$-156
Cash flow
-2.5%
Cash-on-Cash Return
5.7%
Cap rate
0.9%
Rent to Value Ratio

Active
$295,000
4
bds
|
2
ba
|
1,892
sqft
|
built
1910
13 Beston St, Chicopee, MA 01013
$-410
Cash flow
-7.3%
Cash-on-Cash Return
4.6%
Cap rate
0.7%
Rent to Value Ratio
Active
$347,750
3
bds
|
2
ba
|
1,865
sqft
|
built
1950
12 Allen St, Chicopee, MA 01020
$-405
Cash flow
-6.1%
Cash-on-Cash Return
4.9%
Cap rate
0.7%
Rent to Value Ratio
Active
$325,000
4
bds
|
1
ba
|
1,170
sqft
|
built
1952
3 Graham Dr, Chicopee, MA 01013
$-498
Cash flow
-8.0%
Cash-on-Cash Return
4.4%
Cap rate
0.7%
Rent to Value Ratio
Active under contract
$299,900
4
bds
|
1
ba
|
1,452
sqft
|
built
1948
80 Frontenac St, Chicopee, MA 01020
$-184
Cash flow
-3.2%
Cash-on-Cash Return
5.5%
Cap rate
0.8%
Rent to Value Ratio
Active under contract
$349,900
3
bds
|
2
ba
|
1,724
sqft
|
built
1955
108 Boulay Cir, Chicopee, MA 01020
$-425
Cash flow
-6.3%
Cash-on-Cash Return
4.8%
Cap rate
0.7%
Rent to Value Ratio
Pending
$255,000
3
bds
|
1
ba
|
884
sqft
|
built
1959
42 Jacob St, Chicopee, MA 01020
$-246
Cash flow
-5.0%
Cash-on-Cash Return
5.1%
Cap rate
0.8%
Rent to Value Ratio
Active
$310,000
3
bds
|
2
ba
|
1,914
sqft
|
built
1915
38 Nye St, Chicopee, MA 01020
$1
Cash flow
0.0%
Cash-on-Cash Return
6.3%
Cap rate
0.9%
Rent to Value Ratio
Pending
$395,000
4
bds
|
4
ba
|
2,100
sqft
|
built
1992
35 Lawndale St, Chicopee, MA 01013
$-881
Cash flow
-11.6%
Cash-on-Cash Return
3.6%
Cap rate
0.6%
Rent to Value Ratio
Active
$610,000
4
bds
|
4
ba
|
2,620
sqft
|
built
1994
35 Dejordy Ln, Chicopee, MA 01020
$-1,277
Cash flow
-10.9%
Cash-on-Cash Return
3.8%
Cap rate
0.6%
Rent to Value Ratio
Active
$409,900
3
bds
|
2
ba
|
1,928
sqft
|
built
2011
57 Larchmont St, Chicopee, MA 01013
$-660
Cash flow
-8.4%
Cash-on-Cash Return
4.3%
Cap rate
0.7%
Rent to Value Ratio
Active
$319,000
5
bds
|
2
ba
|
1,748
sqft
|
built
1900
97 Lombard St, Chicopee, MA 01020
$-538
Cash flow
-8.8%
Cash-on-Cash Return
4.2%
Cap rate
0.7%
Rent to Value Ratio
Active
$364,900
3
bds
|
2
ba
|
2,080
sqft
|
built
1928
63 Beverly St, Chicopee, MA 01013
$-324
Cash flow
-4.6%
Cash-on-Cash Return
5.2%
Cap rate
0.8%
Rent to Value Ratio
Active under contract
$197,900
1
bds
|
2
ba
|
756
sqft
|
built
1986
343 Chicopee St, Chicopee, MA 01013
$-352
Cash flow
-9.3%
Cash-on-Cash Return
4.1%
Cap rate
0.8%
Rent to Value Ratio
Pending
$249,900
2
bds
|
1
ba
|
928
sqft
|
built
1880
25 Spring St, Chicopee, MA 01013
$-260
Cash flow
-5.4%
Cash-on-Cash Return
5.0%
Cap rate
0.7%
Rent to Value Ratio
Active
$249,999
2
bds
|
2
ba
|
1,274
sqft
|
built
1914
32 Marble Ave, Chicopee, MA 01013
$-194
Cash flow
-4.0%
Cash-on-Cash Return
5.3%
Cap rate
0.8%
Rent to Value Ratio
Active
$380,000
4
bds
|
4
ba
|
2,117
sqft
|
built
1880
27 Abbey St, Chicopee, MA 01013
$-777
Cash flow
-10.7%
Cash-on-Cash Return
3.8%
Cap rate
0.6%
Rent to Value Ratio
Active
$319,900
3
bds
|
1
ba
|
1,080
sqft
|
built
1952
29 Barby Ave, Chicopee, MA 01020
$-314
Cash flow
-5.1%
Cash-on-Cash Return
5.1%
Cap rate
0.8%
Rent to Value Ratio
Active
$515,000
8
bds
|
3
ba
|
3,111
sqft
|
built
1930
212 Hampden St, Chicopee, MA 01013
$-1,575
Cash flow
-16.0%
Cash-on-Cash Return
2.6%
Cap rate
0.4%
Rent to Value Ratio
Active
$309,990
3
bds
|
2
ba
|
1,502
sqft
|
built
1900
19 Montello Rd, Chicopee, MA 01013
$-271
Cash flow
-4.6%
Cash-on-Cash Return
5.2%
Cap rate
0.8%
Rent to Value Ratio
Active
$424,900
3
bds
|
3
ba
|
2,195
sqft
|
built
1922
41 Sullivan St, Chicopee, MA 01020
$-510
Cash flow
-6.3%
Cash-on-Cash Return
4.8%
Cap rate
0.7%
Rent to Value Ratio
Active
$315,900
2
bds
|
1
ba
|
1,712
sqft
|
built
1958
126 Casino Ave, Chicopee, MA 01013
$-298
Cash flow
-4.9%
Cash-on-Cash Return
5.1%
Cap rate
0.8%
Rent to Value Ratio
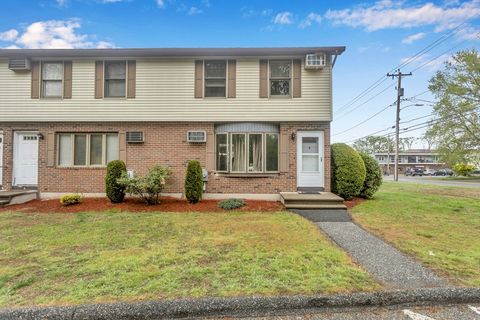
Active
$227,400
2
bds
|
2
ba
|
936
sqft
|
built
1986
340 Dale St, Chicopee, MA 01013
$-529
Cash flow
-12.1%
Cash-on-Cash Return
3.5%
Cap rate
0.8%
Rent to Value Ratio
Active
$324,900
3
bds
|
2
ba
|
1,470
sqft
|
built
1980
48 Laclede Ave, Chicopee, MA 01020
$-135
Cash flow
-2.2%
Cash-on-Cash Return
5.8%
Cap rate
0.9%
Rent to Value Ratio
Active
$329,900
3
bds
|
1
ba
|
989
sqft
|
built
1940
592 Prospect St, Chicopee, MA 01020
$-440
Cash flow
-7.0%
Cash-on-Cash Return
4.7%
Cap rate
0.7%
Rent to Value Ratio
Active
$575,000
5
bds
|
4
ba
|
2,300
sqft
|
built
1926
664 Mc Kinstry Ave, Chicopee, MA 01020
$-2,058
Cash flow
-18.7%
Cash-on-Cash Return
2.0%
Cap rate
0.3%
Rent to Value Ratio
Pending
$325,900
2
bds
|
2
ba
|
1,352
sqft
|
built
1998
585 Sheridan St, Chicopee, MA 01020
$-746
Cash flow
-11.9%
Cash-on-Cash Return
3.5%
Cap rate
0.7%
Rent to Value Ratio
Active
$475,000
6
bds
|
5
ba
|
2,603
sqft
|
built
1905
119 Grape St, Chicopee, MA 01013
$-1,334
Cash flow
-14.7%
Cash-on-Cash Return
2.9%
Cap rate
0.5%
Rent to Value Ratio