Cypress, TX Investment Properties for Sale
Browse homes for sale and investment properties in Cypress, TX. Refine your search by price, property type, or more.
Best cash flowing properties in Cypress, TX

Active
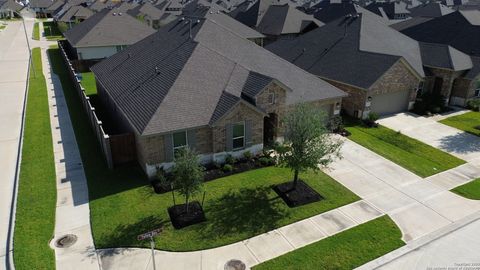
$367,000
3
bds
|
2
ba
|
2,132
sqft
|
built
2023
7703 Coral Key Dr, Cypress, TX 77433
$-210
Cash flow
-3.0%
Cash-on-Cash Return
5.6%
Cap rate
0.7%
Rent to Value Ratio

Active
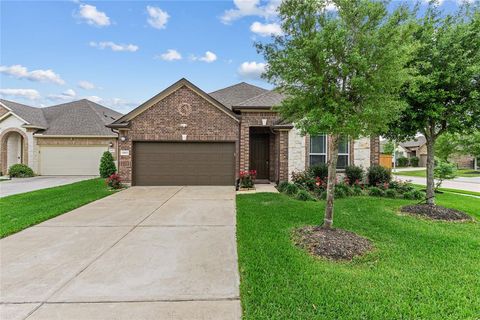
$420,000
4
bds
|
0
ba
|
2,982
sqft
|
built
2006
21739 W Mulberry Field Cir, Cypress, TX 77433
$-342
Cash flow
-4.2%
Cash-on-Cash Return
5.3%
Cap rate
0.7%
Rent to Value Ratio
720 out of 888 properties for sale in Cypress, TX
Limited Results Shown
Create a free account, or log in to reveal all property listings and enjoy the complete experience.
Active
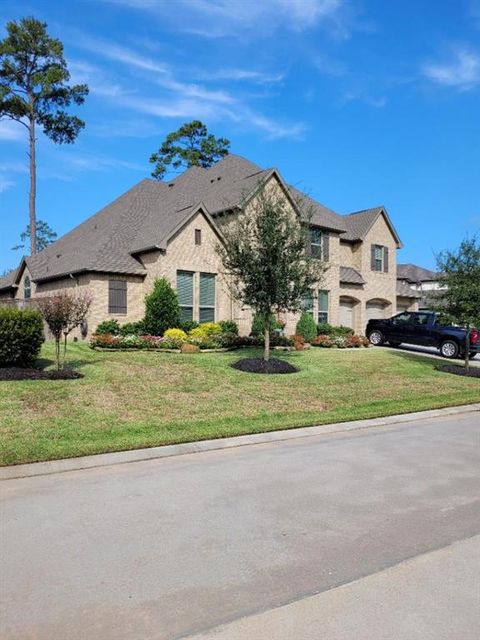
$510,000
4
bds
|
3
ba
|
3,111
sqft
|
built
2021
21138 Yellow Bay Dr, Cypress, TX 77433
$-372
Cash flow
-3.8%
Cash-on-Cash Return
5.4%
Cap rate
0.7%
Rent to Value Ratio
Active
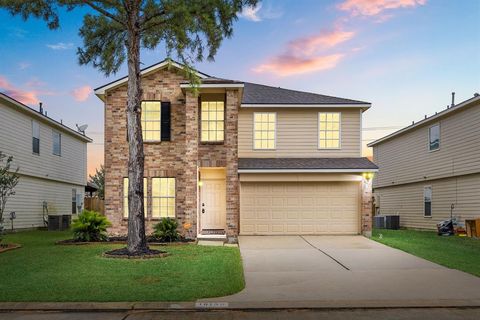
$367,000
3
bds
|
2
ba
|
2,132
sqft
|
built
2023
7703 Coral Key Dr, Cypress, TX 77433
$-210
Cash flow
-3.0%
Cash-on-Cash Return
5.6%
Cap rate
0.7%
Rent to Value Ratio

Active
$1,285,000
5
bds
|
0
ba
|
5,341
sqft
|
built
2020
13622 E Palomino Lake Cir, Cypress, TX 77429
$-5,796
Cash flow
-23.5%
Cash-on-Cash Return
0.9%
Cap rate
0.4%
Rent to Value Ratio
Active
$315,000
3
bds
|
0
ba
|
1,518
sqft
|
built
2018
19815 Caprock Falls Ct, Cypress, TX 77433
$-841
Cash flow
-13.9%
Cash-on-Cash Return
3.1%
Cap rate
0.7%
Rent to Value Ratio

Active
$530,000
4
bds
|
0
ba
|
3,027
sqft
|
built
2016
11202 Puckett River Dr, Cypress, TX 77433
$-442
Cash flow
-4.4%
Cash-on-Cash Return
5.3%
Cap rate
0.7%
Rent to Value Ratio

Active
$399,000
3
bds
|
0
ba
|
2,131
sqft
|
built
2016
9135 Monarch Field Ln, Cypress, TX 77433
$-1,104
Cash flow
-14.4%
Cash-on-Cash Return
2.9%
Cap rate
0.7%
Rent to Value Ratio
Active
$790,000
5
bds
|
0
ba
|
4,670
sqft
|
built
2019
13402 Wedgewood Thicket Way, Cypress, TX 77429
$-2,964
Cash flow
-19.6%
Cash-on-Cash Return
1.8%
Cap rate
0.5%
Rent to Value Ratio

Active
$630,000
3
bds
|
0
ba
|
2,476
sqft
|
built
2019
10630 Hazel Hills Dr, Cypress, TX 77433
$-1,158
Cash flow
-9.6%
Cash-on-Cash Return
4.1%
Cap rate
0.5%
Rent to Value Ratio

Active
$750,000
4
bds
|
0
ba
|
3,625
sqft
|
built
2021
11626 Whitewave Bend Ct, Cypress, TX 77433
$-1,822
Cash flow
-12.7%
Cash-on-Cash Return
3.4%
Cap rate
0.7%
Rent to Value Ratio

Active
$329,786
4
bds
|
0
ba
|
1,866
sqft
|
built
2019
20231 Creekdale Bend Dr, Cypress, TX 77433
$-1,049
Cash flow
-16.6%
Cash-on-Cash Return
2.4%
Cap rate
0.7%
Rent to Value Ratio

Active
$679,450
4
bds
|
0
ba
|
3,927
sqft
|
built
1997
14810 Cantwell Bnd, Cypress, TX 77429
$-2,439
Cash flow
-18.7%
Cash-on-Cash Return
2.0%
Cap rate
0.5%
Rent to Value Ratio

Active
$349,000
3
bds
|
0
ba
|
2,144
sqft
|
built
2017
17023 Canosa Dr, Cypress, TX 77433
$-990
Cash flow
-14.8%
Cash-on-Cash Return
2.9%
Cap rate
0.8%
Rent to Value Ratio

Active
$525,000
4
bds
|
0
ba
|
3,085
sqft
|
built
2011
10518 Kicking Horse Pass, Cypress, TX 77433
$-1,151
Cash flow
-11.4%
Cash-on-Cash Return
3.6%
Cap rate
0.7%
Rent to Value Ratio
Active
$334,500
4
bds
|
0
ba
|
3,340
sqft
|
built
2005
19130 Yaupon Ranch Dr, Cypress, TX 77433
$-744
Cash flow
-11.6%
Cash-on-Cash Return
3.6%
Cap rate
0.7%
Rent to Value Ratio

Active
$735,000
5
bds
|
0
ba
|
4,221
sqft
|
built
2004
13830 Campwood Ln, Cypress, TX 77429
$-2,171
Cash flow
-15.4%
Cash-on-Cash Return
2.7%
Cap rate
0.7%
Rent to Value Ratio

Active
$359,500
4
bds
|
0
ba
|
2,477
sqft
|
built
2013
14911 Calico Heights Ln, Cypress, TX 77429
$-884
Cash flow
-12.8%
Cash-on-Cash Return
3.3%
Cap rate
0.7%
Rent to Value Ratio

Active
$399,900
4
bds
|
0
ba
|
2,866
sqft
|
built
2004
15127 Woodford Hollow Ln, Cypress, TX 77429
$-1,276
Cash flow
-16.6%
Cash-on-Cash Return
2.4%
Cap rate
0.6%
Rent to Value Ratio
Active
$379,000
4
bds
|
0
ba
|
2,652
sqft
|
built
1984
13106 Youngfield Dr, Cypress, TX 77429
$-884
Cash flow
-12.2%
Cash-on-Cash Return
3.5%
Cap rate
0.7%
Rent to Value Ratio

Active
$384,900
4
bds
|
0
ba
|
2,801
sqft
|
built
1982
12715 Chriswood Dr, Cypress, TX 77429
$-966
Cash flow
-13.1%
Cash-on-Cash Return
3.3%
Cap rate
0.6%
Rent to Value Ratio

Active
$325,000
5
bds
|
0
ba
|
2,266
sqft
|
built
2006
20507 Avery Grove Ct, Cypress, TX 77433
$-893
Cash flow
-14.3%
Cash-on-Cash Return
3.0%
Cap rate
0.7%
Rent to Value Ratio
Active
$669,000
5
bds
|
0
ba
|
4,142
sqft
|
built
2007
12207 Johns Enterprise Ct, Cypress, TX 77433
$-1,937
Cash flow
-15.1%
Cash-on-Cash Return
2.8%
Cap rate
0.7%
Rent to Value Ratio

Active
$420,000
4
bds
|
0
ba
|
2,659
sqft
|
built
2005
11018 Jadestone Creek Ln, Cypress, TX 77433
$-945
Cash flow
-11.7%
Cash-on-Cash Return
3.6%
Cap rate
0.7%
Rent to Value Ratio

Active
$535,000
4
bds
|
0
ba
|
3,627
sqft
|
built
2006
27010 Rockwood Park Ln, Cypress, TX 77433
$-1,701
Cash flow
-16.6%
Cash-on-Cash Return
2.4%
Cap rate
0.6%
Rent to Value Ratio

Active
$1,110,000
5
bds
|
0
ba
|
5,603
sqft
|
built
2011
13606 Oak Harbor Bnd, Cypress, TX 77429
$-4,653
Cash flow
-21.9%
Cash-on-Cash Return
1.2%
Cap rate
0.4%
Rent to Value Ratio

Active
$380,000
4
bds
|
0
ba
|
2,189
sqft
|
built
2002
15314 Yellow Oak Trl, Cypress, TX 77433
$-865
Cash flow
-11.9%
Cash-on-Cash Return
3.5%
Cap rate
0.7%
Rent to Value Ratio

Active
$439,500
4
bds
|
0
ba
|
2,620
sqft
|
built
1990
15434 Redbud Leaf Ln, Cypress, TX 77433
$-876
Cash flow
-10.4%
Cash-on-Cash Return
3.9%
Cap rate
0.7%
Rent to Value Ratio

Active
$374,900
4
bds
|
0
ba
|
3,158
sqft
|
built
2004
16618 Cypress Marsh Ct, Cypress, TX 77429
$-640
Cash flow
-8.9%
Cash-on-Cash Return
4.2%
Cap rate
0.8%
Rent to Value Ratio

Active
$535,000
4
bds
|
0
ba
|
3,405
sqft
|
built
1996
13207 Regency Oak Ln, Cypress, TX 77429
$-1,152
Cash flow
-11.2%
Cash-on-Cash Return
3.7%
Cap rate
0.7%
Rent to Value Ratio

Active
$1,599,000
5
bds
|
0
ba
|
4,267
sqft
|
built
2022
10615 Painted Crescent Ct, Cypress, TX 77433
$-3,228
Cash flow
-10.5%
Cash-on-Cash Return
3.8%
Cap rate
0.5%
Rent to Value Ratio

Active
$165,000
1
bds
|
0
ba
|
1,268
sqft
|
built
1984
12755 Mill Ridge Dr, Cypress, TX 77429
$-724
Cash flow
-22.9%
Cash-on-Cash Return
1.0%
Cap rate
0.8%
Rent to Value Ratio

Active
$379,900
4
bds
|
0
ba
|
2,929
sqft
|
built
2005
14030 Blackfoot Trail Run, Cypress, TX 77429
$-733
Cash flow
-10.1%
Cash-on-Cash Return
3.9%
Cap rate
0.8%
Rent to Value Ratio
Active
$420,000
4
bds
|
0
ba
|
2,982
sqft
|
built
2006
21739 W Mulberry Field Cir, Cypress, TX 77433
$-342
Cash flow
-4.2%
Cash-on-Cash Return
5.3%
Cap rate
0.7%
Rent to Value Ratio

Active
$1,950,000
8
bds
|
0
ba
|
8,188
sqft
|
built
2013
17018 Grant Rd, Cypress, TX 77429
$-12,340
Cash flow
-33.0%
Cash-on-Cash Return
-1.3%
Cap rate
0.3%
Rent to Value Ratio

Active
$295,000
3
bds
|
0
ba
|
2,200
sqft
|
built
2009
18502 Fair Grange Ln, Cypress, TX 77433
$-602
Cash flow
-10.6%
Cash-on-Cash Return
3.8%
Cap rate
0.7%
Rent to Value Ratio

Active
$475,000
4
bds
|
0
ba
|
3,146
sqft
|
built
1983
13102 Lake Mist Dr, Cypress, TX 77429
$-1,046
Cash flow
-11.5%
Cash-on-Cash Return
3.6%
Cap rate
0.7%
Rent to Value Ratio

Active
$487,500
5
bds
|
0
ba
|
3,482
sqft
|
built
2006
13907 Pawnee Trails Dr, Cypress, TX 77429
$-1,272
Cash flow
-13.6%
Cash-on-Cash Return
3.1%
Cap rate
0.7%
Rent to Value Ratio

Active
$340,000
4
bds
|
0
ba
|
2,405
sqft
|
built
1999
20314 Savannah Bay Rd, Cypress, TX 77433
$-587
Cash flow
-9.0%
Cash-on-Cash Return
4.2%
Cap rate
0.8%
Rent to Value Ratio

Active
$1,495,000
2
bds
|
0
ba
|
1,120
sqft
|
built
1973
18014 Mueschke Rd, Cypress, TX 77433
$-6,344
Cash flow
-22.1%
Cash-on-Cash Return
1.2%
Cap rate
0.2%
Rent to Value Ratio

Active
$305,000
3
bds
|
0
ba
|
2,090
sqft
|
built
1993
16323 Jast Dr, Cypress, TX 77429
$-691
Cash flow
-11.8%
Cash-on-Cash Return
3.5%
Cap rate
0.7%
Rent to Value Ratio
Active
$419,900
3
bds
|
0
ba
|
2,369
sqft
|
built
2012
19607 Mills Glen Dr, Cypress, TX 77433
$-1,301
Cash flow
-16.2%
Cash-on-Cash Return
2.5%
Cap rate
0.7%
Rent to Value Ratio