Denver, CO Investment Properties for Sale
Browse homes for sale and investment properties in Denver, CO. Refine your search by price, property type, or more.
Best cash flowing properties in Denver, CO
Active
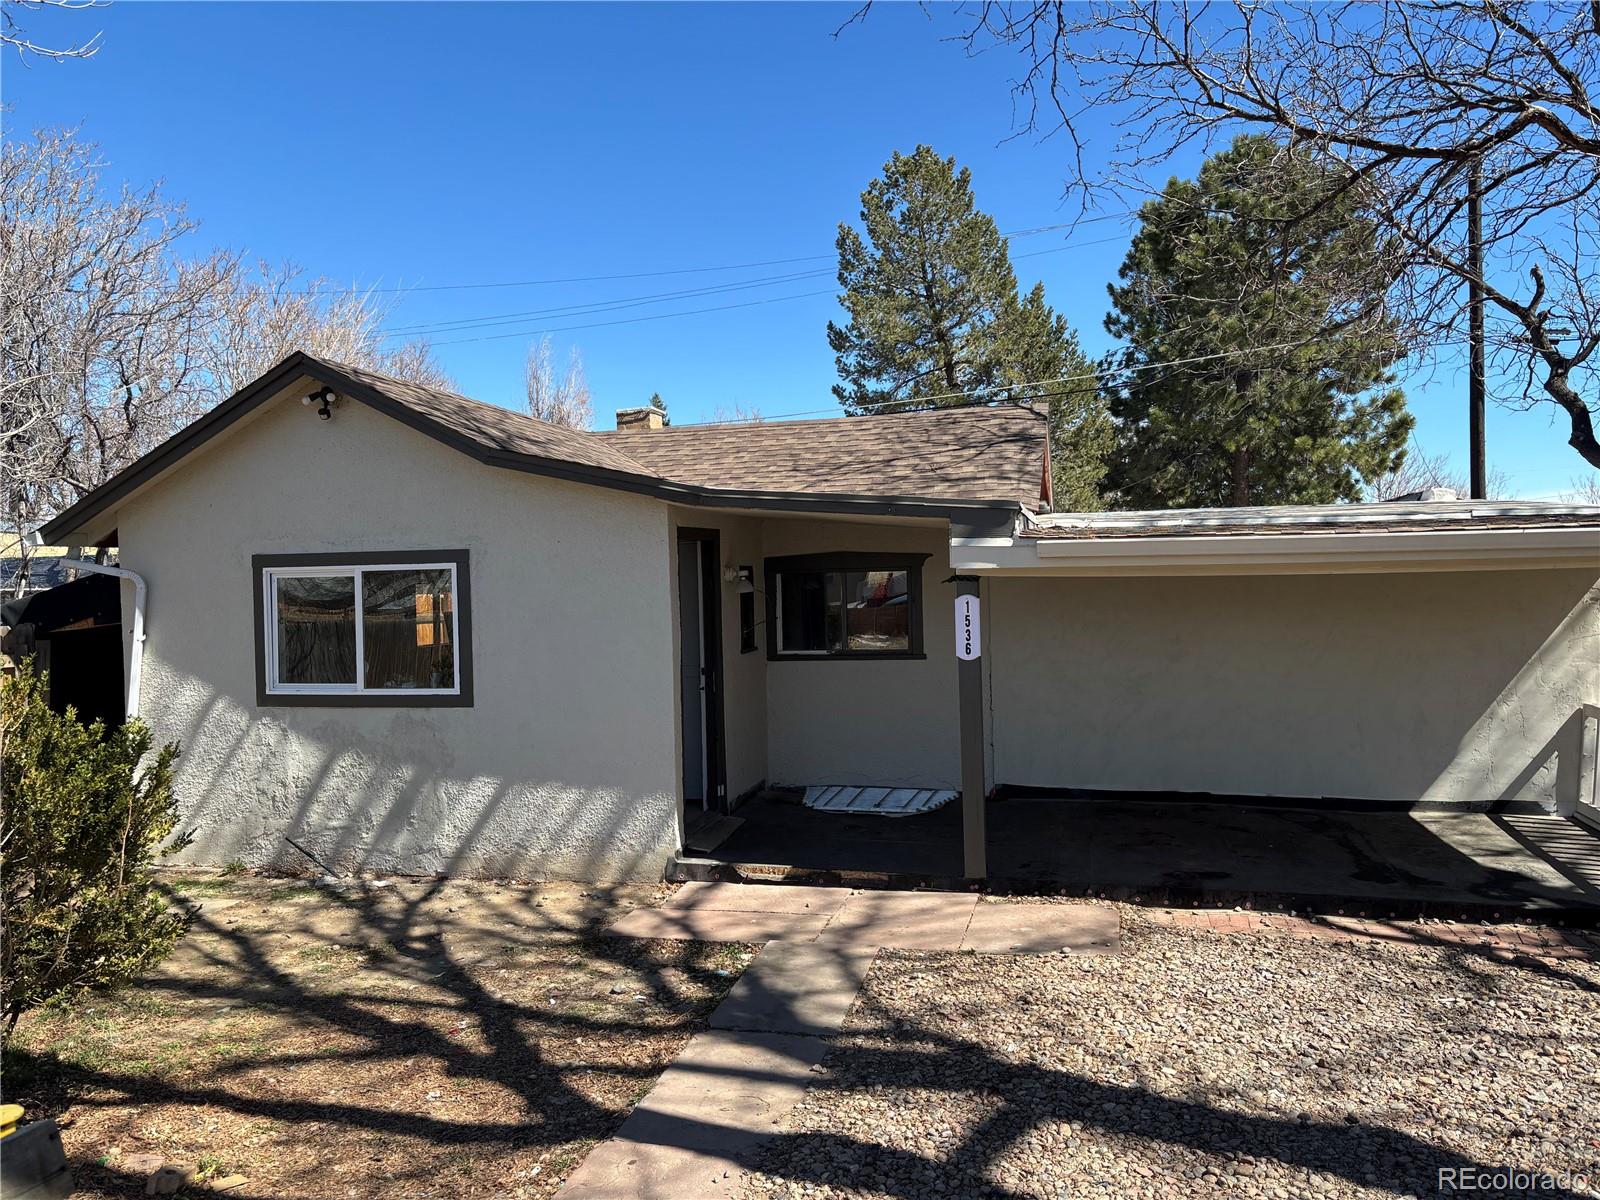
$270,000
3
bds
|
1
ba
|
683
sqft
|
built
1923
1536 Trenton St, Denver, CO 80220
$70
Cash flow
1.4%
Cash-on-Cash Return
6.0%
Cap rate
0.8%
Rent to Value Ratio
Active under contract
$135,000
1
bds
|
1
ba
|
620
sqft
|
built
1961
1180 Yosemite St, Denver, CO 80220
$-62
Cash flow
-2.4%
Cash-on-Cash Return
5.1%
Cap rate
1.0%
Rent to Value Ratio
3,303 out of 3,421 properties for sale in Denver, CO
Limited Results Shown
Create a free account, or log in to reveal all property listings and enjoy the complete experience.
Active
$270,000
3
bds
|
1
ba
|
683
sqft
|
built
1923
1536 Trenton St, Denver, CO 80220
$70
Cash flow
1.4%
Cash-on-Cash Return
6.0%
Cap rate
0.8%
Rent to Value Ratio
Active under contract
$135,000
1
bds
|
1
ba
|
620
sqft
|
built
1961
1180 Yosemite St, Denver, CO 80220
$-62
Cash flow
-2.4%
Cash-on-Cash Return
5.1%
Cap rate
1.0%
Rent to Value Ratio
Active
$377,800
3
bds
|
1
ba
|
1,125
sqft
|
built
1935
3228 W Virginia Ave, Denver, CO 80219
$-197
Cash flow
-2.7%
Cash-on-Cash Return
5.1%
Cap rate
0.7%
Rent to Value Ratio

Active
$219,000
2
bds
|
1
ba
|
967
sqft
|
built
1972
7755 E Quincy Ave, Denver, CO 80237
$-331
Cash flow
-7.9%
Cash-on-Cash Return
3.9%
Cap rate
0.8%
Rent to Value Ratio
Active
$299,000
1
bds
|
1
ba
|
632
sqft
|
built
1938
444 17th St, Denver, CO 80202
$-581
Cash flow
-10.1%
Cash-on-Cash Return
3.3%
Cap rate
0.6%
Rent to Value Ratio
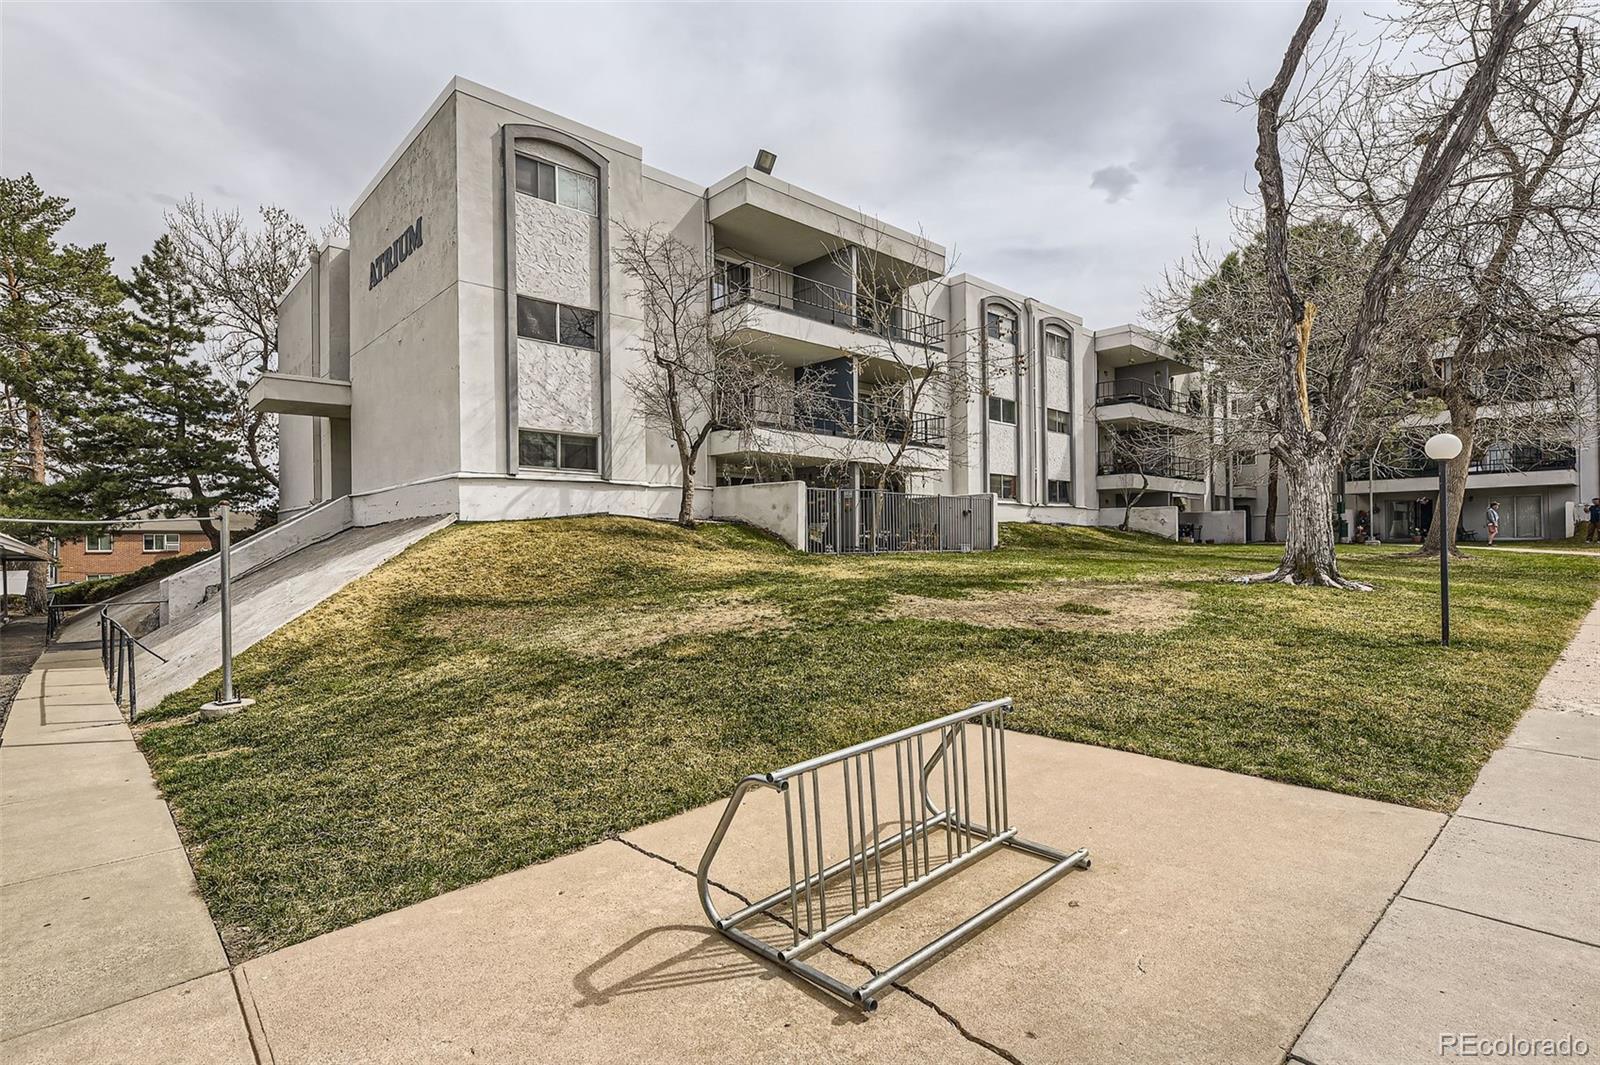
Active
$185,000
1
bds
|
1
ba
|
703
sqft
|
built
1970
2325 S Linden Ct, Denver, CO 80222
$-322
Cash flow
-9.1%
Cash-on-Cash Return
3.6%
Cap rate
0.9%
Rent to Value Ratio
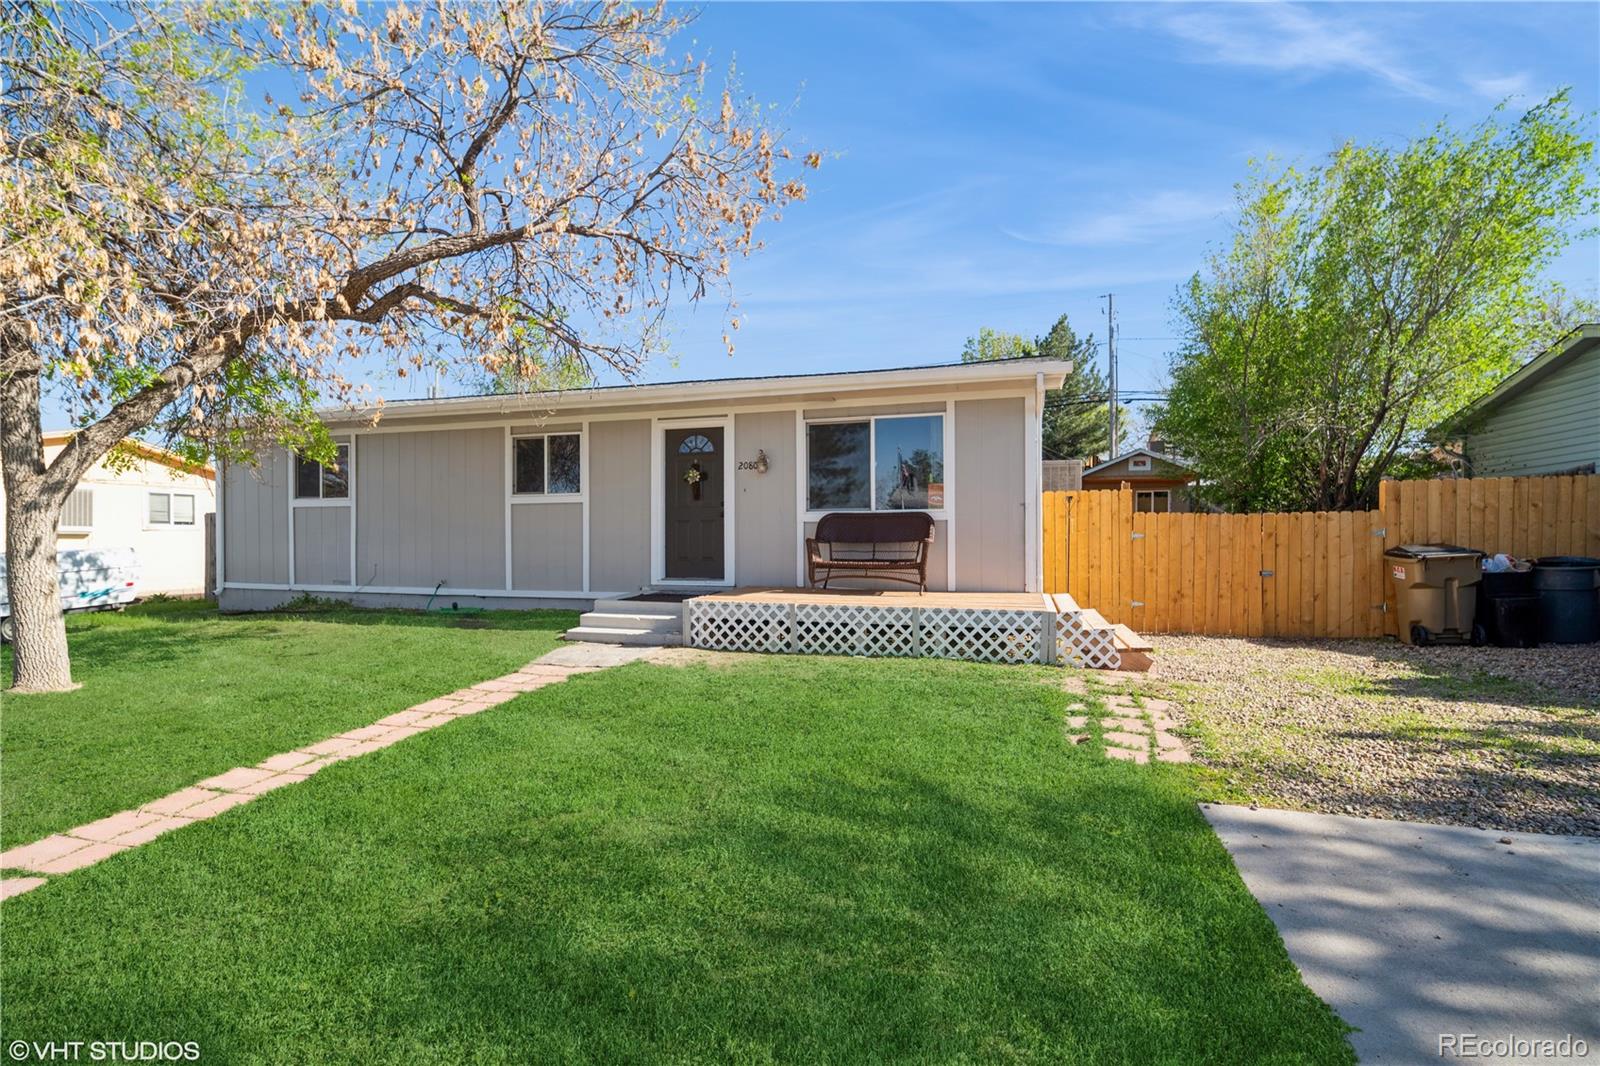
Active
$415,000
3
bds
|
1
ba
|
1,075
sqft
|
built
1971
2080 E 84th Ave, Denver, CO 80229
$-445
Cash flow
-5.6%
Cash-on-Cash Return
4.4%
Cap rate
0.6%
Rent to Value Ratio
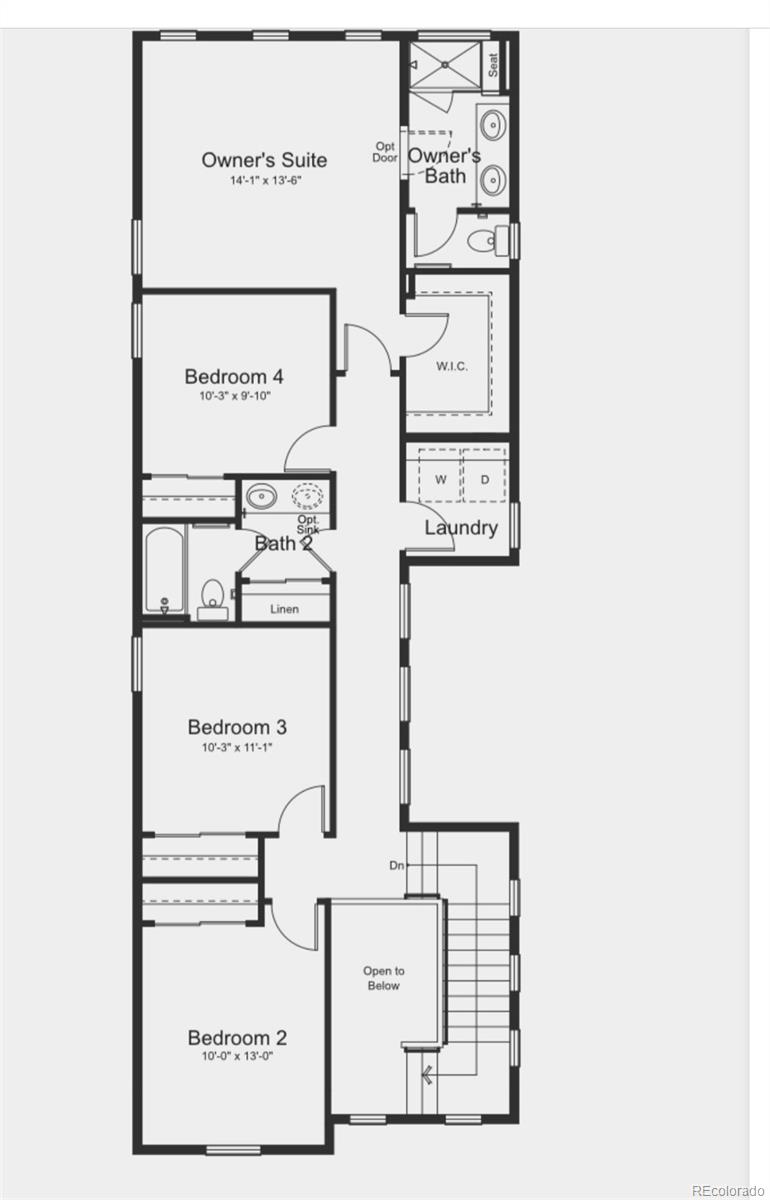
Active
$484,000
4
bds
|
3
ba
|
2,027
sqft
|
built
2021
19085 E 66th Ave, Denver, CO 80249
$-618
Cash flow
-6.7%
Cash-on-Cash Return
4.1%
Cap rate
0.6%
Rent to Value Ratio
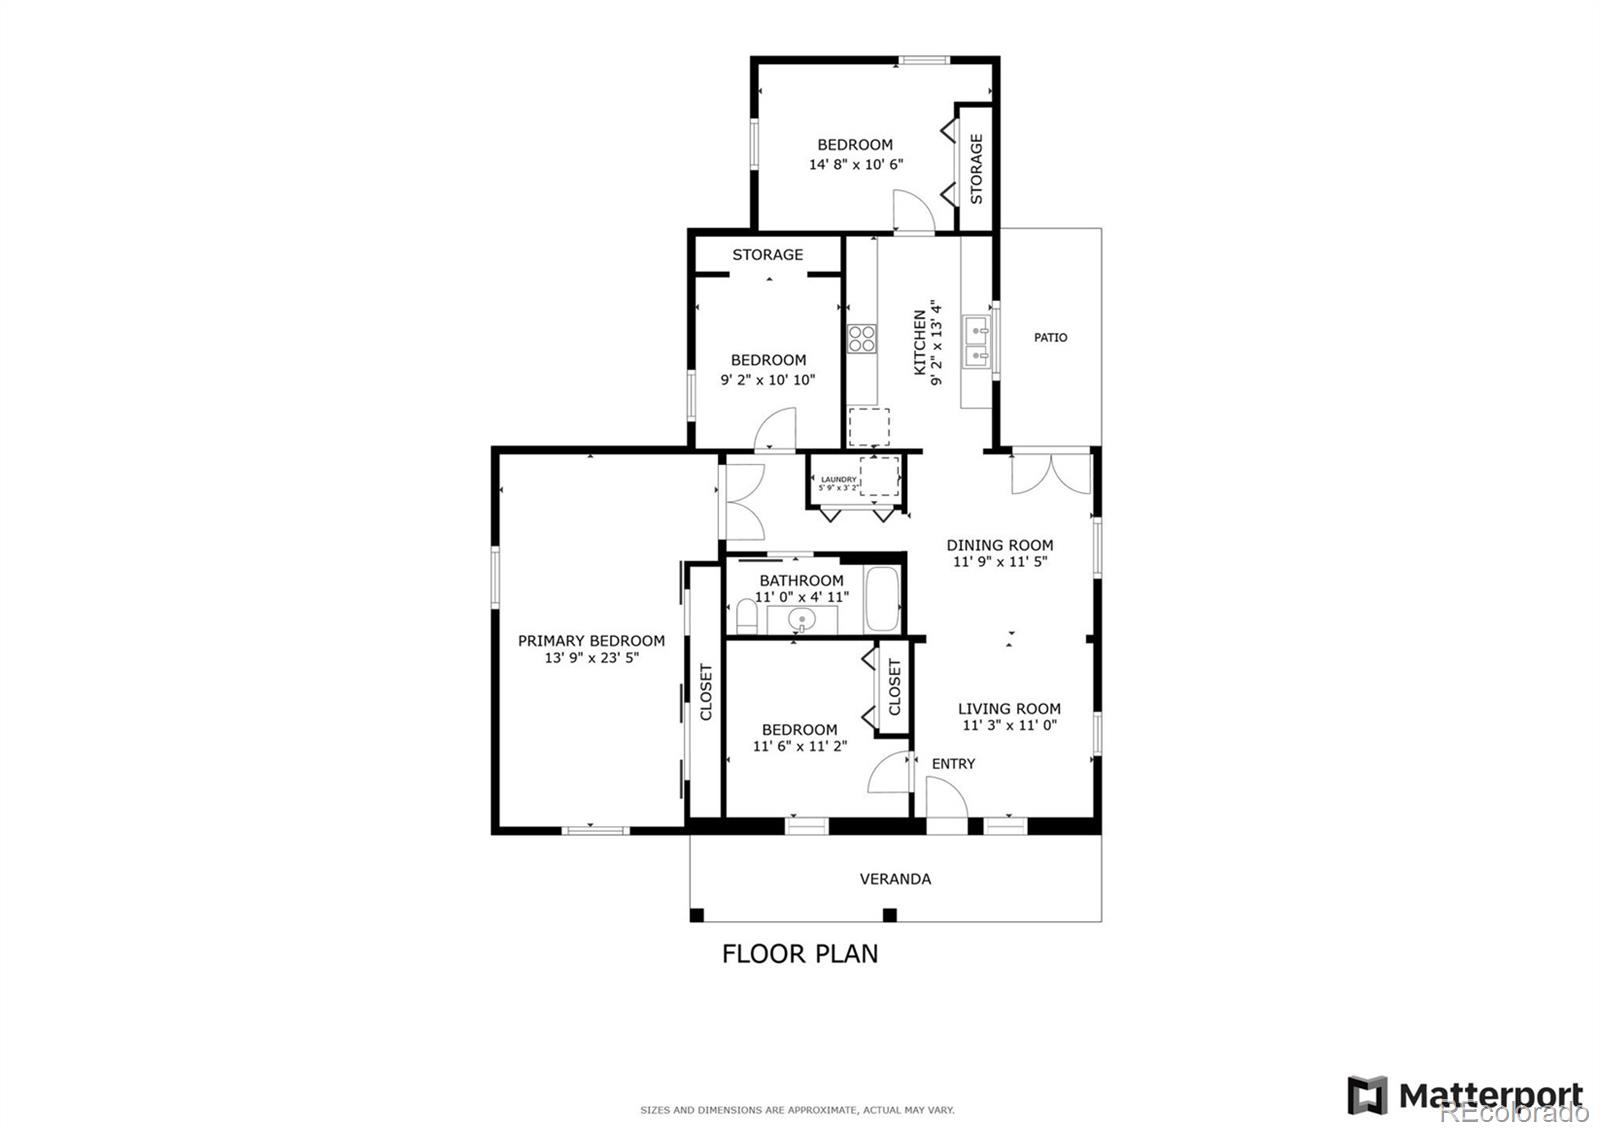
Active
$445,000
4
bds
|
1
ba
|
1,330
sqft
|
built
1924
1253 Uinta St, Denver, CO 80220
$-171
Cash flow
-2.0%
Cash-on-Cash Return
5.2%
Cap rate
0.7%
Rent to Value Ratio
Pending
$200,000
1
bds
|
1
ba
|
553
sqft
|
built
1949
1160 Birch St, Denver, CO 80220
$-211
Cash flow
-5.5%
Cash-on-Cash Return
4.4%
Cap rate
0.9%
Rent to Value Ratio
Active
$225,000
1
bds
|
1
ba
|
810
sqft
|
built
1966
955 Eudora St, Denver, CO 80220
$-515
Cash flow
-11.9%
Cash-on-Cash Return
2.9%
Cap rate
0.8%
Rent to Value Ratio
Active
$413,500
2
bds
|
1
ba
|
1,047
sqft
|
built
1942
1315 Xanthia St, Denver, CO 80220
$-531
Cash flow
-6.7%
Cash-on-Cash Return
4.1%
Cap rate
0.6%
Rent to Value Ratio
Active under contract
$235,000
2
bds
|
1
ba
|
831
sqft
|
built
1972
3663 S Sheridan Blvd, Denver, CO 80235
$-265
Cash flow
-5.9%
Cash-on-Cash Return
4.3%
Cap rate
0.8%
Rent to Value Ratio
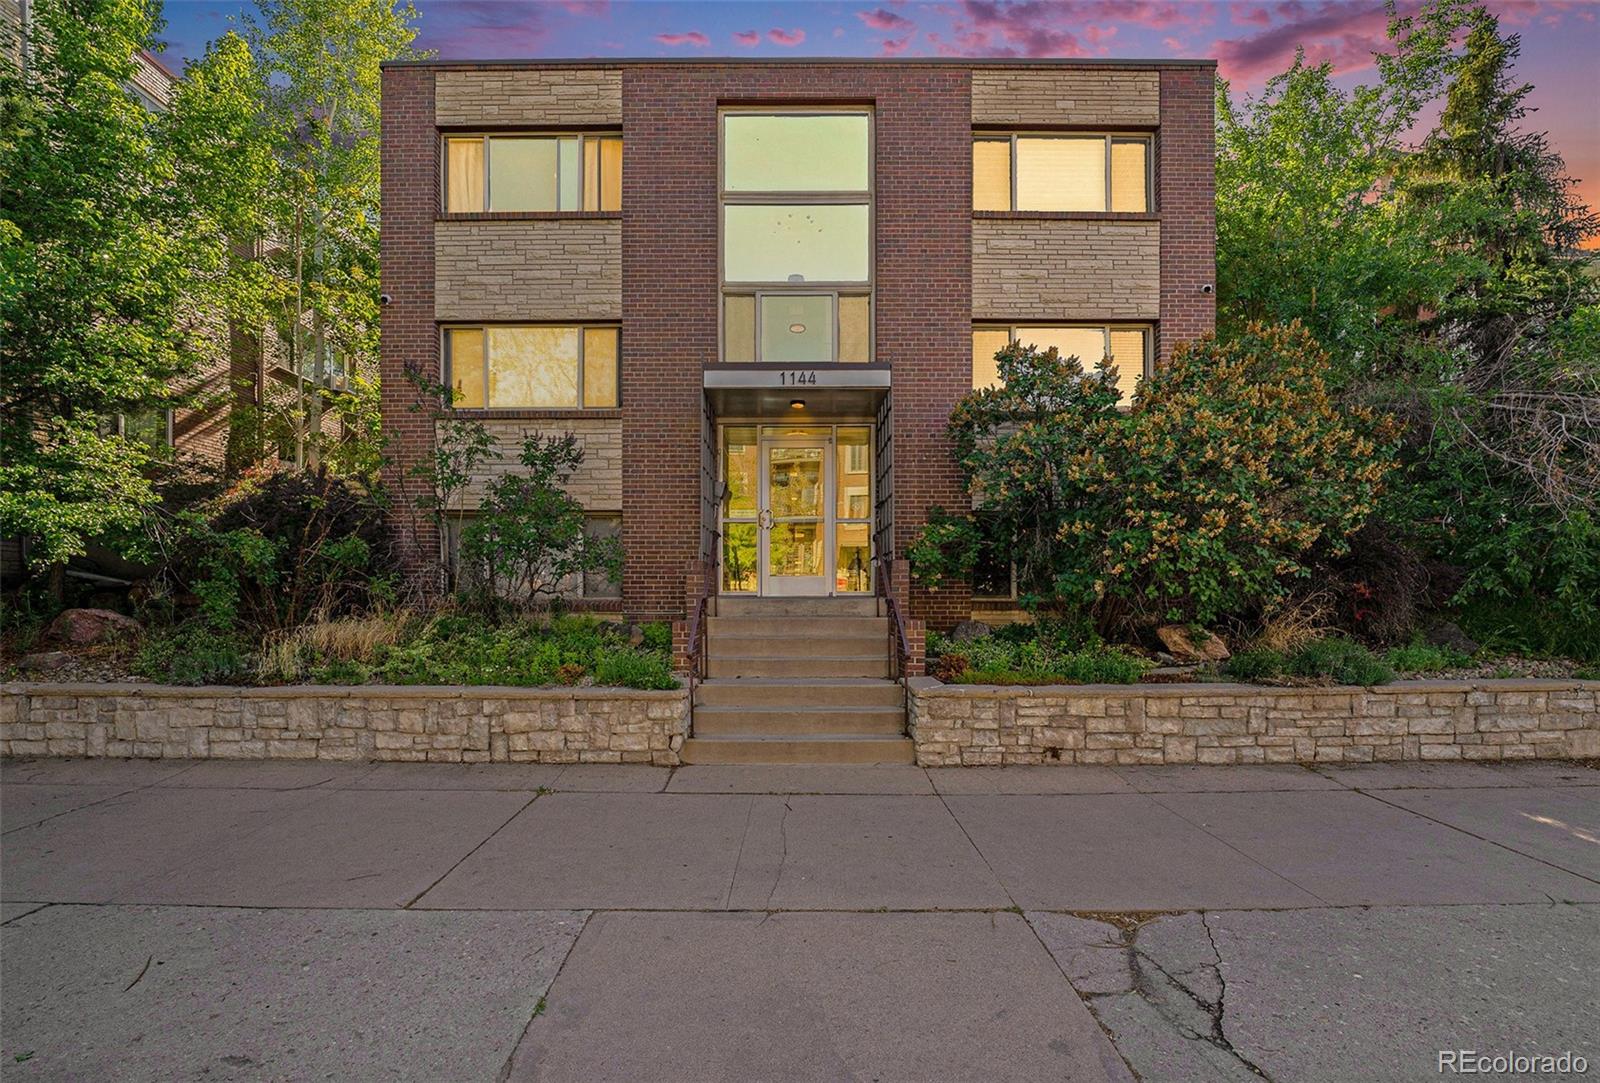
Active under contract
$199,999
1
bds
|
1
ba
|
584
sqft
|
built
1960
1144 N Ogden St, Denver, CO 80218
$-76
Cash flow
-2.0%
Cash-on-Cash Return
5.2%
Cap rate
0.9%
Rent to Value Ratio
Active
$300,000
1
bds
|
1
ba
|
498
sqft
|
built
1906
710 E Alameda Ave, Denver, CO 80209
$-306
Cash flow
-5.3%
Cash-on-Cash Return
4.5%
Cap rate
0.6%
Rent to Value Ratio
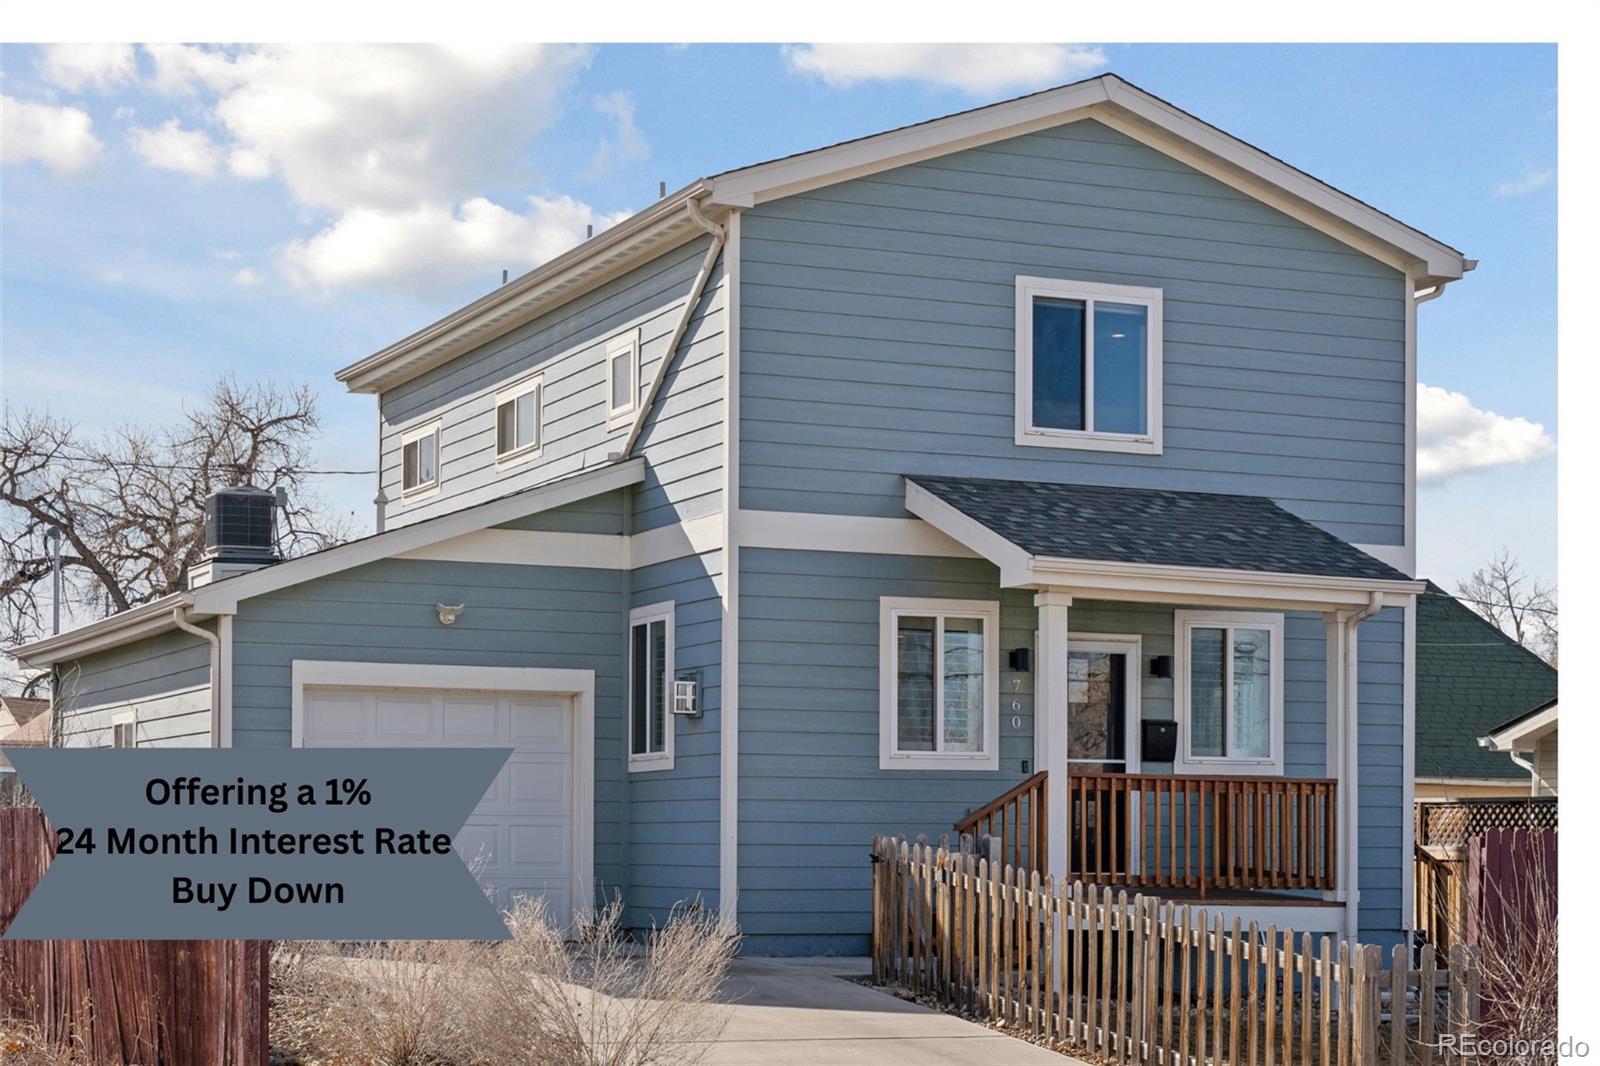
Active
$599,000
3
bds
|
2
ba
|
1,344
sqft
|
built
2017
760 W Asbury Ave, Denver, CO 80223
$-699
Cash flow
-6.1%
Cash-on-Cash Return
4.3%
Cap rate
0.6%
Rent to Value Ratio
Active
$549,900
3
bds
|
3
ba
|
1,556
sqft
|
built
2018
9072 E 47th Ave, Denver, CO 80238
$-1,287
Cash flow
-12.2%
Cash-on-Cash Return
2.9%
Cap rate
0.5%
Rent to Value Ratio
Active
$1,690,000
6
bds
|
5
ba
|
4,625
sqft
|
built
2007
8056 E 24th Ave, Denver, CO 80238
$-4,078
Cash flow
-12.6%
Cash-on-Cash Return
2.8%
Cap rate
0.4%
Rent to Value Ratio
Active
$3,850,000
5
bds
|
7
ba
|
8,247
sqft
|
built
2022
267 S Clermont St, Denver, CO 80246
$-12,683
Cash flow
-17.2%
Cash-on-Cash Return
1.7%
Cap rate
0.3%
Rent to Value Ratio
Active
$585,000
3
bds
|
2
ba
|
1,349
sqft
|
built
1901
800 S Krameria St, Denver, CO 80224
$-886
Cash flow
-7.9%
Cash-on-Cash Return
3.9%
Cap rate
0.5%
Rent to Value Ratio
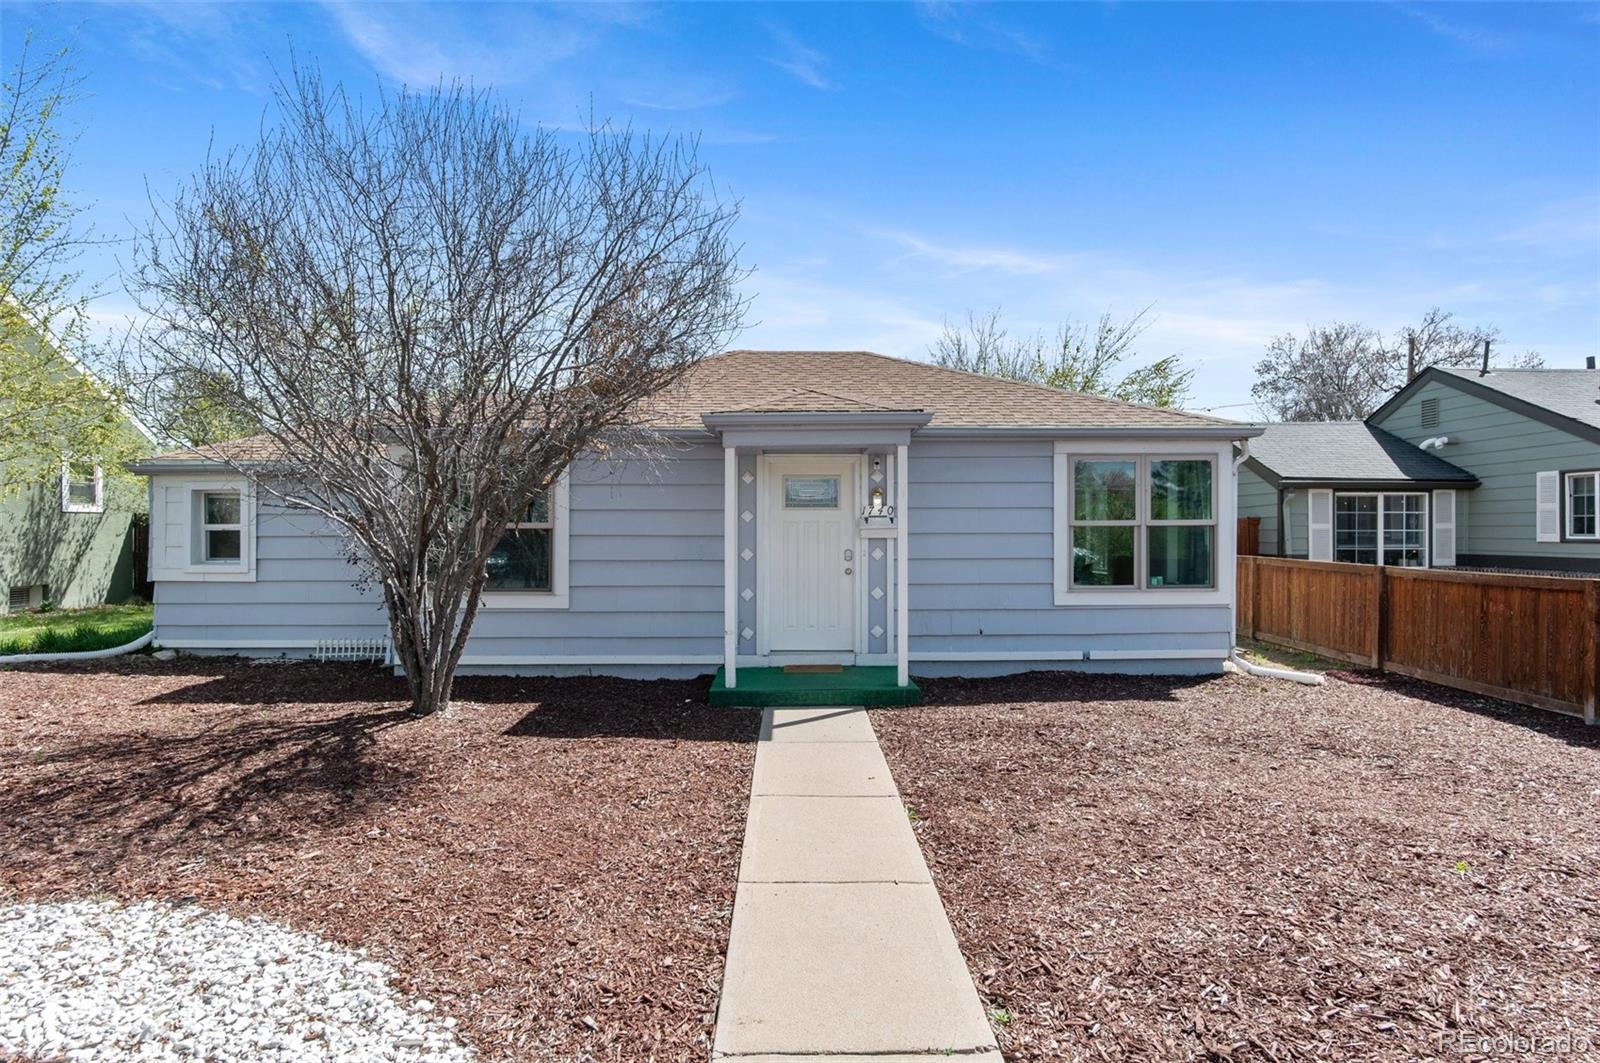
Active
$475,000
3
bds
|
2
ba
|
904
sqft
|
built
1942
1740 Trenton St, Denver, CO 80220
$-891
Cash flow
-9.8%
Cash-on-Cash Return
3.4%
Cap rate
0.5%
Rent to Value Ratio
Active
$369,000
2
bds
|
2
ba
|
1,124
sqft
|
built
1984
9400 E Iliff Ave, Denver, CO 80231
$-917
Cash flow
-13.0%
Cash-on-Cash Return
2.7%
Cap rate
0.6%
Rent to Value Ratio
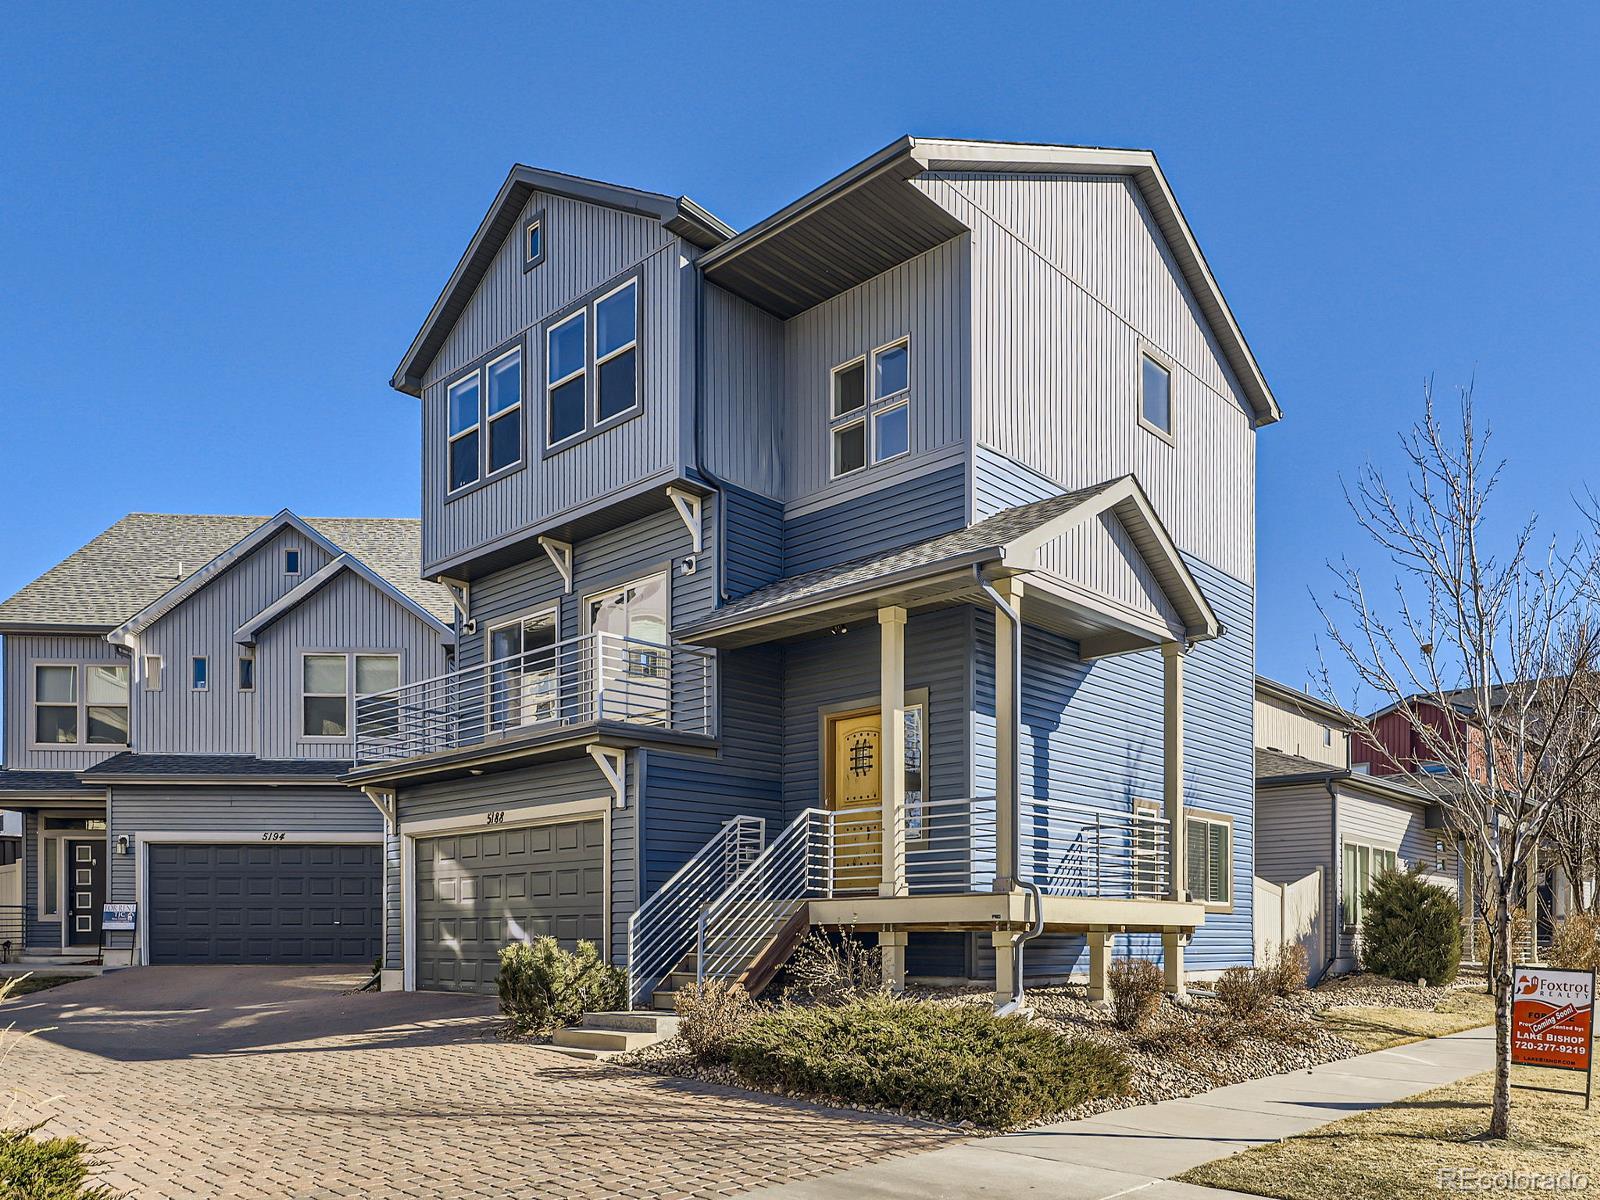
Active
$520,000
3
bds
|
3
ba
|
2,300
sqft
|
built
2014
5188 Andes Way, Denver, CO 80249
$-783
Cash flow
-7.9%
Cash-on-Cash Return
3.9%
Cap rate
0.6%
Rent to Value Ratio
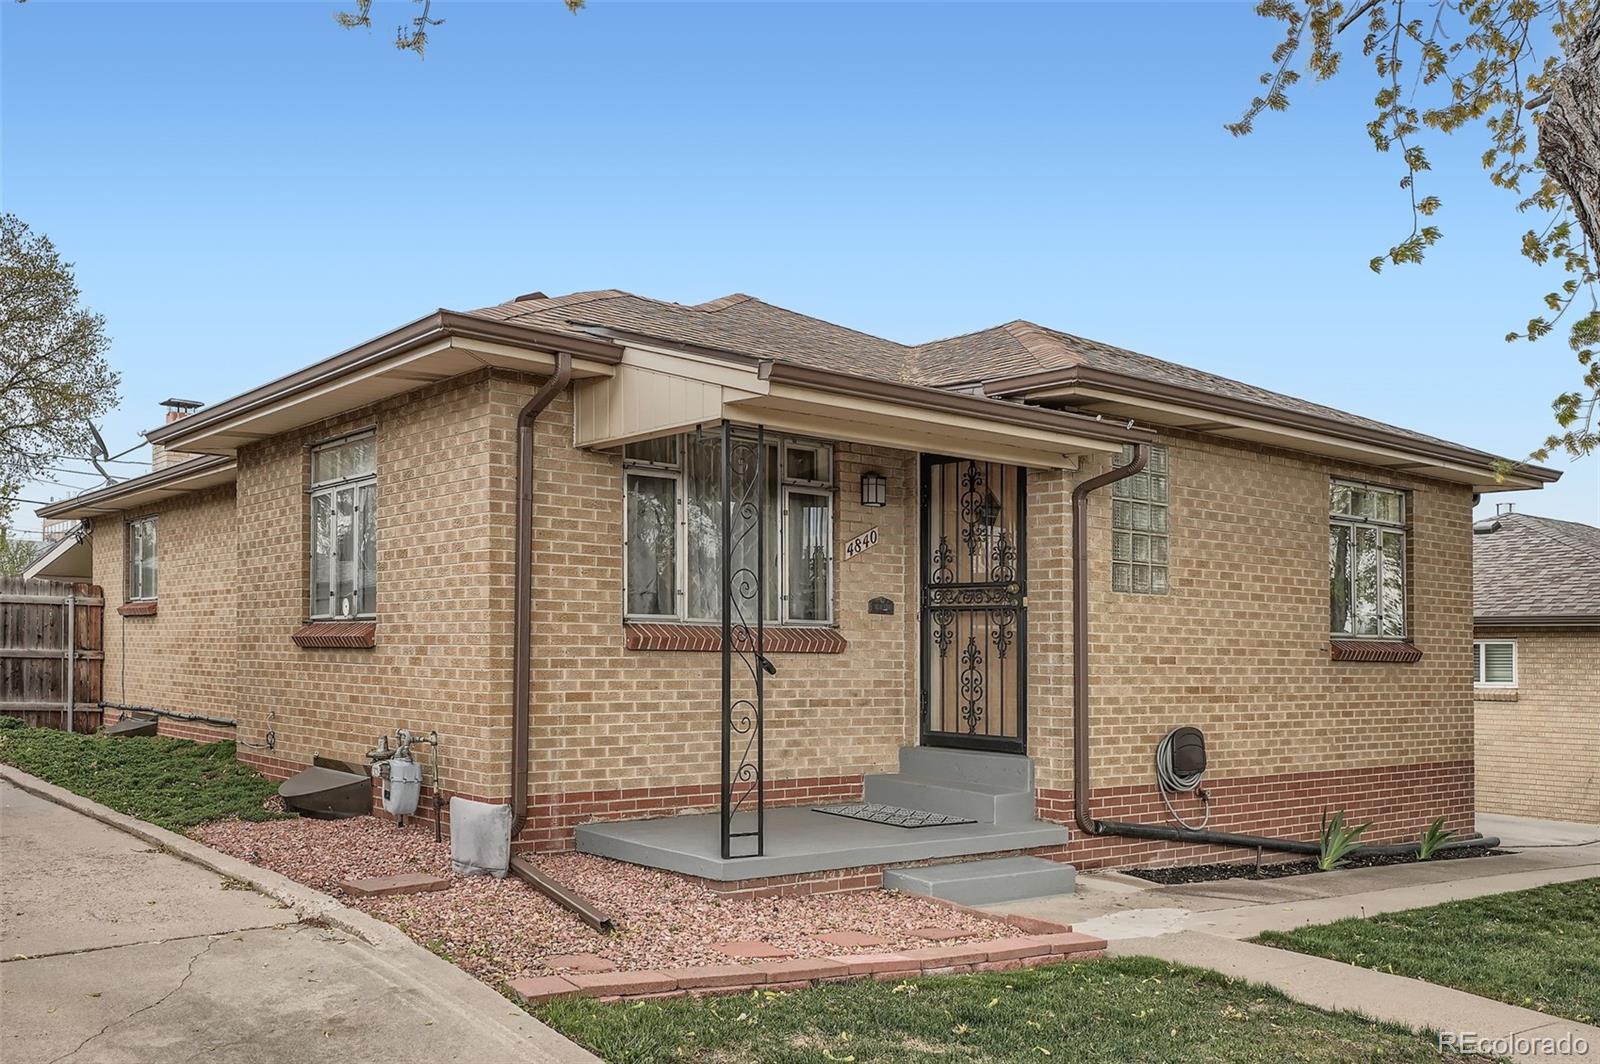
Active
$655,000
4
bds
|
2
ba
|
1,733
sqft
|
built
1955
4840 Depew St, Denver, CO 80212
$-1,245
Cash flow
-9.9%
Cash-on-Cash Return
3.4%
Cap rate
0.5%
Rent to Value Ratio
Active
$664,900
3
bds
|
3
ba
|
1,799
sqft
|
built
1984
7500 E Dartmouth Ave, Denver, CO 80231
$-1,604
Cash flow
-12.6%
Cash-on-Cash Return
2.8%
Cap rate
0.5%
Rent to Value Ratio
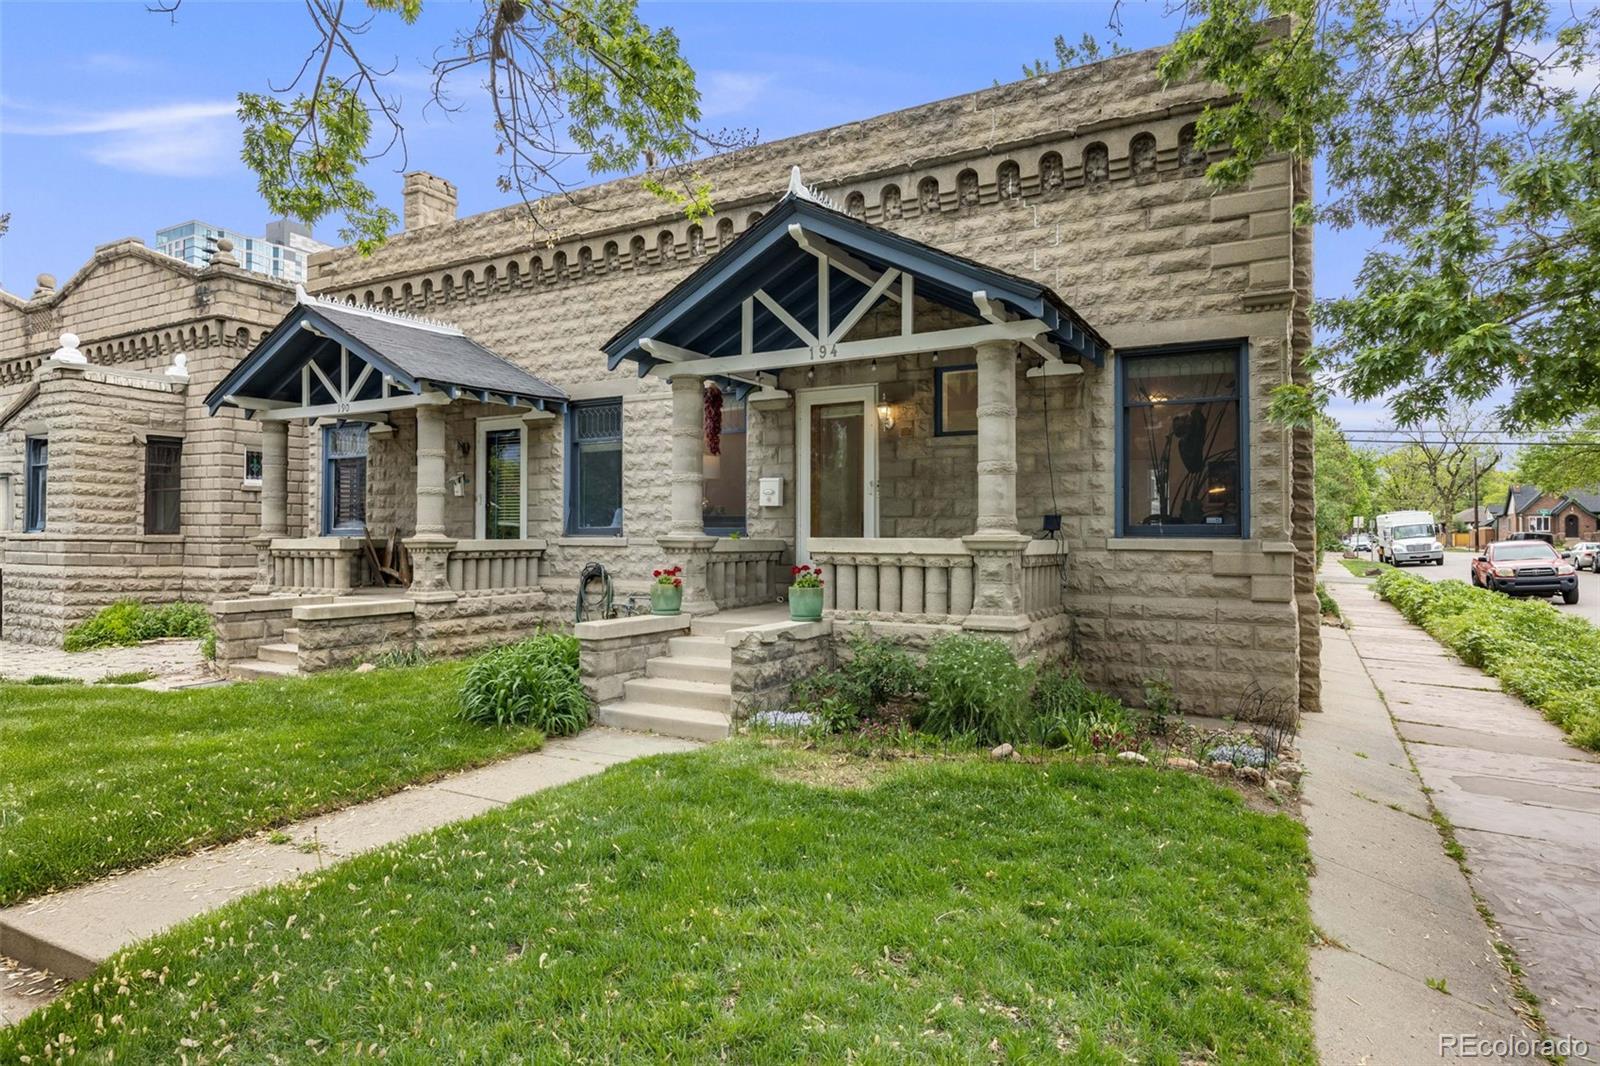
Active under contract
$650,000
3
bds
|
2
ba
|
1,301
sqft
|
built
1905
194 S Emerson St, Denver, CO 80209
$-1,345
Cash flow
-10.8%
Cash-on-Cash Return
3.2%
Cap rate
0.4%
Rent to Value Ratio
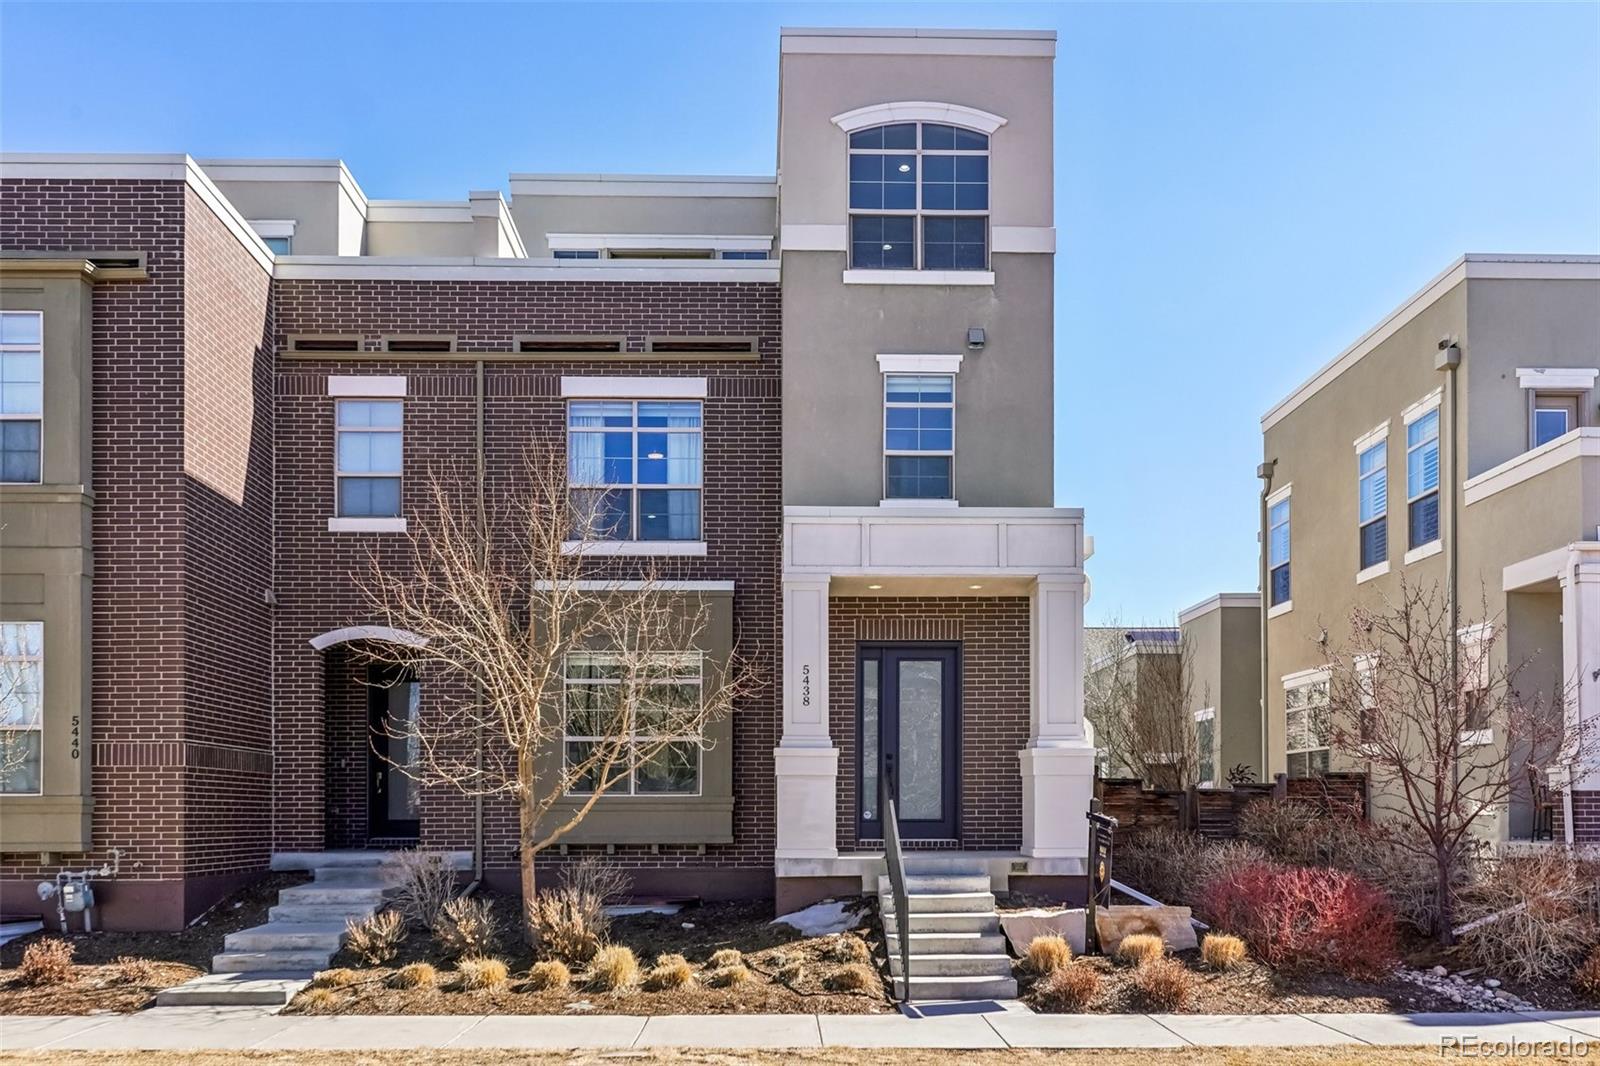
Active
$830,000
3
bds
|
4
ba
|
3,020
sqft
|
built
2015
5438 Valentia St, Denver, CO 80238
$-1,804
Cash flow
-11.3%
Cash-on-Cash Return
3.1%
Cap rate
0.5%
Rent to Value Ratio
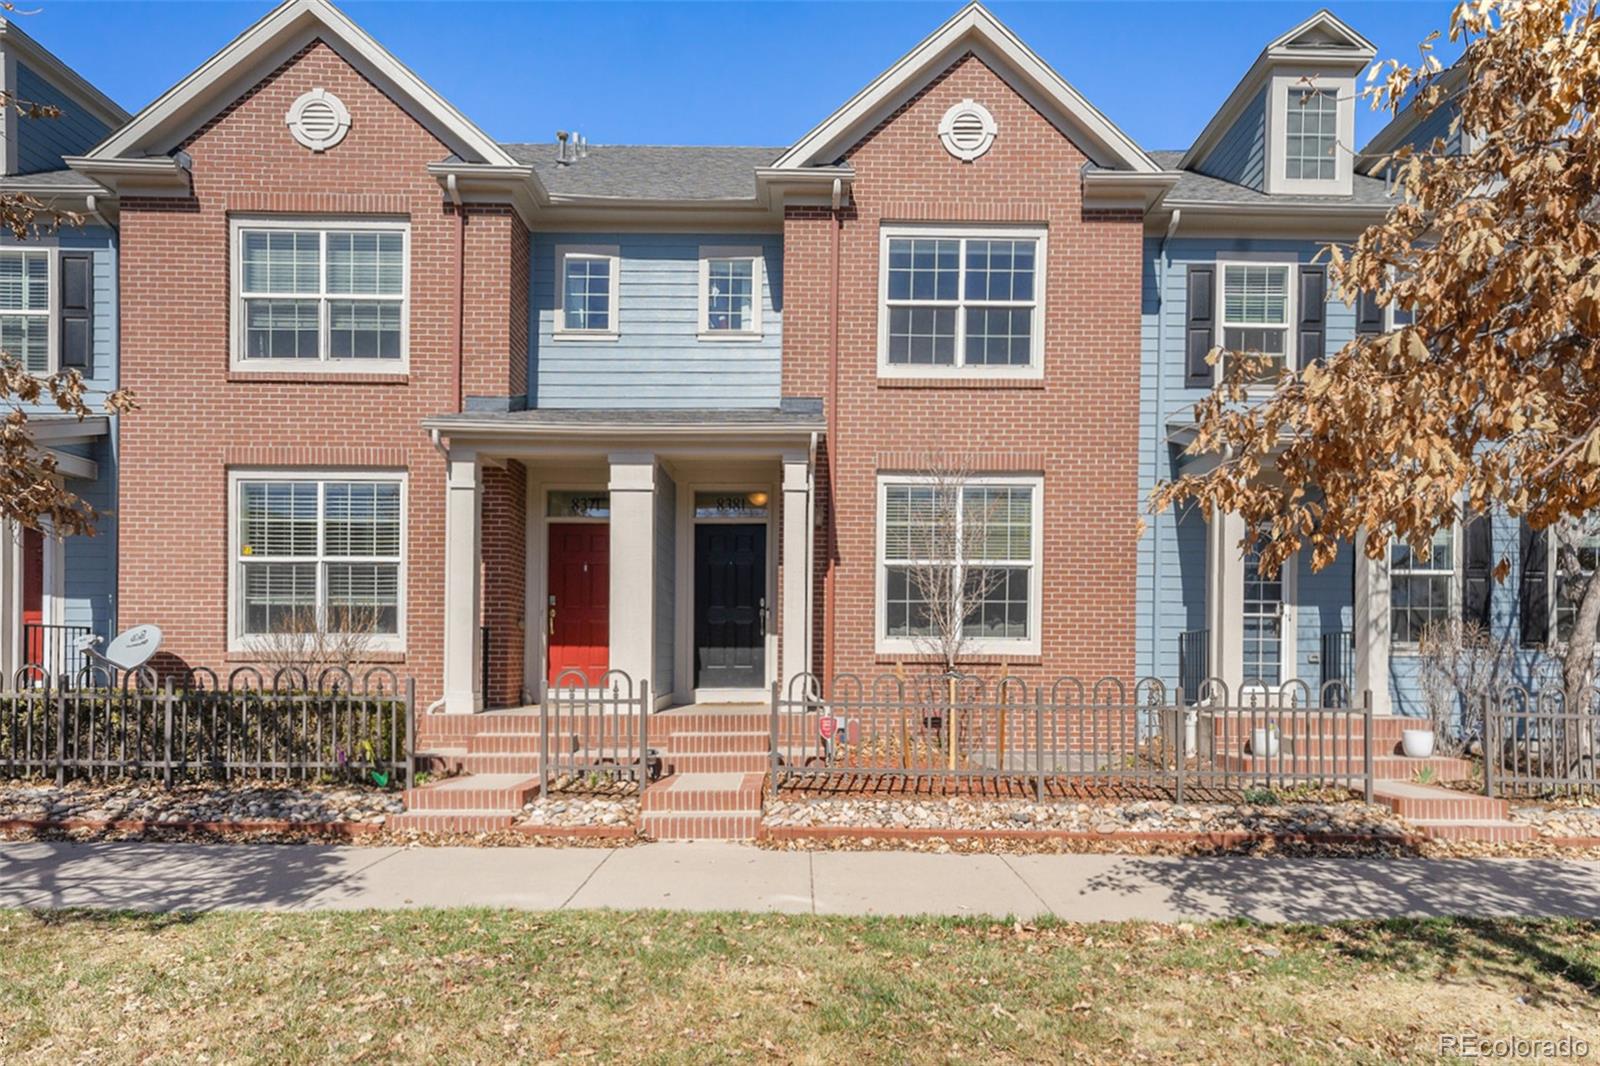
Active
$635,000
3
bds
|
3
ba
|
1,892
sqft
|
built
2004
8381 E 29th Ave, Denver, CO 80238
$-1,809
Cash flow
-14.9%
Cash-on-Cash Return
2.3%
Cap rate
0.5%
Rent to Value Ratio
Active
$890,000
4
bds
|
4
ba
|
4,107
sqft
|
built
1992
8101 E Dartmouth Ave, Denver, CO 80231
$-2,005
Cash flow
-11.8%
Cash-on-Cash Return
3.0%
Cap rate
0.4%
Rent to Value Ratio
Active
$835,000
3
bds
|
3
ba
|
3,272
sqft
|
built
1999
6700 W Dorado Dr, Denver, CO 80123
$-2,015
Cash flow
-12.6%
Cash-on-Cash Return
2.8%
Cap rate
0.5%
Rent to Value Ratio
Active
$315,000
2
bds
|
1
ba
|
727
sqft
|
built
1965
1 N Pearl St, Denver, CO 80203
$-700
Cash flow
-11.6%
Cash-on-Cash Return
3.0%
Cap rate
0.6%
Rent to Value Ratio
Active
$559,900
3
bds
|
0
ba
|
1,164
sqft
|
built
1955
103 S Zenobia St, Denver, CO 80219
$-1,008
Cash flow
-9.4%
Cash-on-Cash Return
3.5%
Cap rate
0.5%
Rent to Value Ratio
Active
$289,000
2
bds
|
2
ba
|
1,283
sqft
|
built
1968
3855 S Monaco Pkwy, Denver, CO 80237
$-625
Cash flow
-11.3%
Cash-on-Cash Return
3.1%
Cap rate
0.7%
Rent to Value Ratio
Active
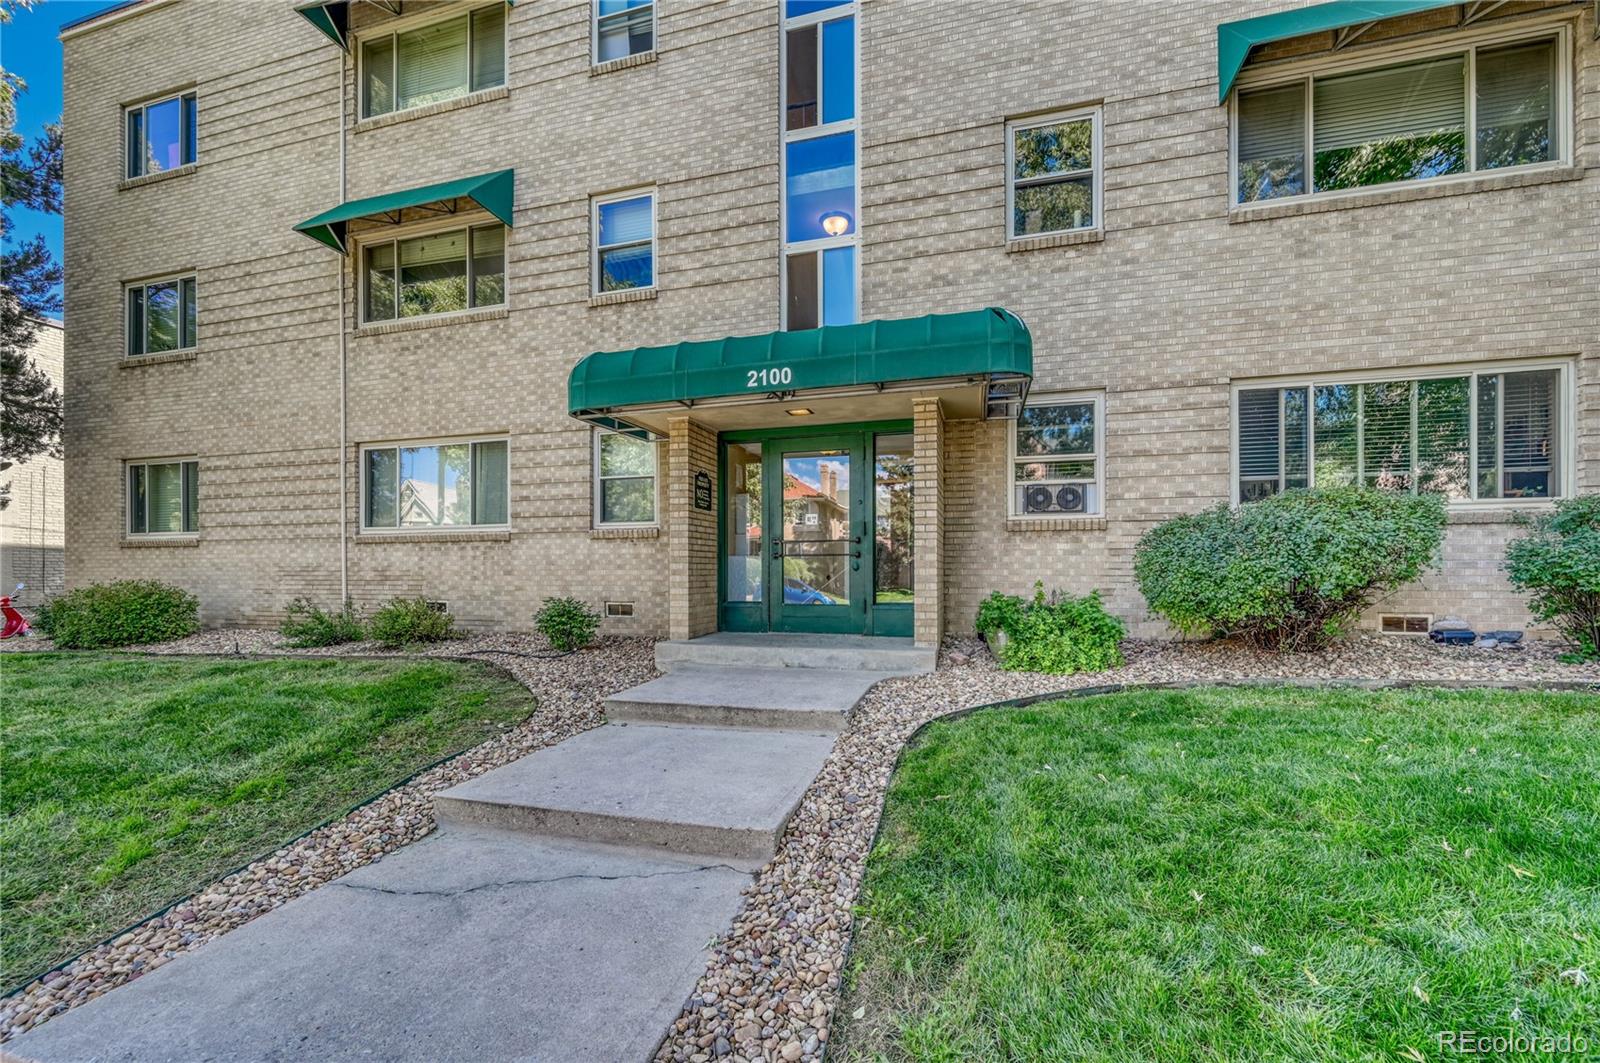
$275,000
2
bds
|
1
ba
|
750
sqft
|
built
1951
2100 N Franklin St, Denver, CO 80205
$-651
Cash flow
-12.4%
Cash-on-Cash Return
2.8%
Cap rate
0.7%
Rent to Value Ratio
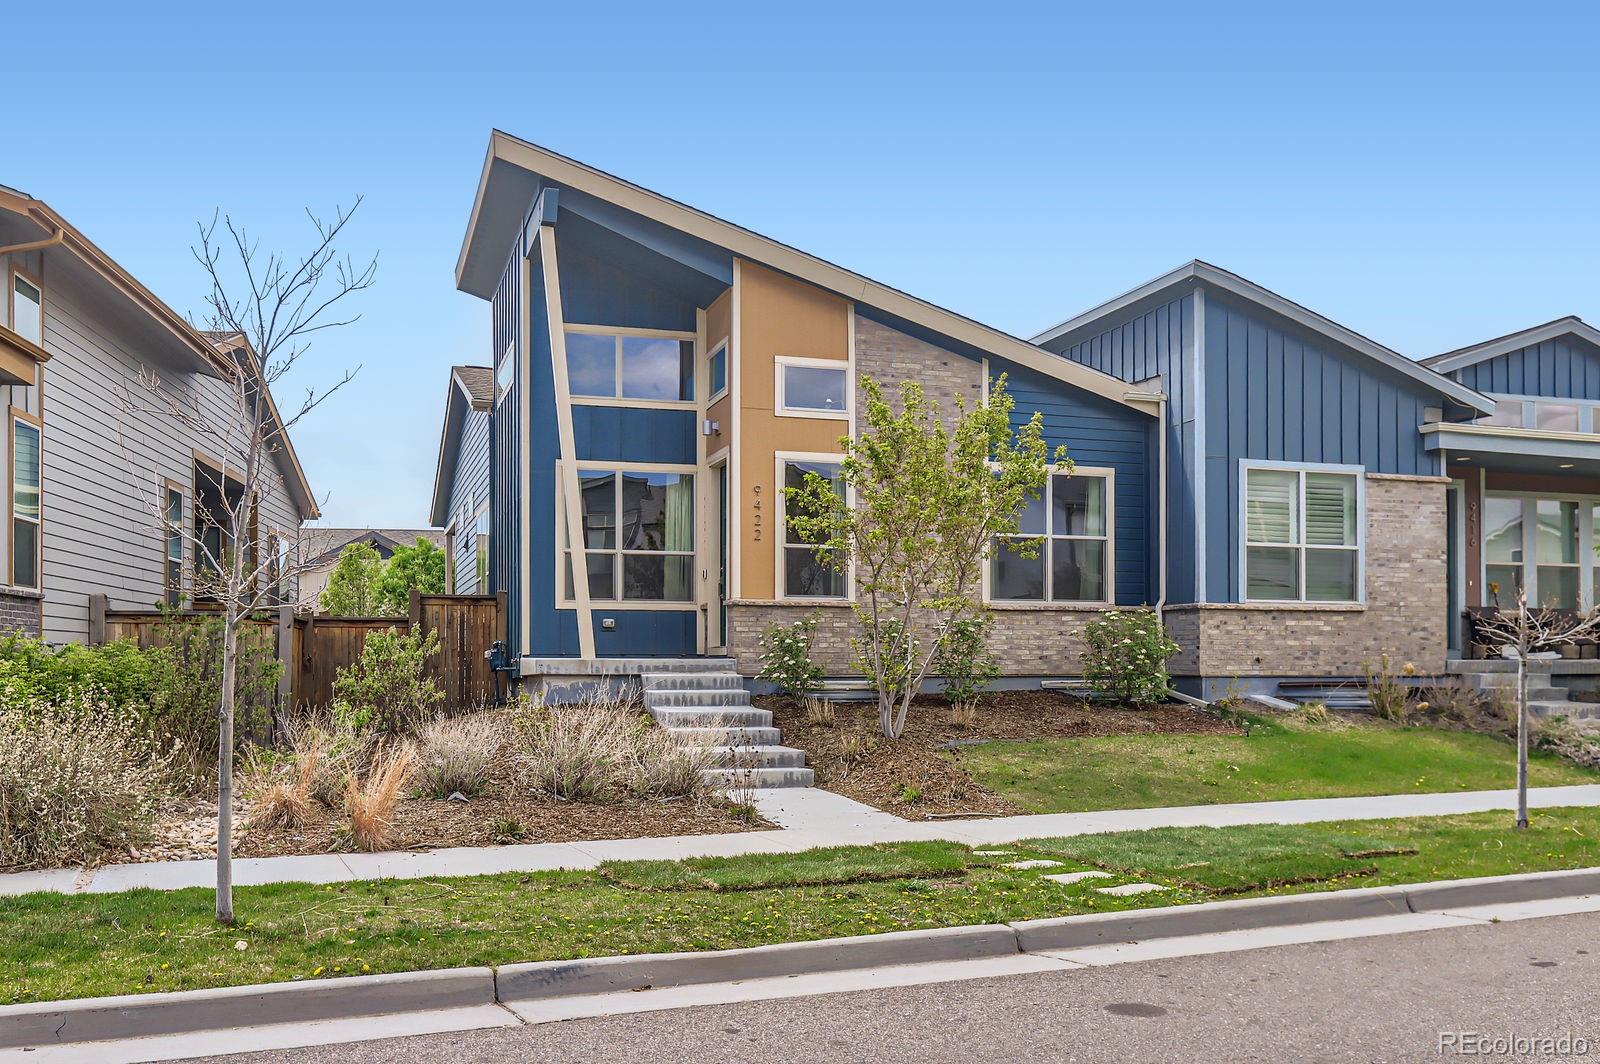
Active
$770,000
4
bds
|
3
ba
|
2,488
sqft
|
built
2018
9422 E 58th Pl, Denver, CO 80238
$-1,801
Cash flow
-12.2%
Cash-on-Cash Return
2.9%
Cap rate
0.5%
Rent to Value Ratio
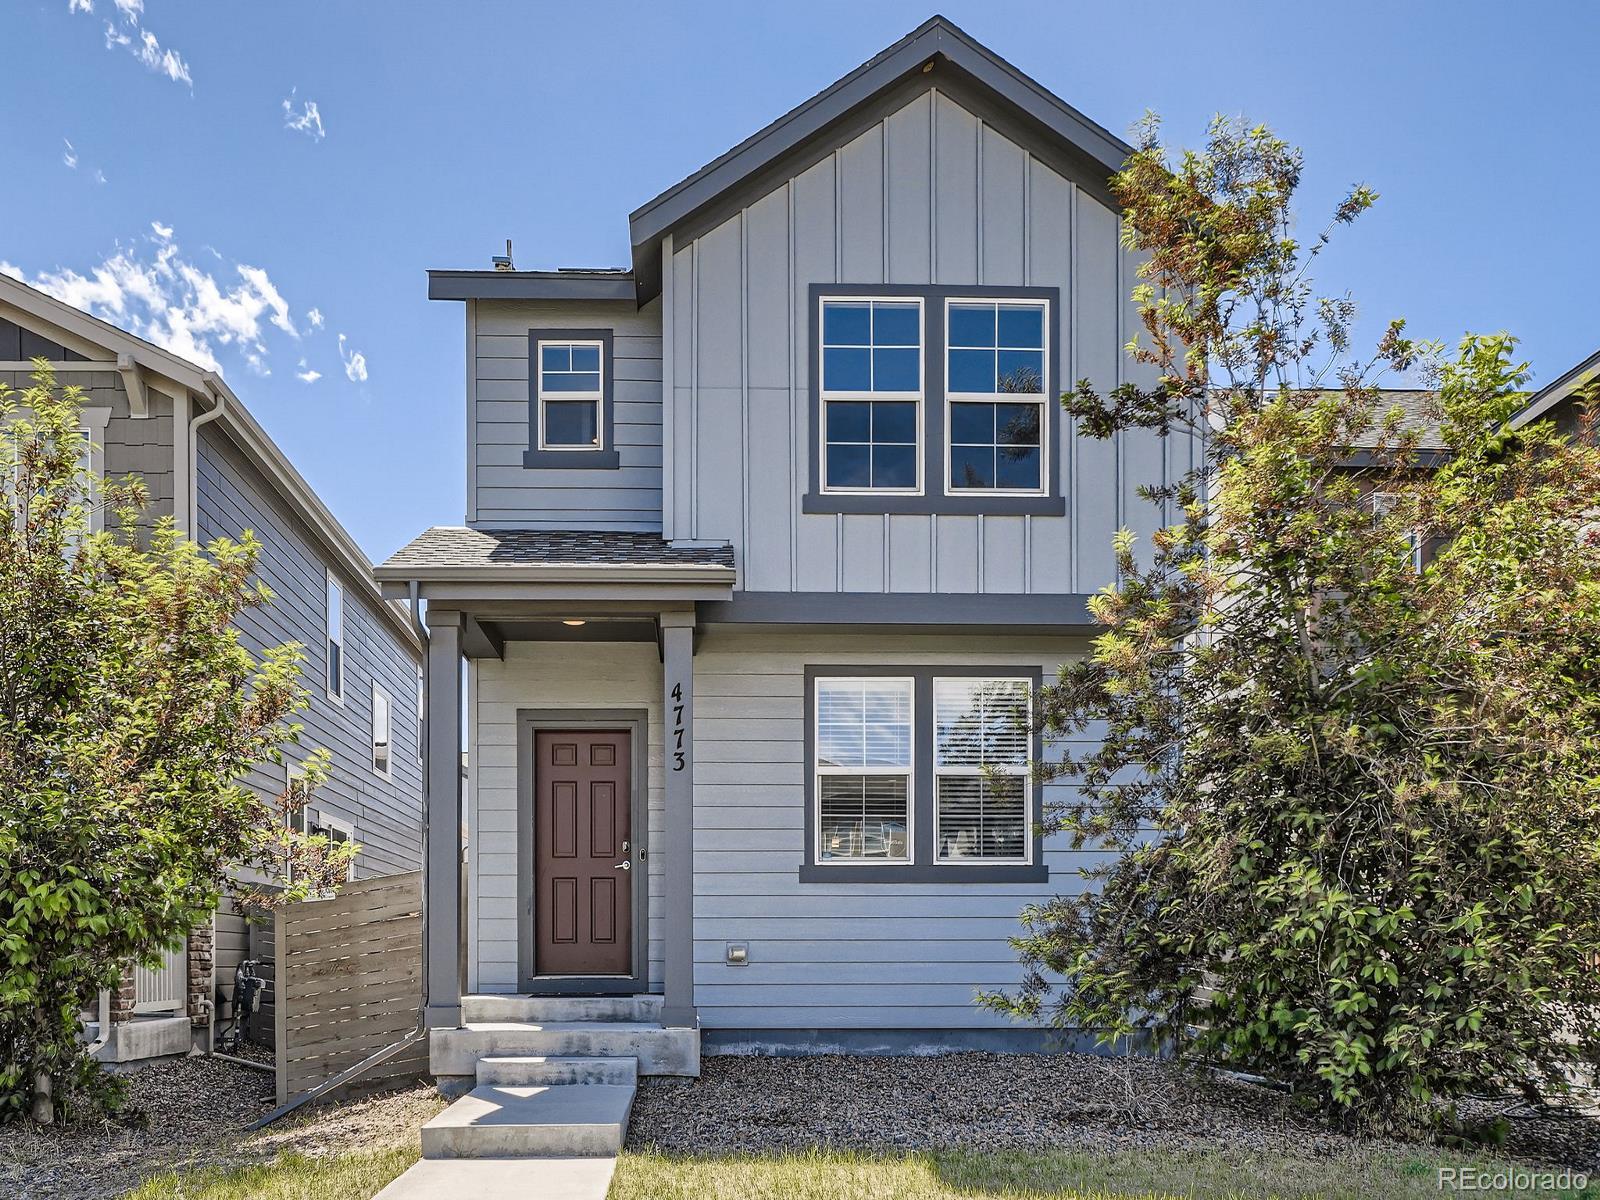
Active
$540,000
4
bds
|
3
ba
|
2,685
sqft
|
built
2018
4773 Kittredge St, Denver, CO 80239
$-841
Cash flow
-8.1%
Cash-on-Cash Return
3.8%
Cap rate
0.6%
Rent to Value Ratio
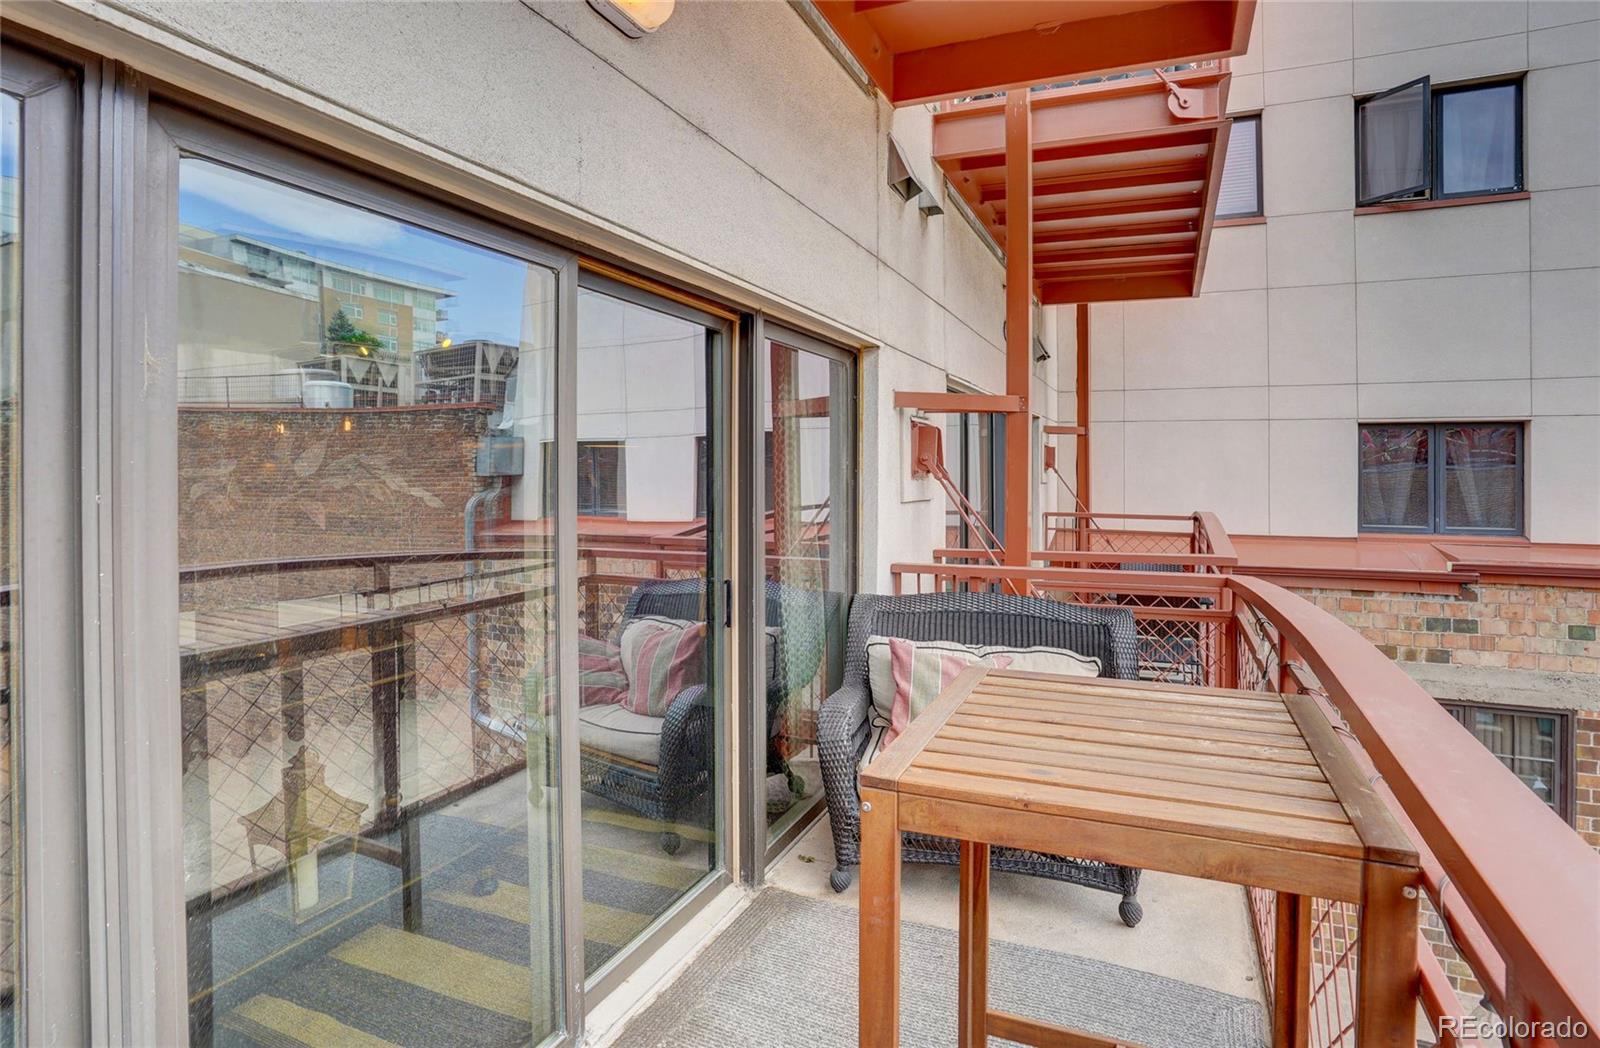
Active
$590,000
1
bds
|
2
ba
|
1,020
sqft
|
built
1928
1435 Wazee St, Denver, CO 80202
$-1,302
Cash flow
-11.5%
Cash-on-Cash Return
3.0%
Cap rate
0.5%
Rent to Value Ratio
Active
$598,000
2
bds
|
2
ba
|
1,352
sqft
|
built
1997
1200 S Cherokee St, Denver, CO 80223
$-1,673
Cash flow
-14.6%
Cash-on-Cash Return
2.3%
Cap rate
0.5%
Rent to Value Ratio
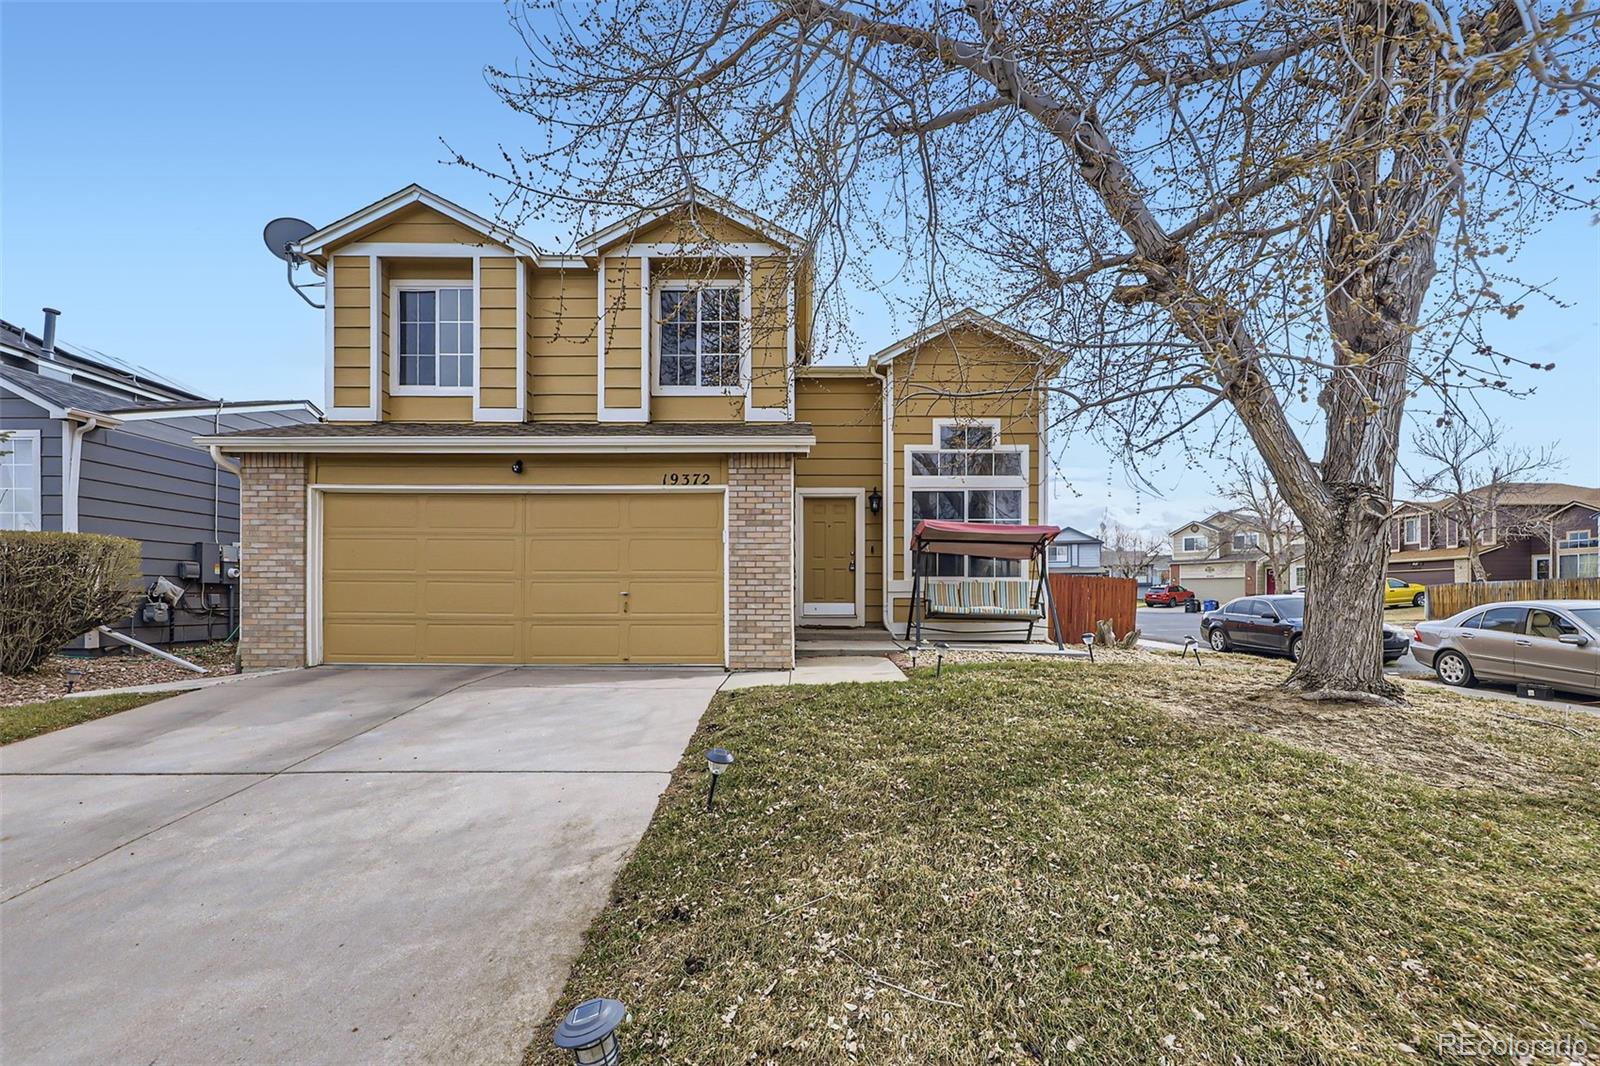
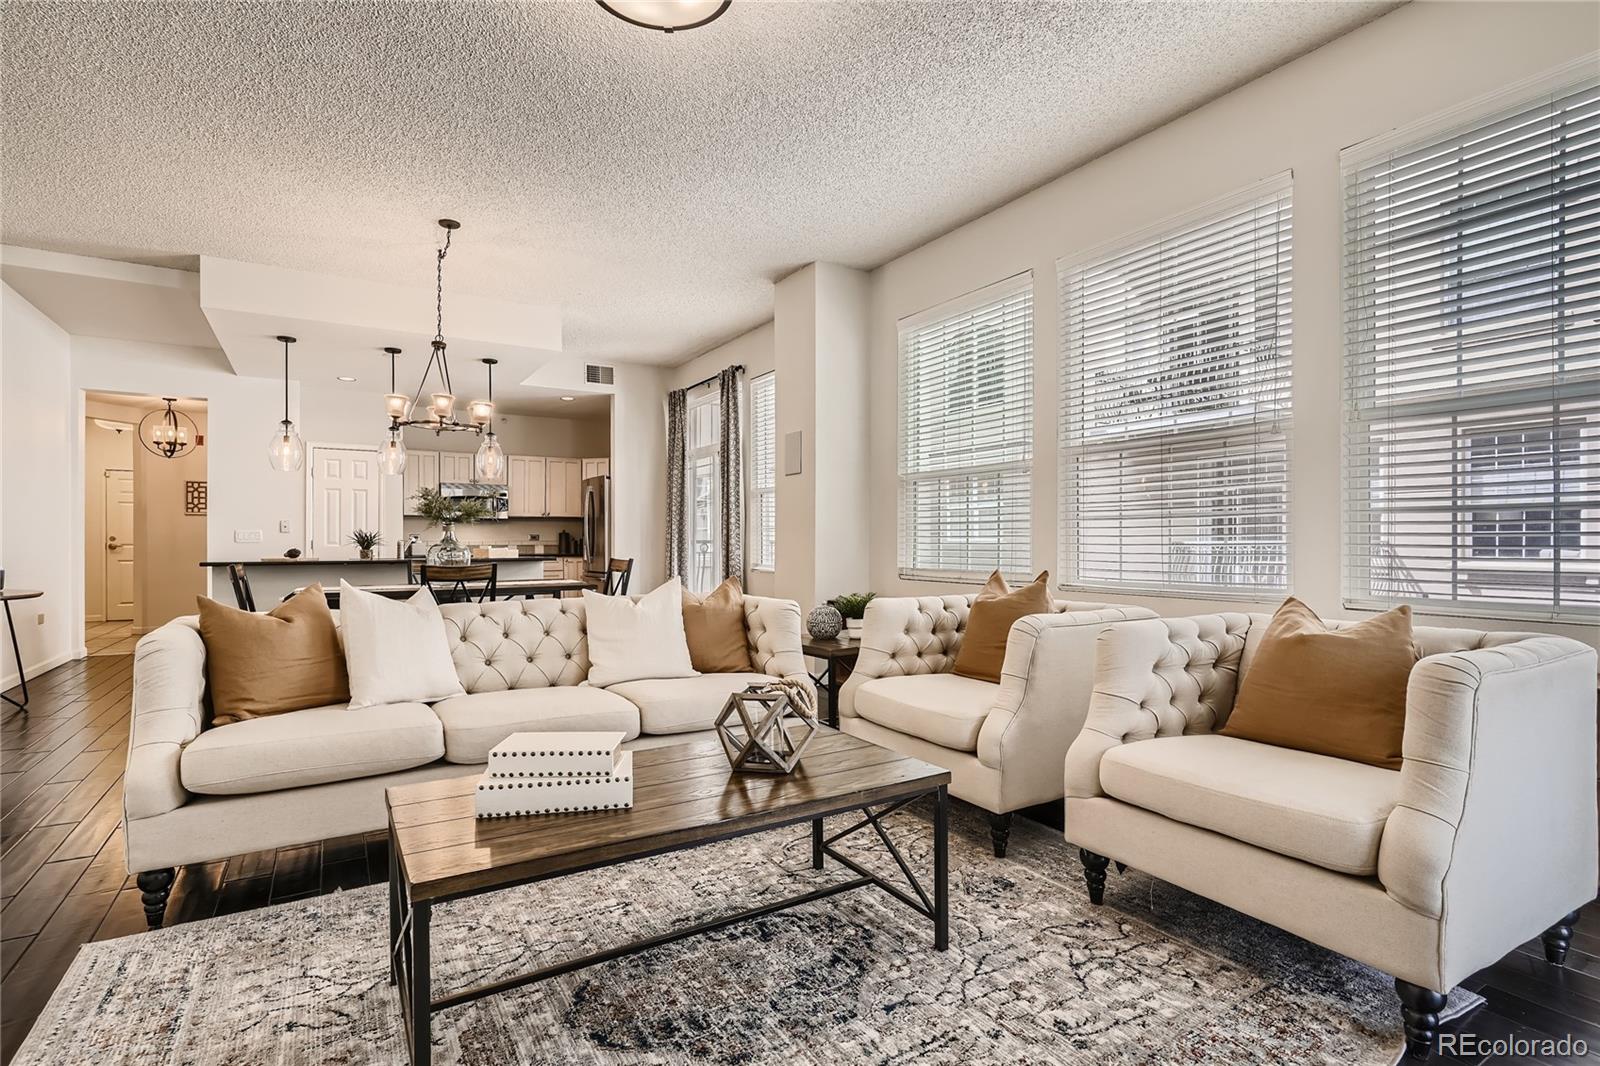
Active
$518,888
4
bds
|
3
ba
|
2,104
sqft
|
built
1994
19372 E 41st Ave, Denver, CO 80249
$-691
Cash flow
-6.9%
Cash-on-Cash Return
4.1%
Cap rate
0.6%
Rent to Value Ratio
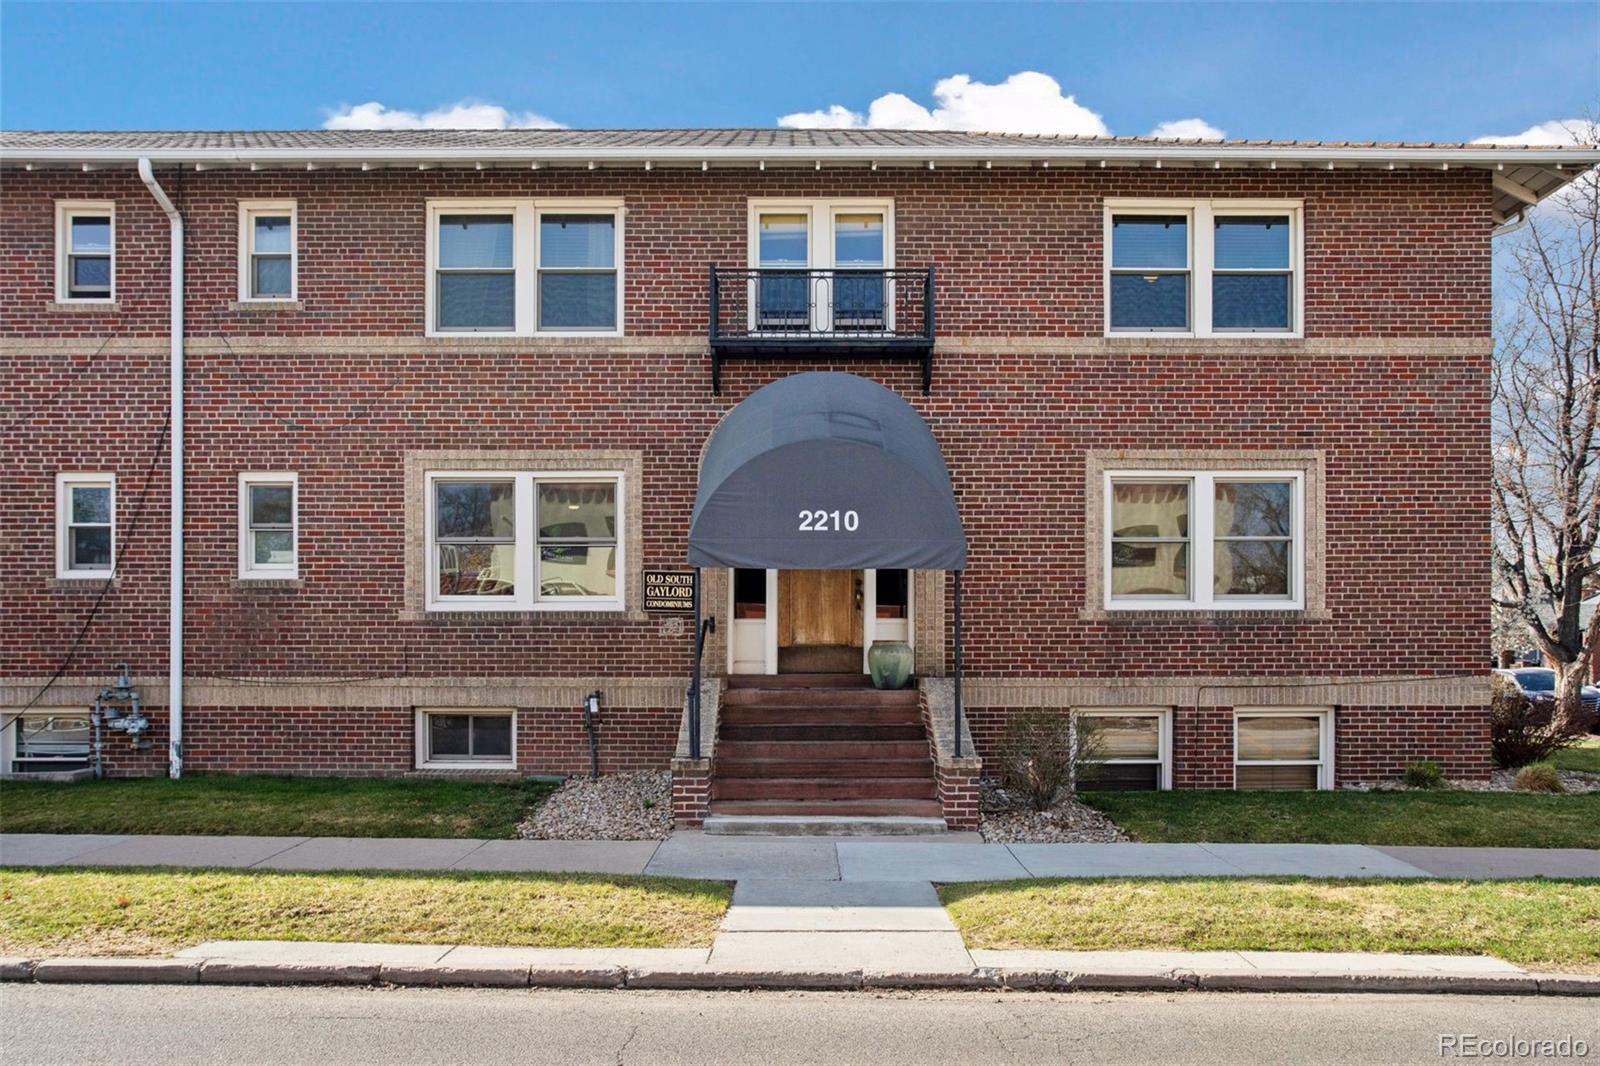
Active
$349,500
1
bds
|
1
ba
|
610
sqft
|
built
1926
2210 E Mississippi Ave, Denver, CO 80210
$-891
Cash flow
-13.3%
Cash-on-Cash Return
2.6%
Cap rate
0.6%
Rent to Value Ratio