Denver, CO Investment Properties for Sale
Browse homes for sale and investment properties in Denver, CO. Refine your search by price, property type, or more.
Best cash flowing properties in Denver, CO
Active under contract
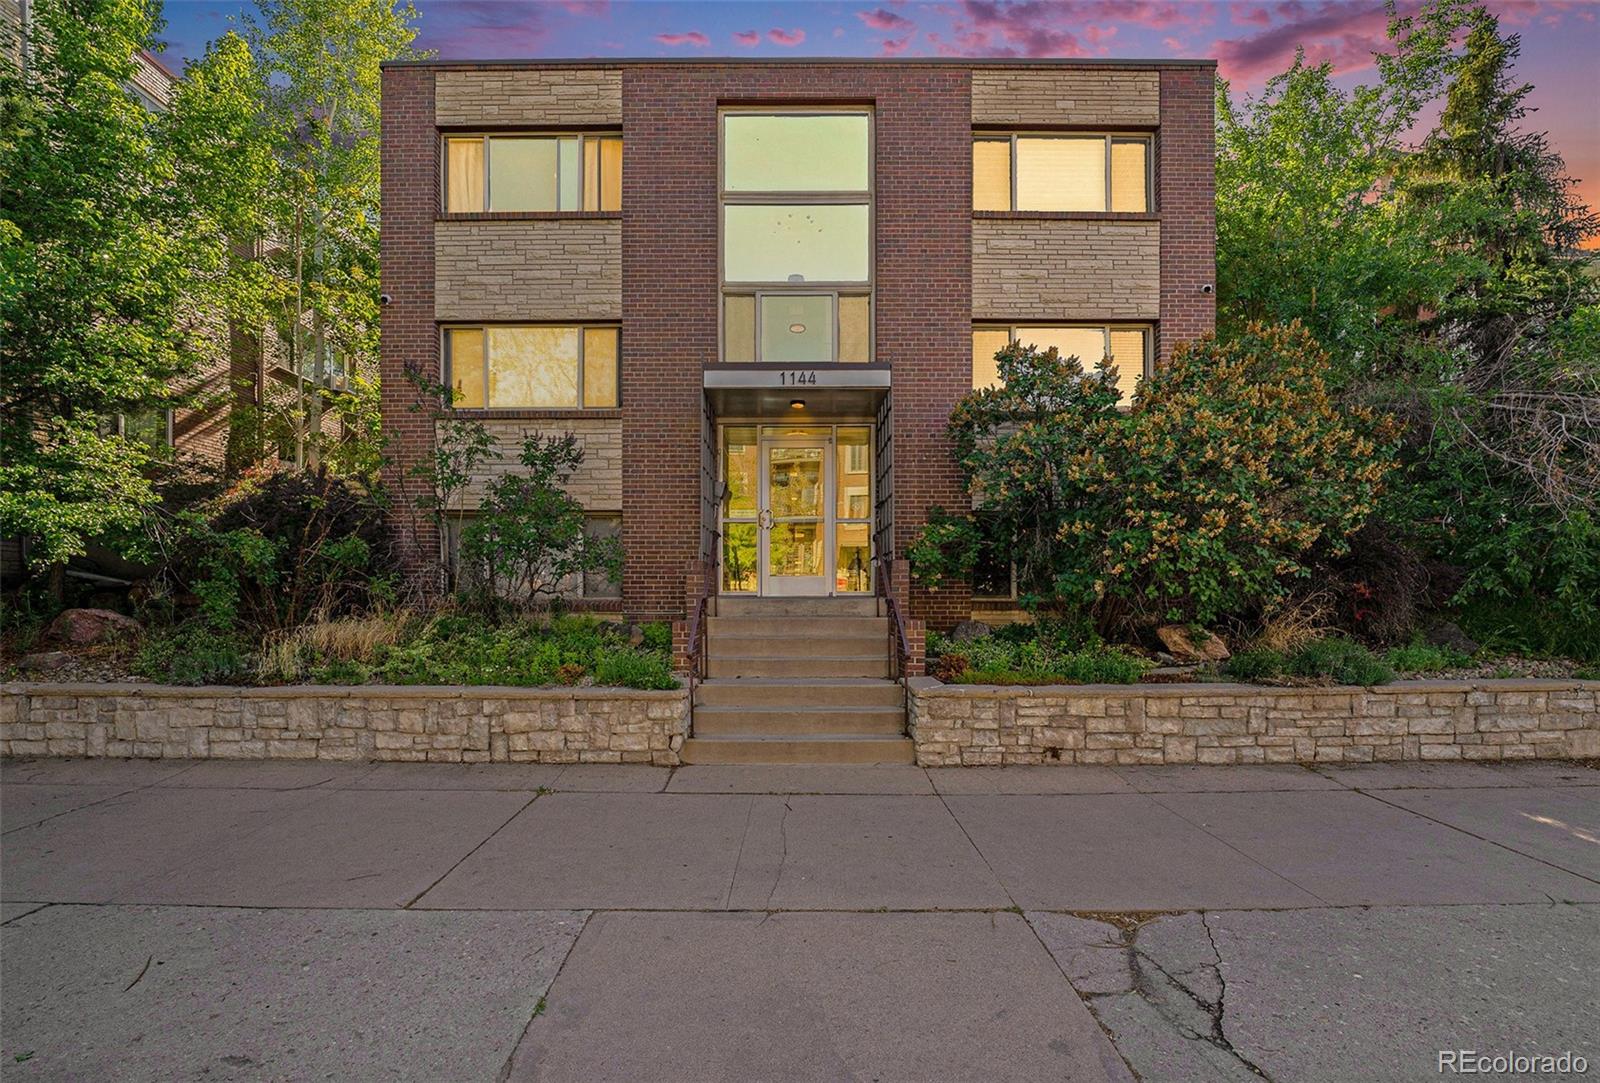
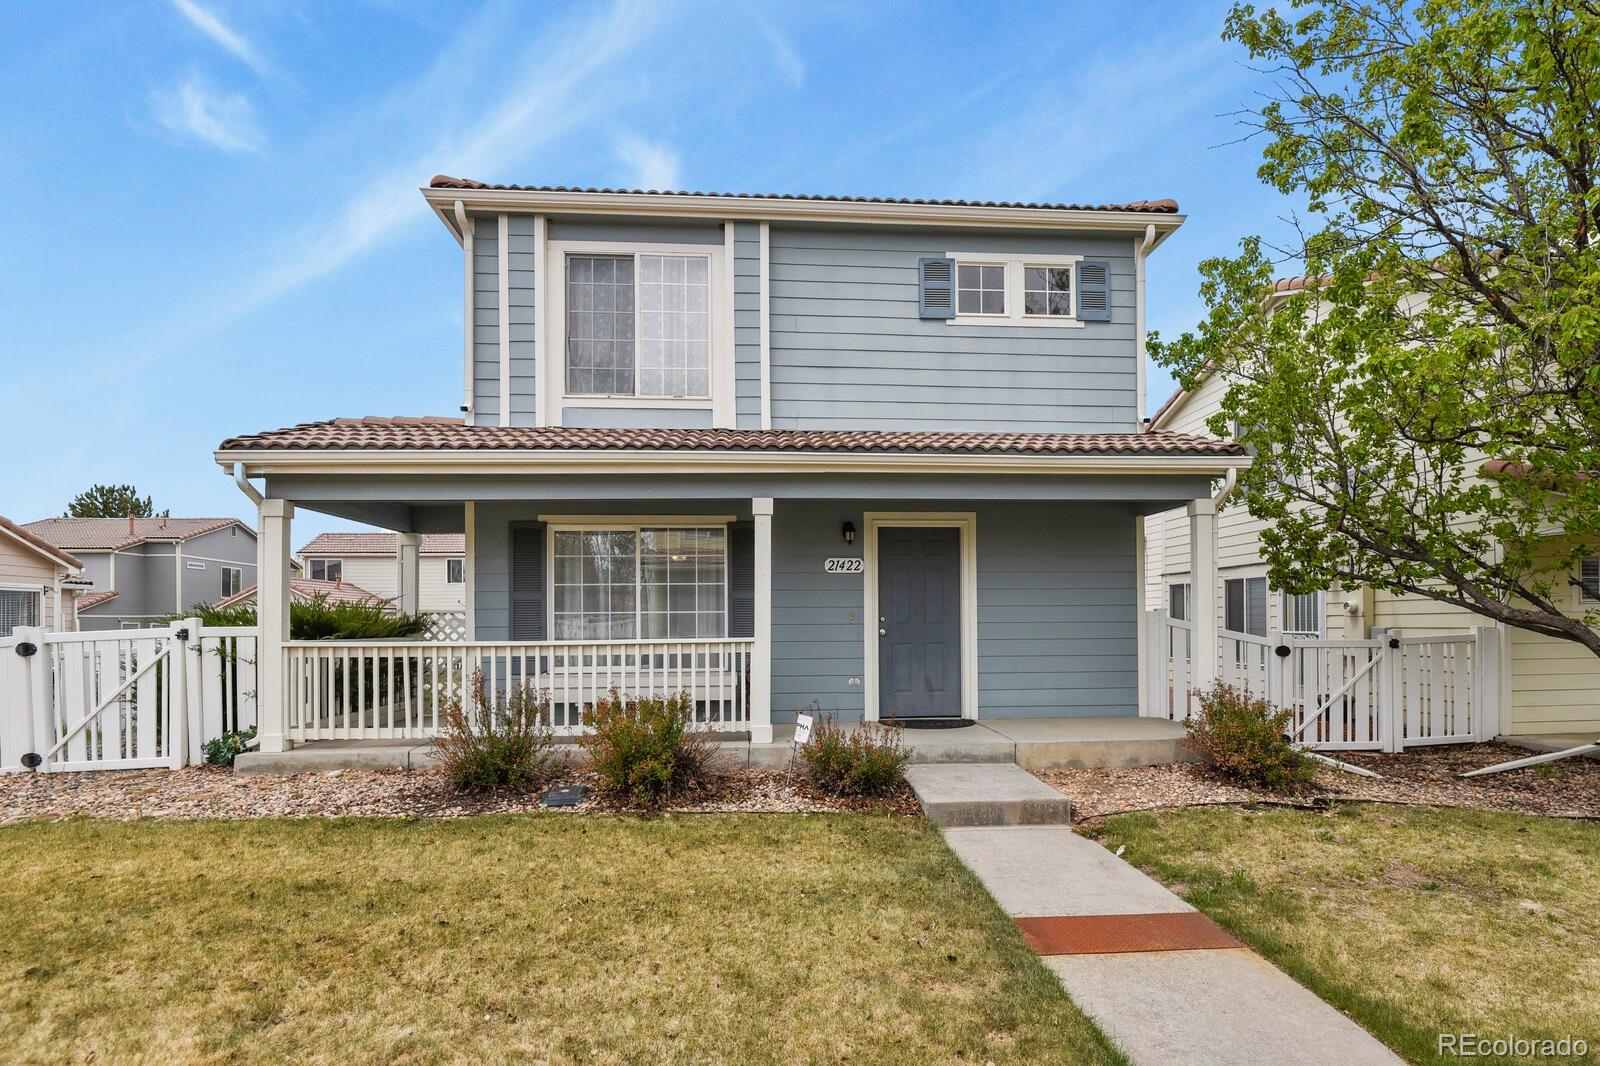
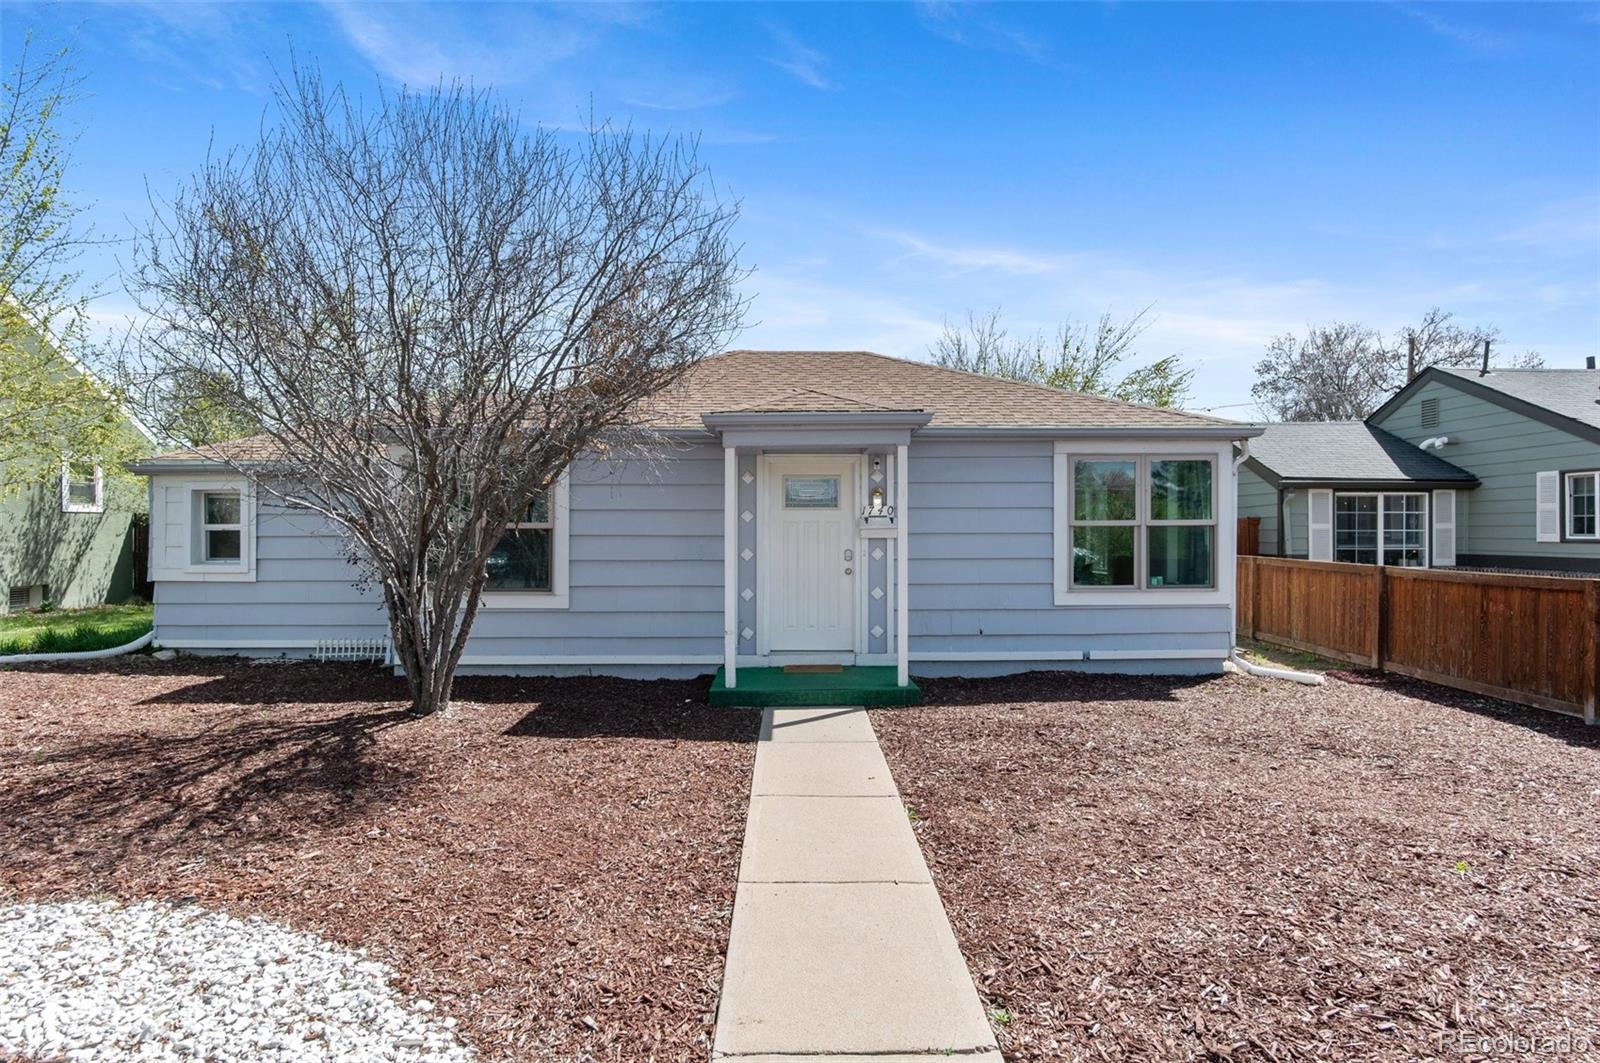
$199,999
1
bds
|
1
ba
|
584
sqft
|
built
1960
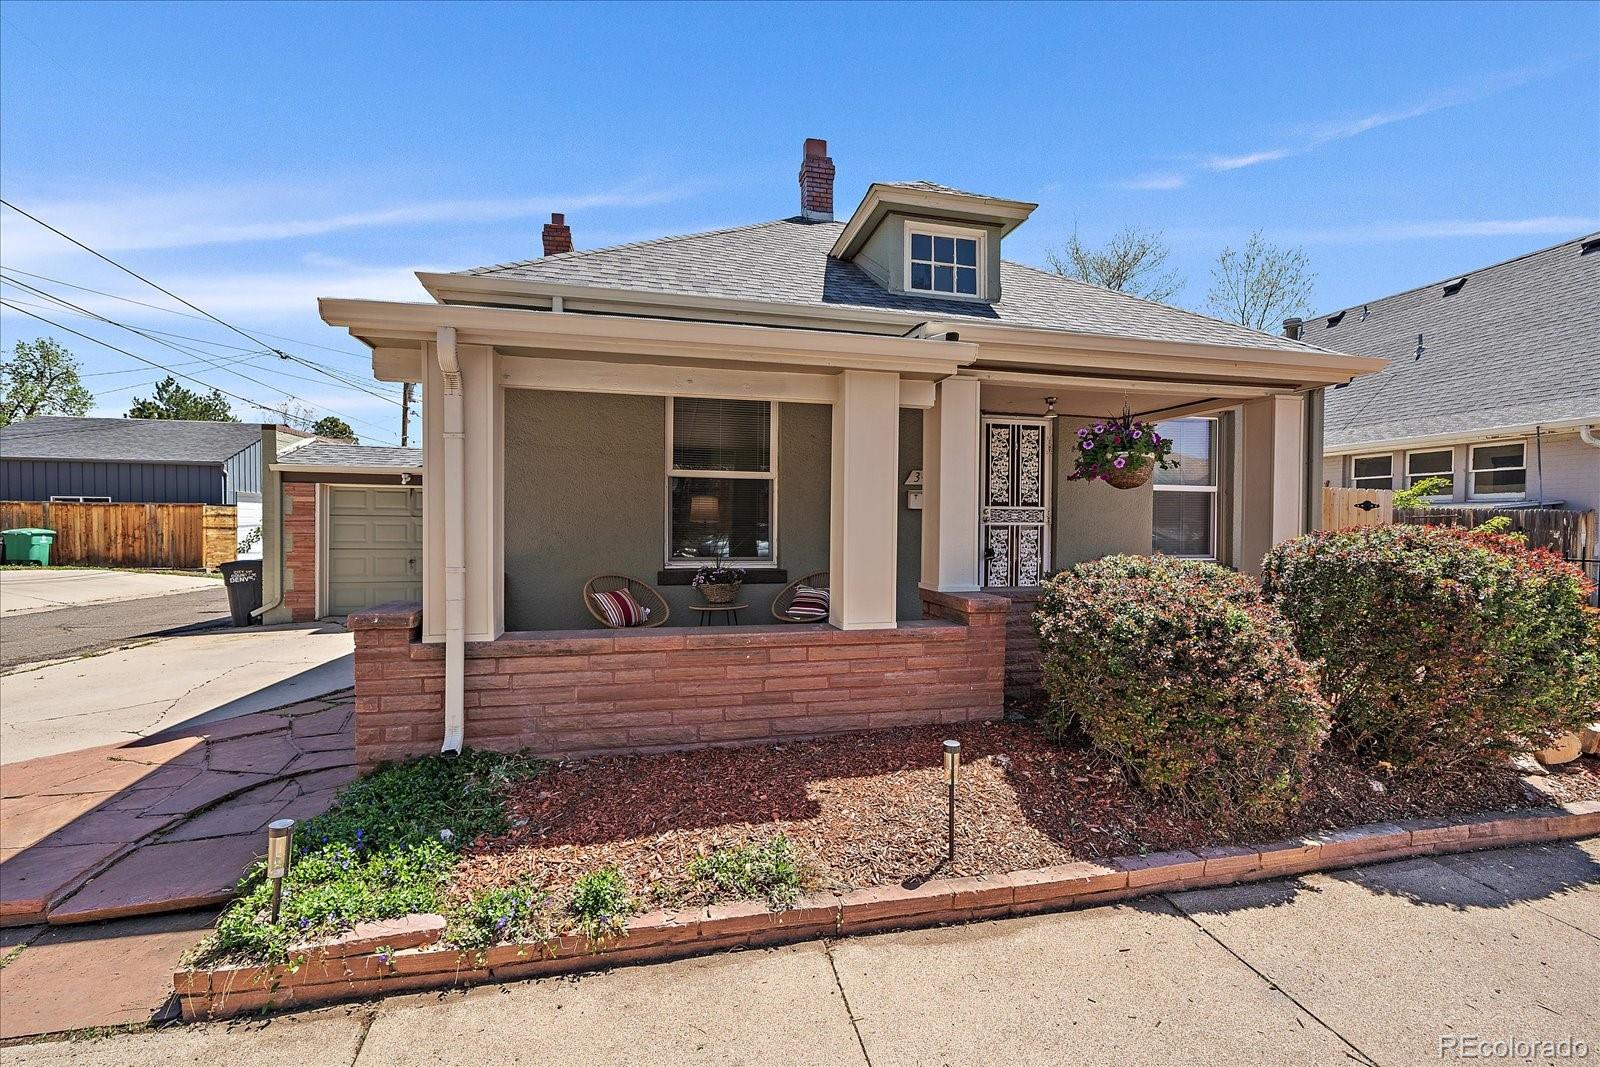
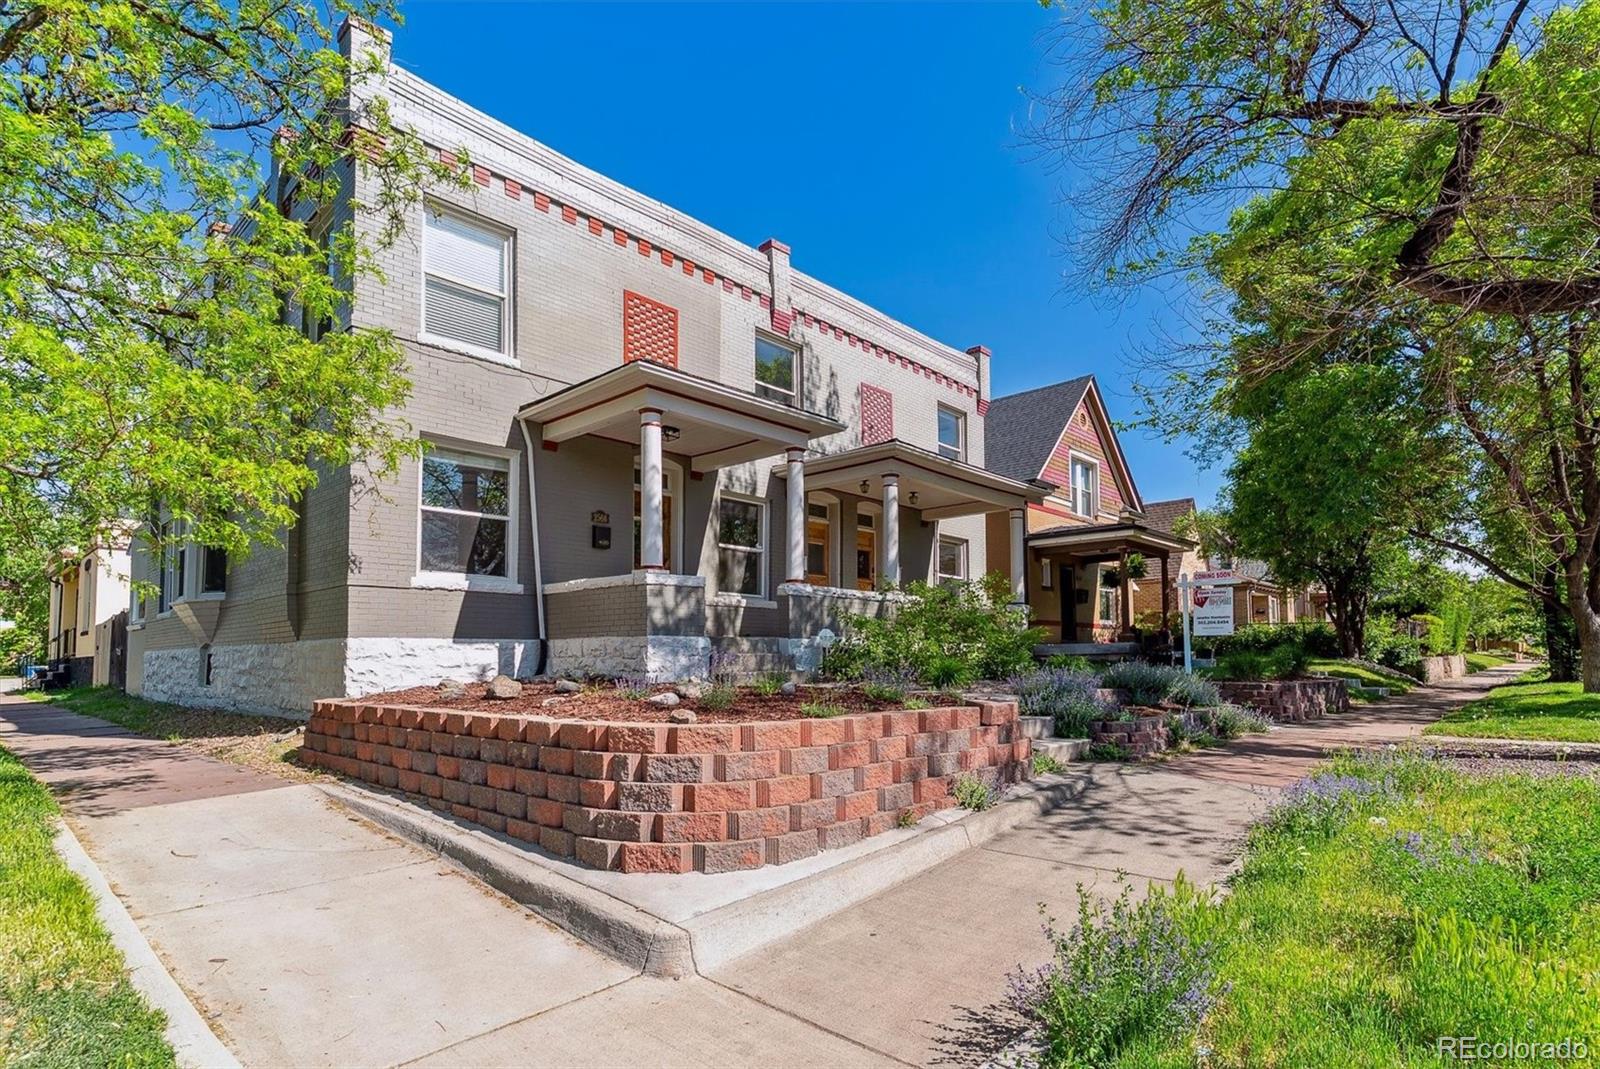
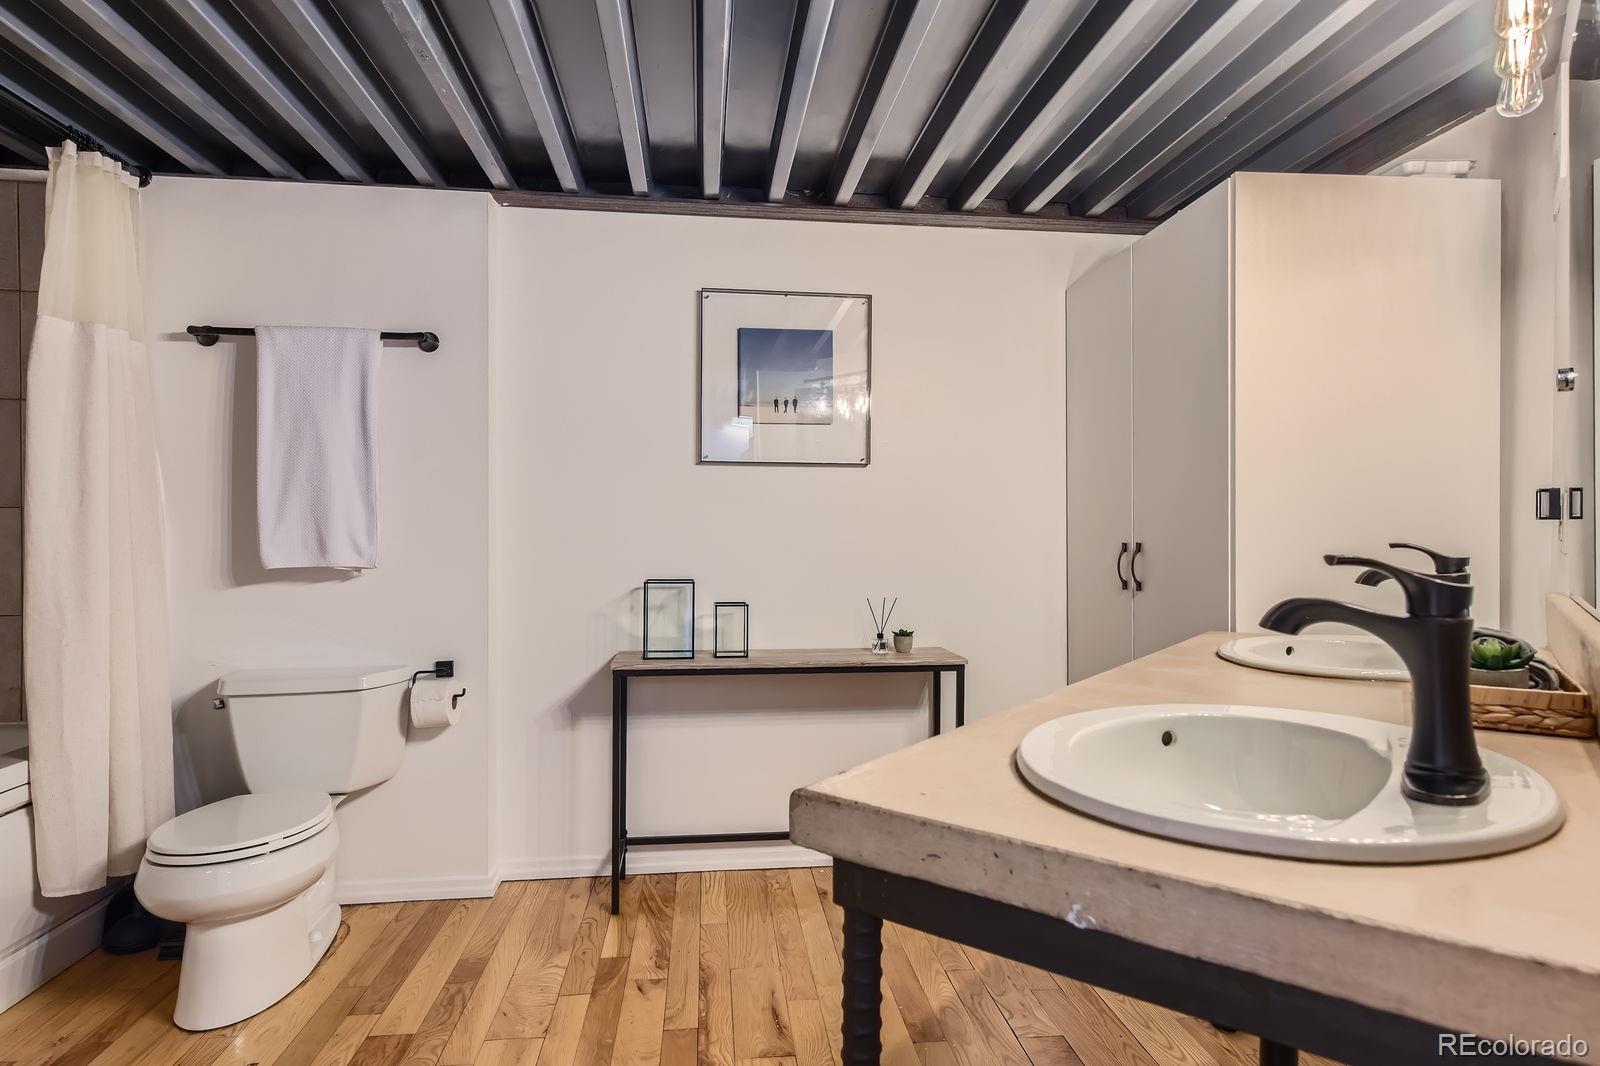
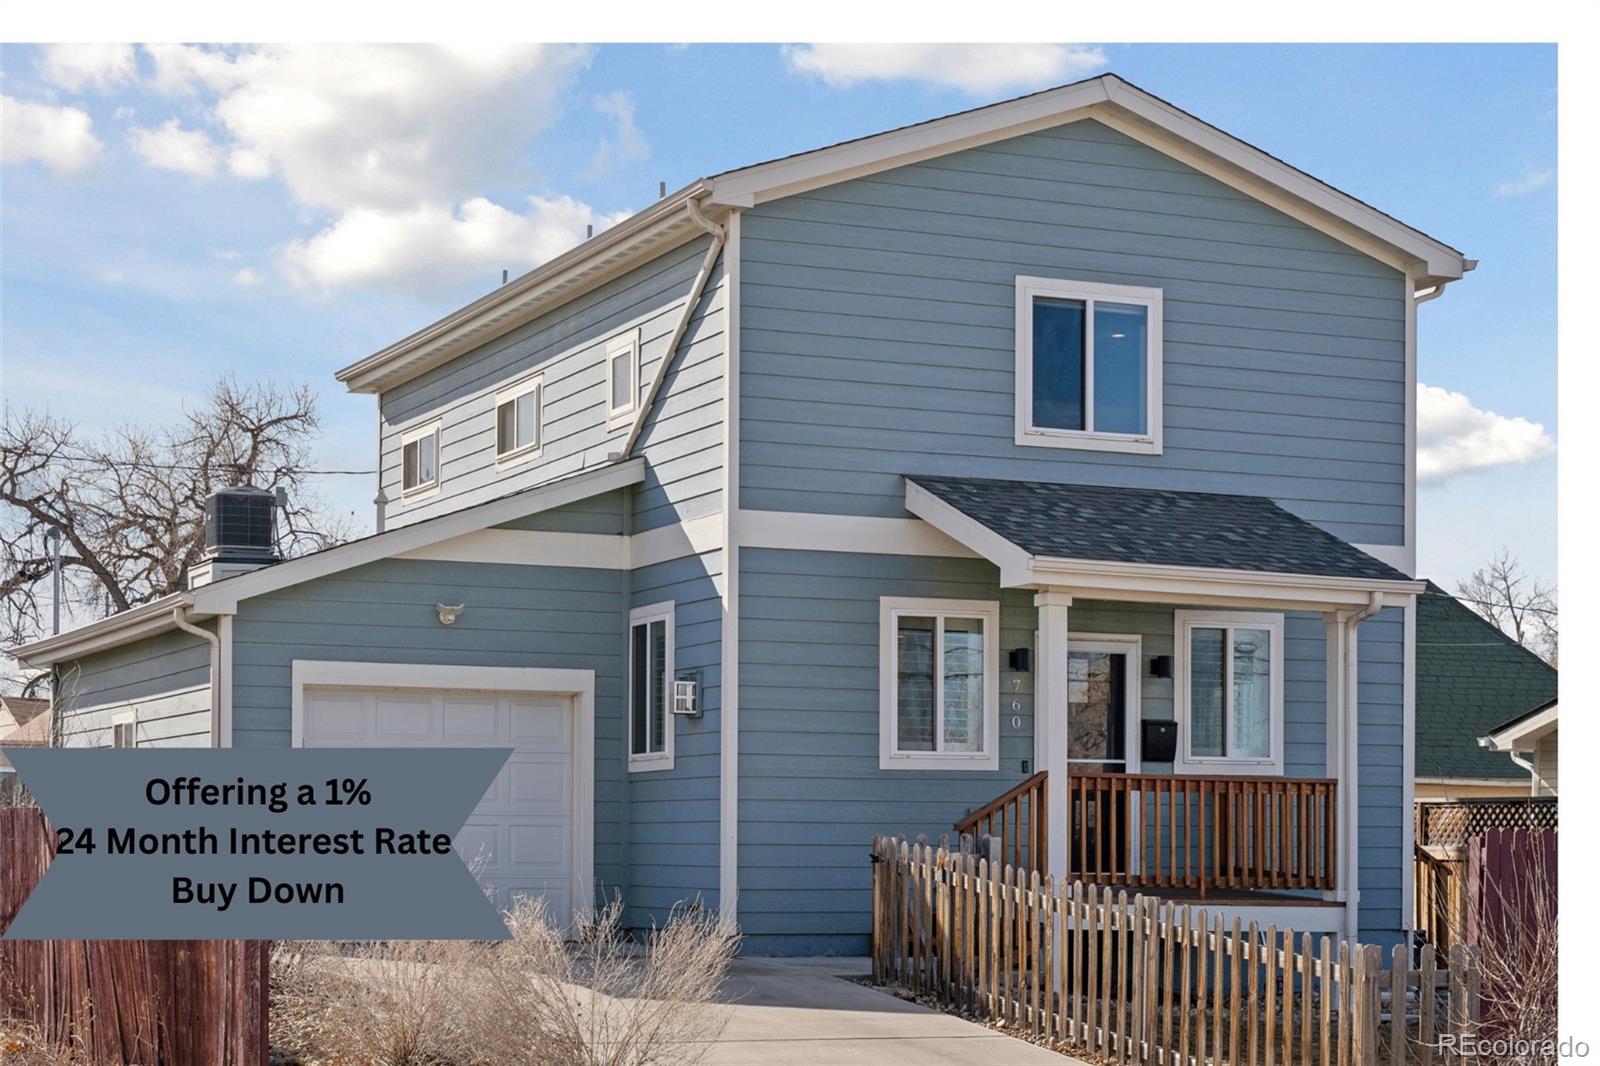
1144 N Ogden St, Denver, CO 80218
$-177
Cash flow
-4.6%
Cash-on-Cash Return
5.2%
Cap rate
0.9%
Rent to Value Ratio
Active under contract
$235,000
2
bds
|
1
ba
|
831
sqft
|
built
1972
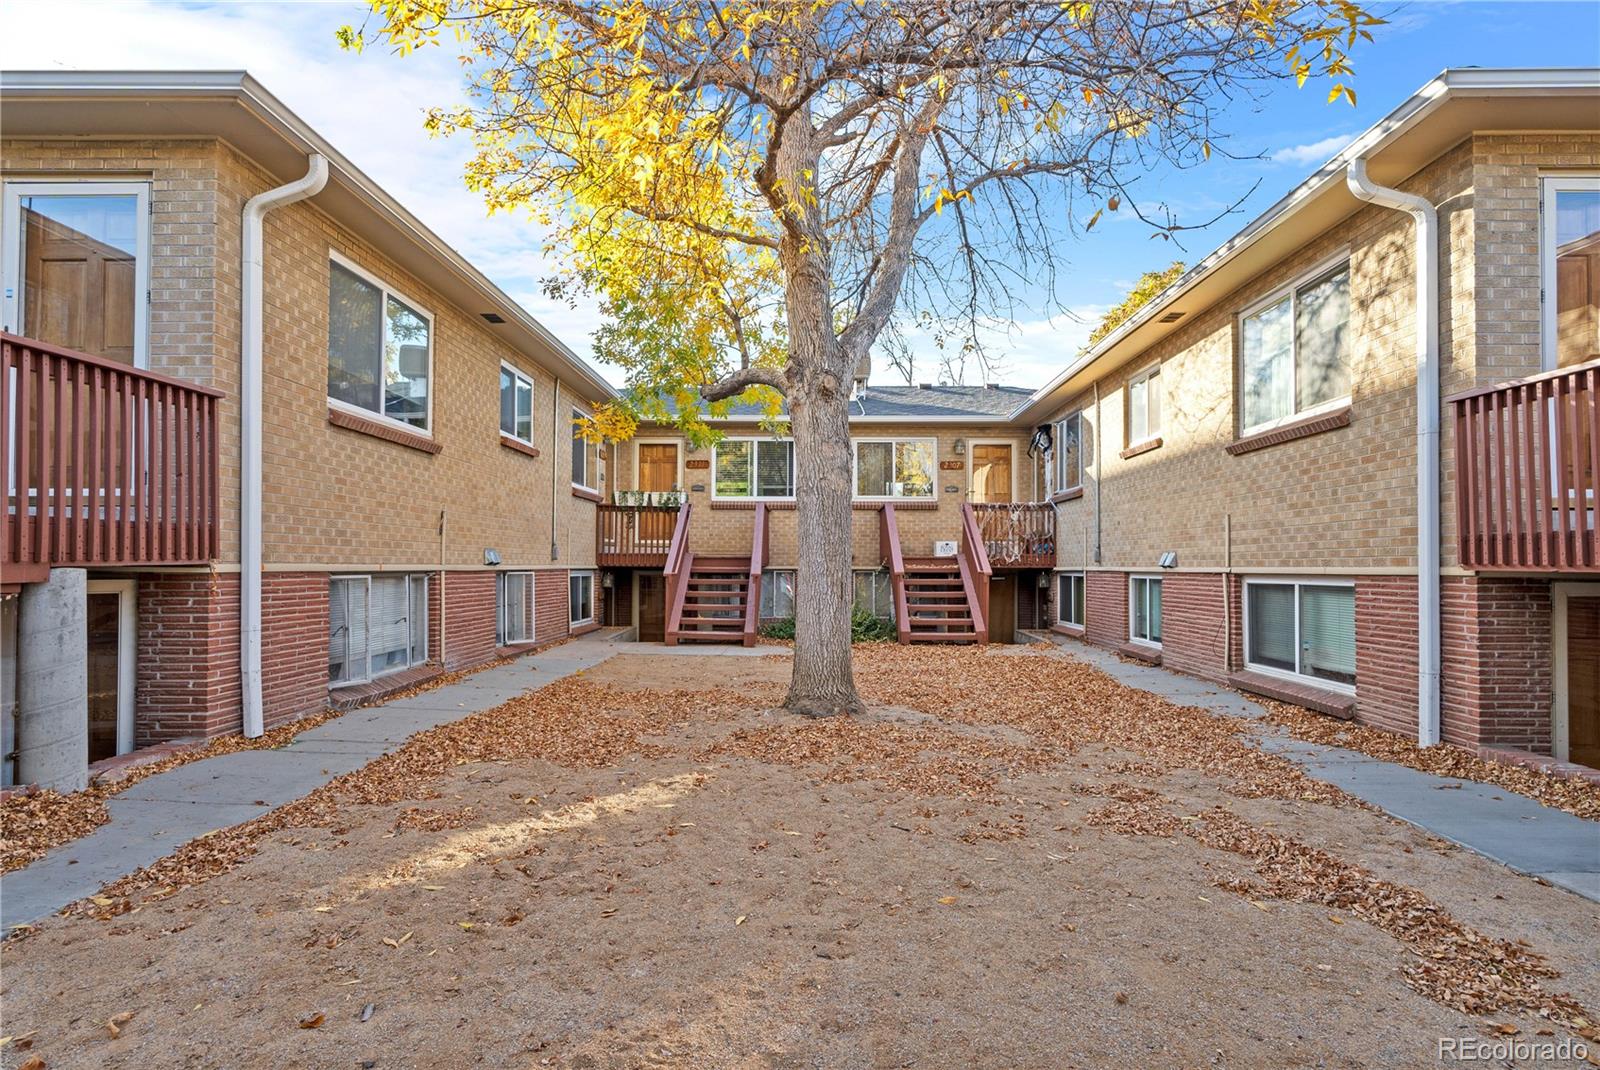
3663 S Sheridan Blvd, Denver, CO 80235
$-384
Cash flow
-8.5%
Cash-on-Cash Return
4.3%
Cap rate
0.8%
Rent to Value Ratio
3,272 out of 3,391 properties for sale in Denver, CO
Limited Results Shown
Create a free account, or log in to reveal all property listings and enjoy the complete experience.
Active
$1,124,900
4
bds
|
4
ba
|
4,136
sqft
|
built
1978
4505 S Yosemite St, Denver, CO 80237
$-4,520
Cash flow
-21.0%
Cash-on-Cash Return
1.5%
Cap rate
0.3%
Rent to Value Ratio
Active
$495,000
2
bds
|
2
ba
|
1,430
sqft
|
built
1903
1284 N Corona St, Denver, CO 80218
$-1,563
Cash flow
-16.5%
Cash-on-Cash Return
2.5%
Cap rate
0.6%
Rent to Value Ratio
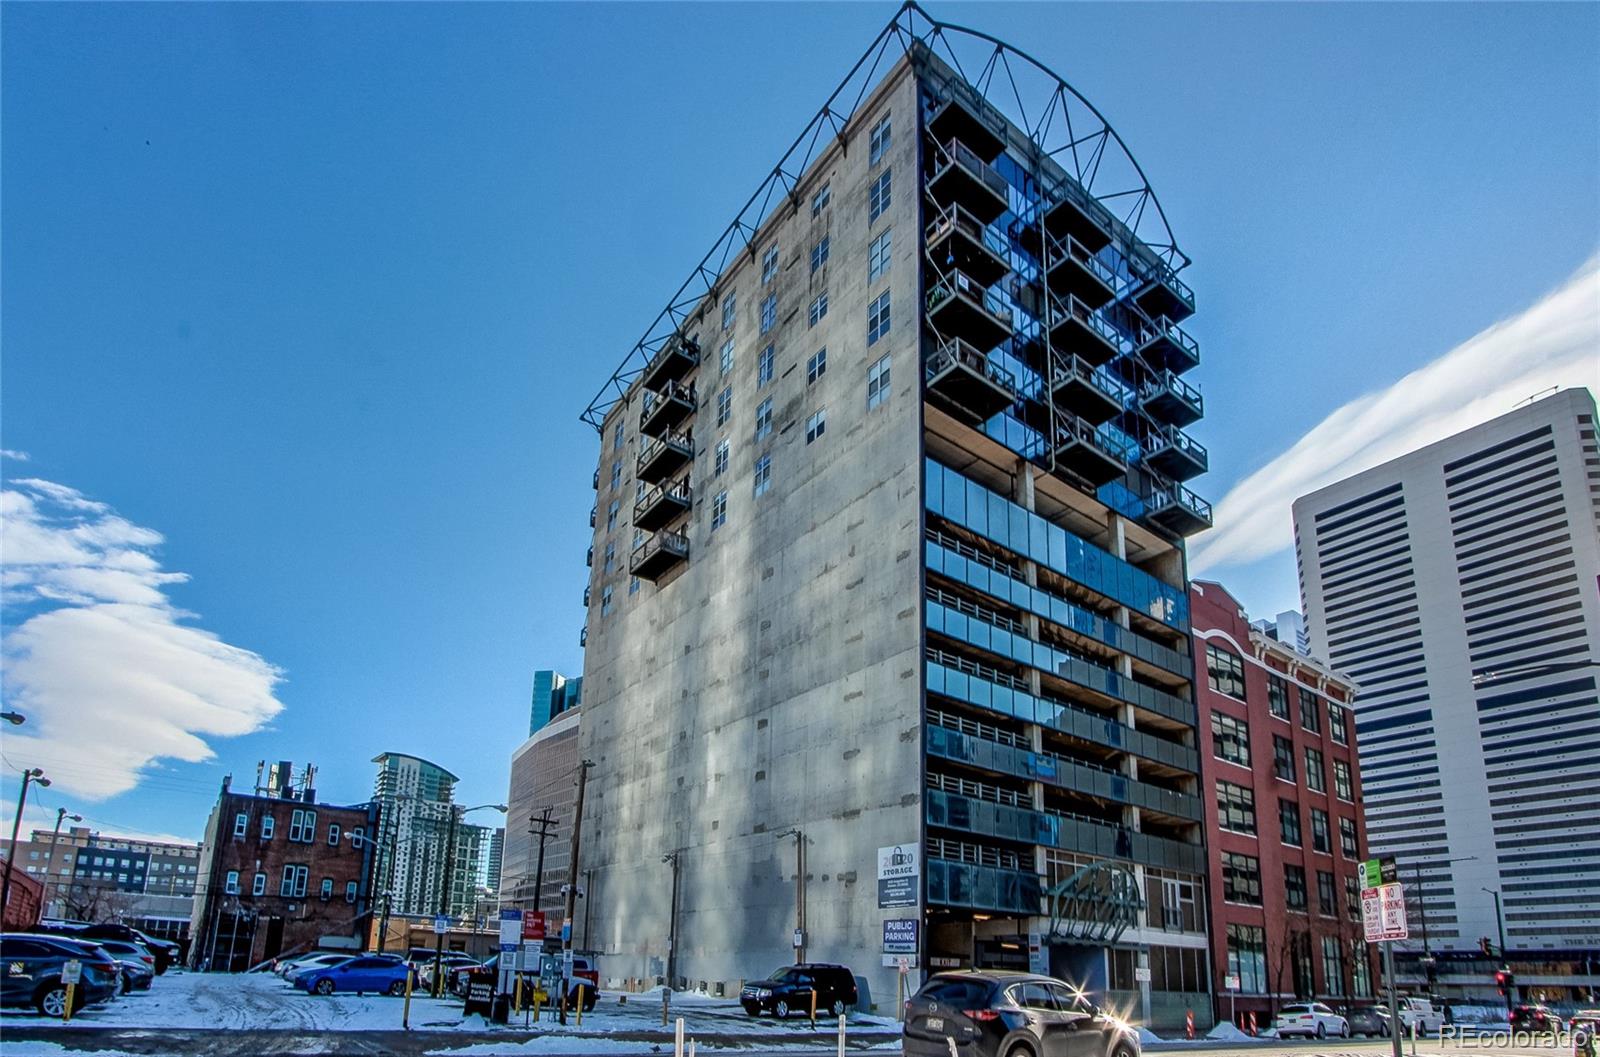
Active
$375,000
1
bds
|
2
ba
|
816
sqft
|
built
1980
1625 Larimer St, Denver, CO 80202
$-1,111
Cash flow
-15.5%
Cash-on-Cash Return
2.7%
Cap rate
0.6%
Rent to Value Ratio
Active
$1,299,900
4
bds
|
4
ba
|
2,757
sqft
|
built
1951
4790 E Dartmouth Ave, Denver, CO 80222
$-3,376
Cash flow
-13.6%
Cash-on-Cash Return
3.2%
Cap rate
0.4%
Rent to Value Ratio
Active
$1,050,000
4
bds
|
4
ba
|
2,760
sqft
|
built
2016
9456 E 51st Dr, Denver, CO 80238
$-3,306
Cash flow
-16.4%
Cash-on-Cash Return
2.5%
Cap rate
0.4%
Rent to Value Ratio
Active
$299,000
1
bds
|
1
ba
|
632
sqft
|
built
1938
444 17th St, Denver, CO 80202
$-732
Cash flow
-12.8%
Cash-on-Cash Return
3.3%
Cap rate
0.6%
Rent to Value Ratio
Active
$413,500
2
bds
|
1
ba
|
1,047
sqft
|
built
1942
1315 Xanthia St, Denver, CO 80220
$-739
Cash flow
-9.3%
Cash-on-Cash Return
4.1%
Cap rate
0.6%
Rent to Value Ratio
Active under contract
$235,000
2
bds
|
1
ba
|
831
sqft
|
built
1972
3663 S Sheridan Blvd, Denver, CO 80235
$-384
Cash flow
-8.5%
Cash-on-Cash Return
4.3%
Cap rate
0.8%
Rent to Value Ratio
Active under contract
$199,999
1
bds
|
1
ba
|
584
sqft
|
built
1960
1144 N Ogden St, Denver, CO 80218
$-177
Cash flow
-4.6%
Cash-on-Cash Return
5.2%
Cap rate
0.9%
Rent to Value Ratio
Active
$484,000
4
bds
|
3
ba
|
2,027
sqft
|
built
2021
19085 E 66th Ave, Denver, CO 80249
$-863
Cash flow
-9.3%
Cash-on-Cash Return
4.1%
Cap rate
0.6%
Rent to Value Ratio

Active
$219,000
2
bds
|
1
ba
|
967
sqft
|
built
1972
7755 E Quincy Ave, Denver, CO 80237
$-442
Cash flow
-10.5%
Cash-on-Cash Return
3.9%
Cap rate
0.8%
Rent to Value Ratio
Active
$445,000
4
bds
|
1
ba
|
1,330
sqft
|
built
1924
1253 Uinta St, Denver, CO 80220
$-395
Cash flow
-4.6%
Cash-on-Cash Return
5.2%
Cap rate
0.7%
Rent to Value Ratio
Active
$300,000
1
bds
|
1
ba
|
498
sqft
|
built
1906
710 E Alameda Ave, Denver, CO 80209
$-457
Cash flow
-7.9%
Cash-on-Cash Return
4.5%
Cap rate
0.6%
Rent to Value Ratio
Active
$549,000
2
bds
|
1
ba
|
929
sqft
|
built
1910
3420 Julian St, Denver, CO 80211
$-975
Cash flow
-9.3%
Cash-on-Cash Return
4.2%
Cap rate
0.6%
Rent to Value Ratio
Active
$429,000
1
bds
|
1
ba
|
895
sqft
|
built
2007
2240 N Clay St, Denver, CO 80211
$-1,099
Cash flow
-13.4%
Cash-on-Cash Return
3.2%
Cap rate
0.6%
Rent to Value Ratio
Active
$440,000
2
bds
|
1
ba
|
848
sqft
|
built
1986
1000 E 1st Ave, Denver, CO 80218
$-1,278
Cash flow
-15.2%
Cash-on-Cash Return
2.8%
Cap rate
0.6%
Rent to Value Ratio
Active
$409,000
1
bds
|
1
ba
|
700
sqft
|
built
1915
1111 Osage St, Denver, CO 80204
$-1,128
Cash flow
-14.4%
Cash-on-Cash Return
3.0%
Cap rate
0.5%
Rent to Value Ratio
Active
$550,000
3
bds
|
2
ba
|
1,371
sqft
|
built
1904
2566 N Emerson St, Denver, CO 80205
$-926
Cash flow
-8.8%
Cash-on-Cash Return
4.3%
Cap rate
0.6%
Rent to Value Ratio
Active
$289,900
2
bds
|
2
ba
|
936
sqft
|
built
1985
2575 S Syracuse Way, Denver, CO 80231
$-621
Cash flow
-11.2%
Cash-on-Cash Return
3.7%
Cap rate
0.7%
Rent to Value Ratio
Active
$250,000
2
bds
|
1
ba
|
726
sqft
|
built
1965
20 S Logan St, Denver, CO 80209
$-503
Cash flow
-10.5%
Cash-on-Cash Return
3.9%
Cap rate
0.8%
Rent to Value Ratio
Active
$310,000
1
bds
|
1
ba
|
632
sqft
|
built
1967
1020 15th St, Denver, CO 80202
$-876
Cash flow
-14.7%
Cash-on-Cash Return
2.9%
Cap rate
0.6%
Rent to Value Ratio
Pending
$409,000
3
bds
|
2
ba
|
1,300
sqft
|
built
2000
21422 E 47th Ave, Denver, CO 80249
$-775
Cash flow
-9.9%
Cash-on-Cash Return
4.0%
Cap rate
0.6%
Rent to Value Ratio
Active
$325,000
bds
|
1
ba
|
1,727
sqft
|
built
1940
3333 N Colorado Blvd, Denver, CO 80205
$-835
Cash flow
-13.4%
Cash-on-Cash Return
3.2%
Cap rate
0.7%
Rent to Value Ratio
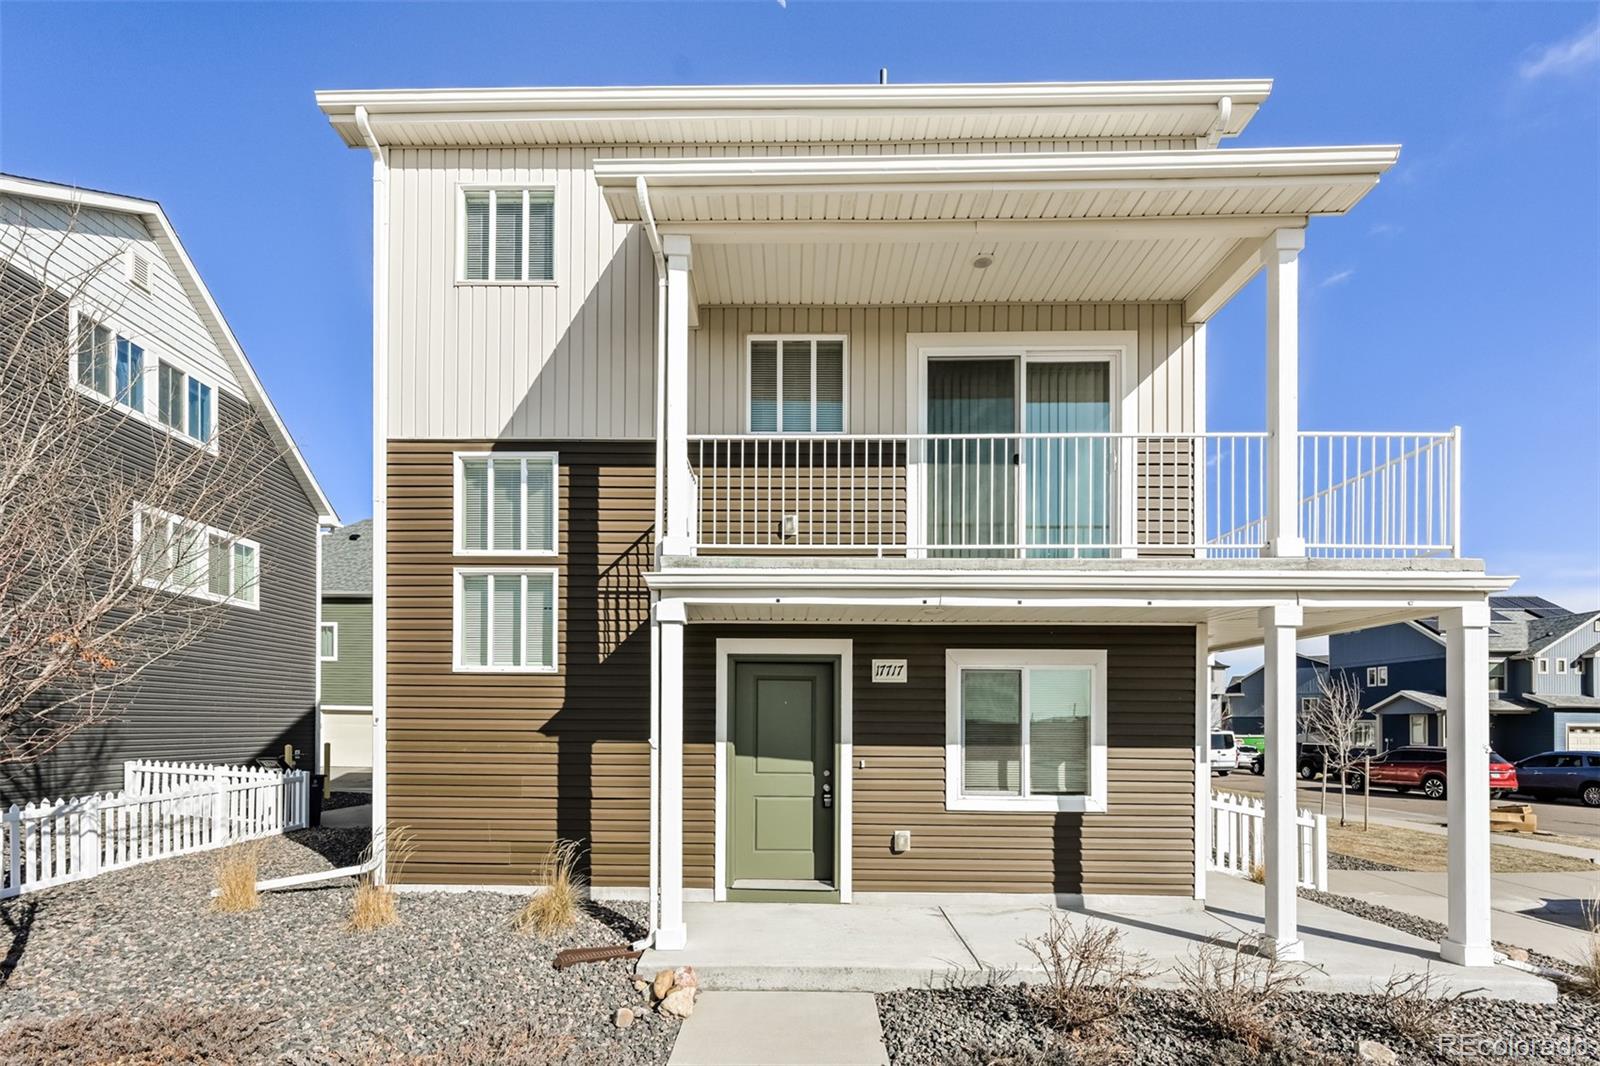
Active
$445,000
3
bds
|
2
ba
|
1,466
sqft
|
built
2018
17717 E 54th Ave, Denver, CO 80249
$-877
Cash flow
-10.3%
Cash-on-Cash Return
3.9%
Cap rate
0.7%
Rent to Value Ratio
Active
$450,000
1
bds
|
2
ba
|
1,006
sqft
|
built
1983
2020 Arapahoe St, Denver, CO 80205
$-1,277
Cash flow
-14.8%
Cash-on-Cash Return
2.9%
Cap rate
0.6%
Rent to Value Ratio
Active
$430,000
1
bds
|
1
ba
|
1,046
sqft
|
built
1930
1000 E 18th Ave, Denver, CO 80218
$-1,123
Cash flow
-13.6%
Cash-on-Cash Return
3.2%
Cap rate
0.6%
Rent to Value Ratio
Active
$317,000
2
bds
|
1
ba
|
598
sqft
|
built
1957
2313 S Race St, Denver, CO 80210
$-851
Cash flow
-14.0%
Cash-on-Cash Return
3.1%
Cap rate
0.6%
Rent to Value Ratio
Active
$625,000
2
bds
|
1
ba
|
1,104
sqft
|
built
1901
3929 Shoshone St, Denver, CO 80211
$-1,324
Cash flow
-11.1%
Cash-on-Cash Return
3.7%
Cap rate
0.5%
Rent to Value Ratio
Active
$235,000
1
bds
|
1
ba
|
701
sqft
|
built
1982
8600 E Alameda Ave, Denver, CO 80247
$-504
Cash flow
-11.2%
Cash-on-Cash Return
3.7%
Cap rate
0.7%
Rent to Value Ratio
Active
$615,000
2
bds
|
2
ba
|
1,011
sqft
|
built
2019
2790 W 25th Ave, Denver, CO 80211
$-1,232
Cash flow
-10.5%
Cash-on-Cash Return
3.9%
Cap rate
0.5%
Rent to Value Ratio
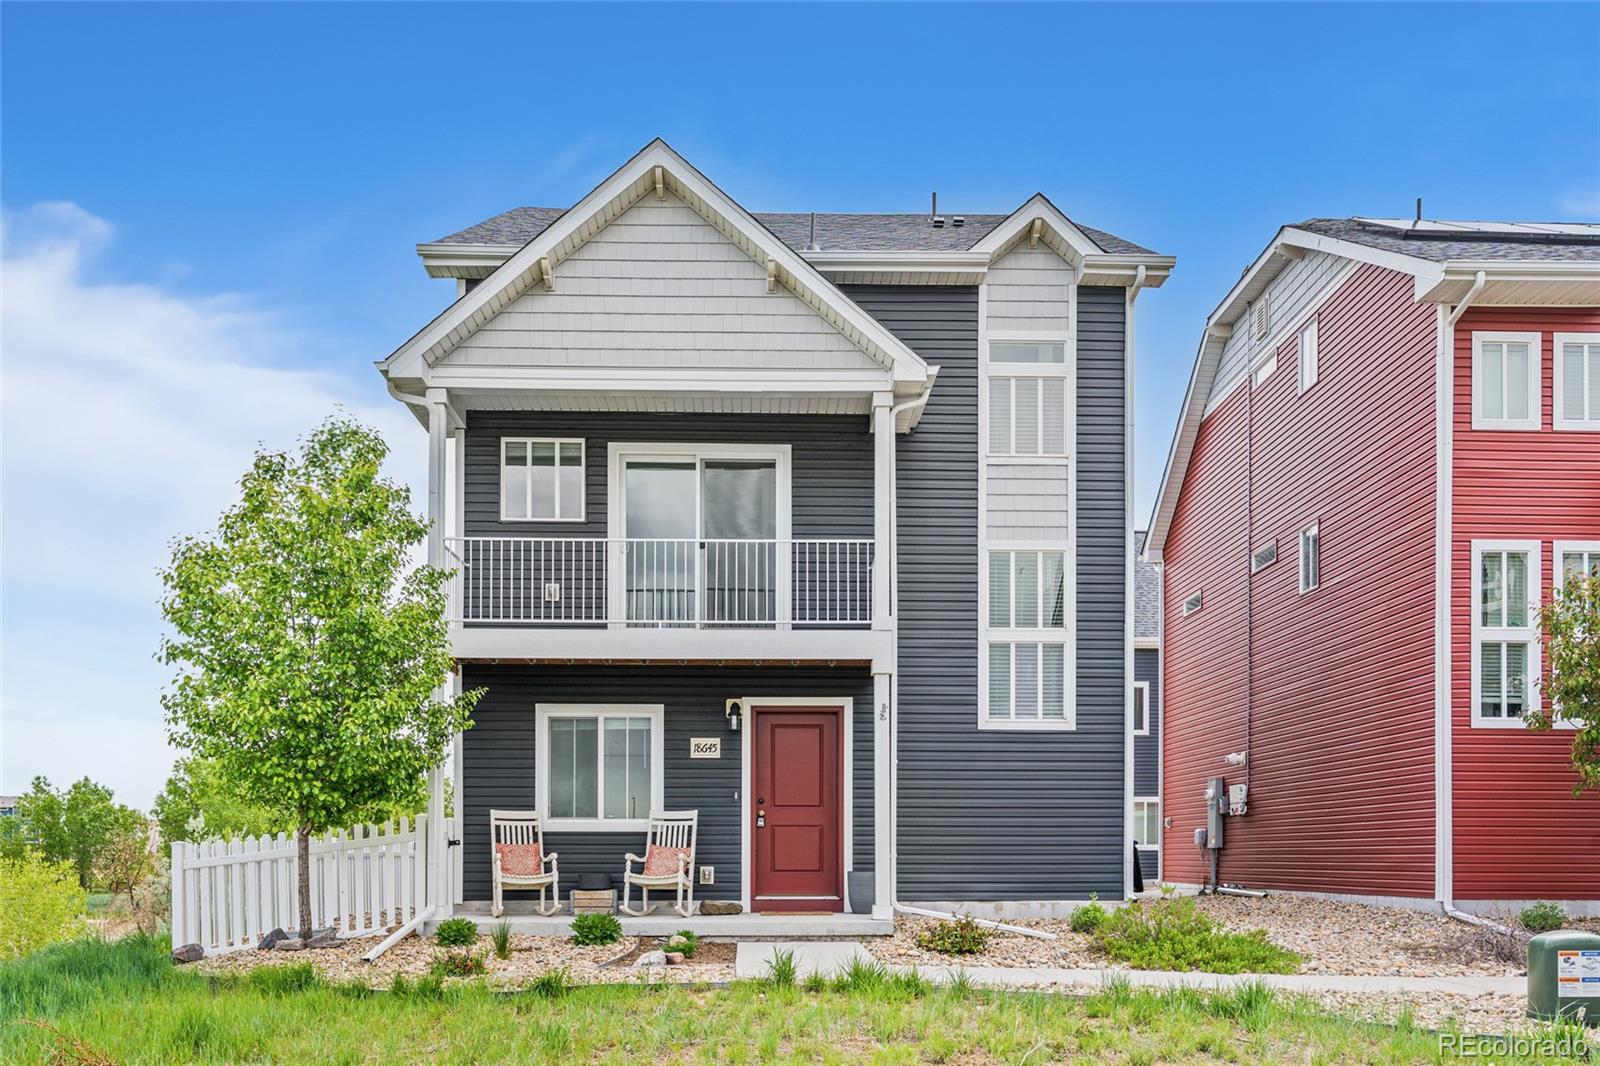
Active under contract
$420,000
2
bds
|
2
ba
|
1,423
sqft
|
built
2020
18645 E 54th Pl, Denver, CO 80249
$-639
Cash flow
-7.9%
Cash-on-Cash Return
4.5%
Cap rate
0.7%
Rent to Value Ratio
Active
$649,900
3
bds
|
2
ba
|
768
sqft
|
built
1927
2034 S Lincoln St, Denver, CO 80210
$-1,744
Cash flow
-14.0%
Cash-on-Cash Return
3.1%
Cap rate
0.4%
Rent to Value Ratio
Active
$540,000
3
bds
|
2
ba
|
1,498
sqft
|
built
1951
2895 Poplar St, Denver, CO 80207
$-1,320
Cash flow
-12.8%
Cash-on-Cash Return
3.4%
Cap rate
0.5%
Rent to Value Ratio
Active
$599,000
3
bds
|
2
ba
|
1,344
sqft
|
built
2017
760 W Asbury Ave, Denver, CO 80223
$-1,001
Cash flow
-8.7%
Cash-on-Cash Return
4.3%
Cap rate
0.6%
Rent to Value Ratio
Active
$569,788
4
bds
|
2
ba
|
1,804
sqft
|
built
1966
2995 S Whiting Way, Denver, CO 80231
$-1,413
Cash flow
-12.9%
Cash-on-Cash Return
3.3%
Cap rate
0.5%
Rent to Value Ratio
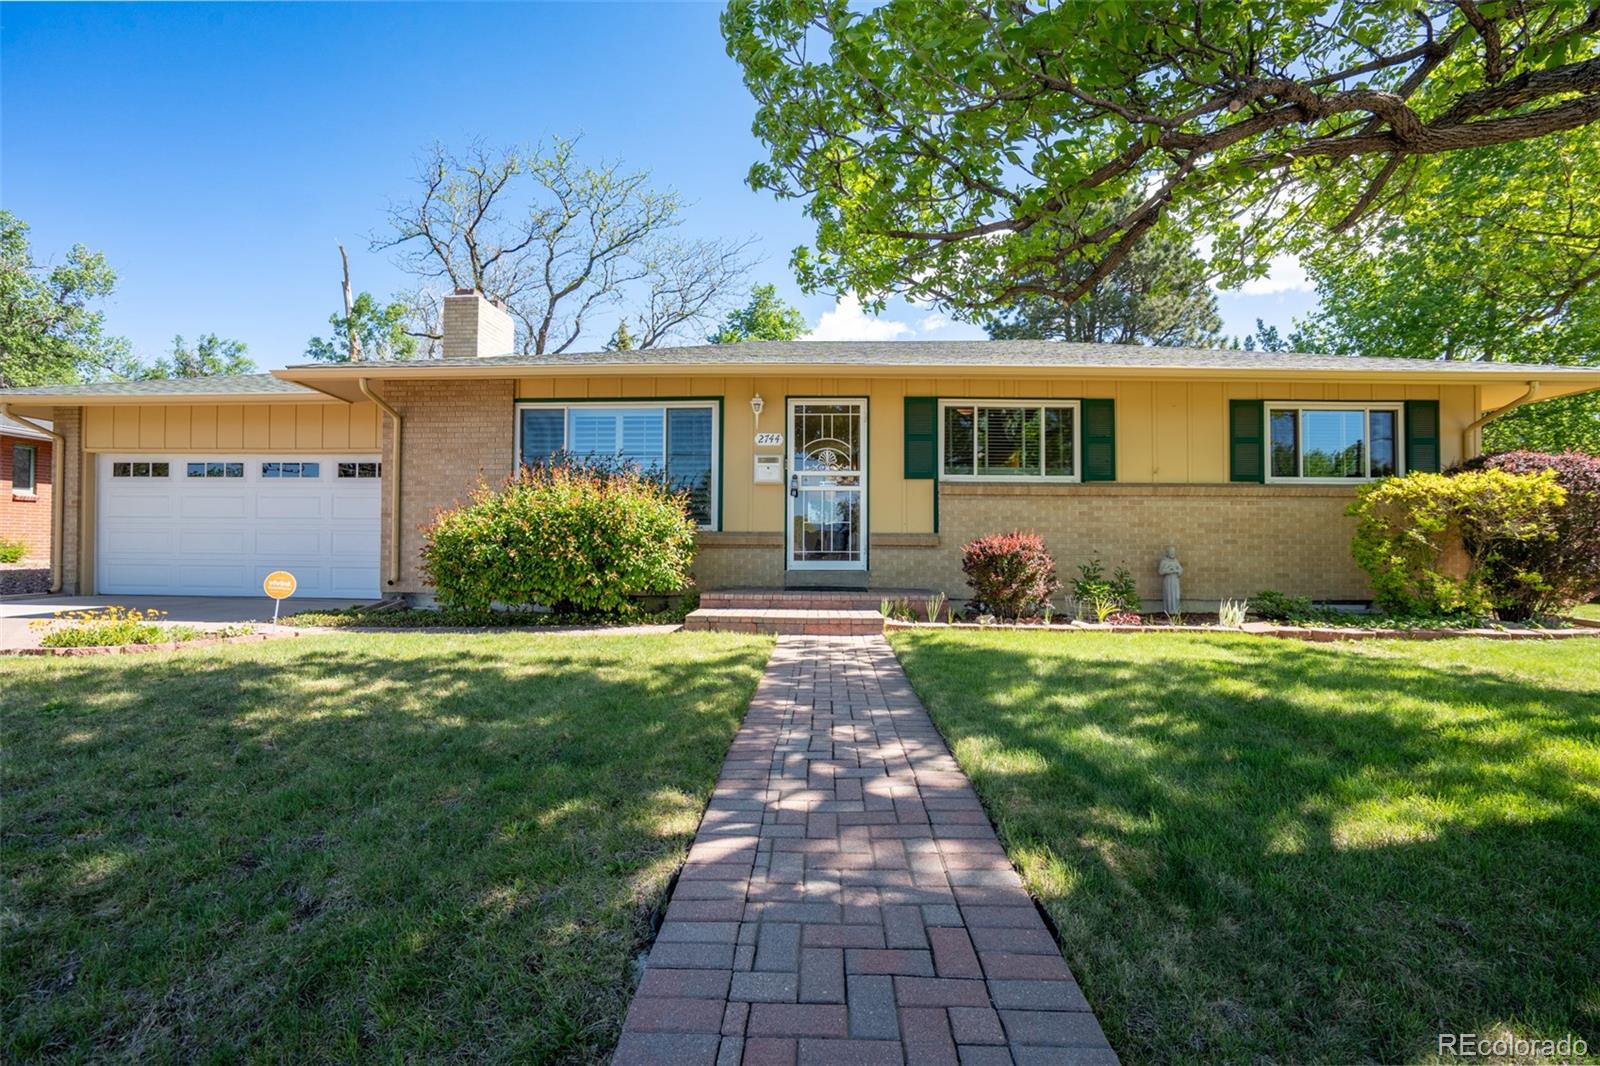
Active under contract
$599,000
4
bds
|
3
ba
|
1,261
sqft
|
built
1956
2744 S Newton Way, Denver, CO 80236
$-1,398
Cash flow
-12.2%
Cash-on-Cash Return
3.5%
Cap rate
0.5%
Rent to Value Ratio
Active
$585,000
3
bds
|
2
ba
|
1,349
sqft
|
built
1901
800 S Krameria St, Denver, CO 80224
$-1,181
Cash flow
-10.5%
Cash-on-Cash Return
3.9%
Cap rate
0.5%
Rent to Value Ratio
Active
$475,000
3
bds
|
2
ba
|
904
sqft
|
built
1942
1740 Trenton St, Denver, CO 80220
$-1,130
Cash flow
-12.4%
Cash-on-Cash Return
3.4%
Cap rate
0.5%
Rent to Value Ratio
Active
$620,000
3
bds
|
3
ba
|
1,760
sqft
|
built
1983
3235 S Newland St, Denver, CO 80227
$-1,270
Cash flow
-10.7%
Cash-on-Cash Return
3.8%
Cap rate
0.5%
Rent to Value Ratio
Active
$770,000
4
bds
|
3
ba
|
2,488
sqft
|
built
2018
9422 E 58th Pl, Denver, CO 80238
$-2,189
Cash flow
-14.8%
Cash-on-Cash Return
2.9%
Cap rate
0.5%
Rent to Value Ratio