Detroit, MI Investment Properties for Sale
Browse homes for sale and investment properties in Detroit, MI. Refine your search by price, property type, or more.
Best cash flowing properties in Detroit, MI
Active
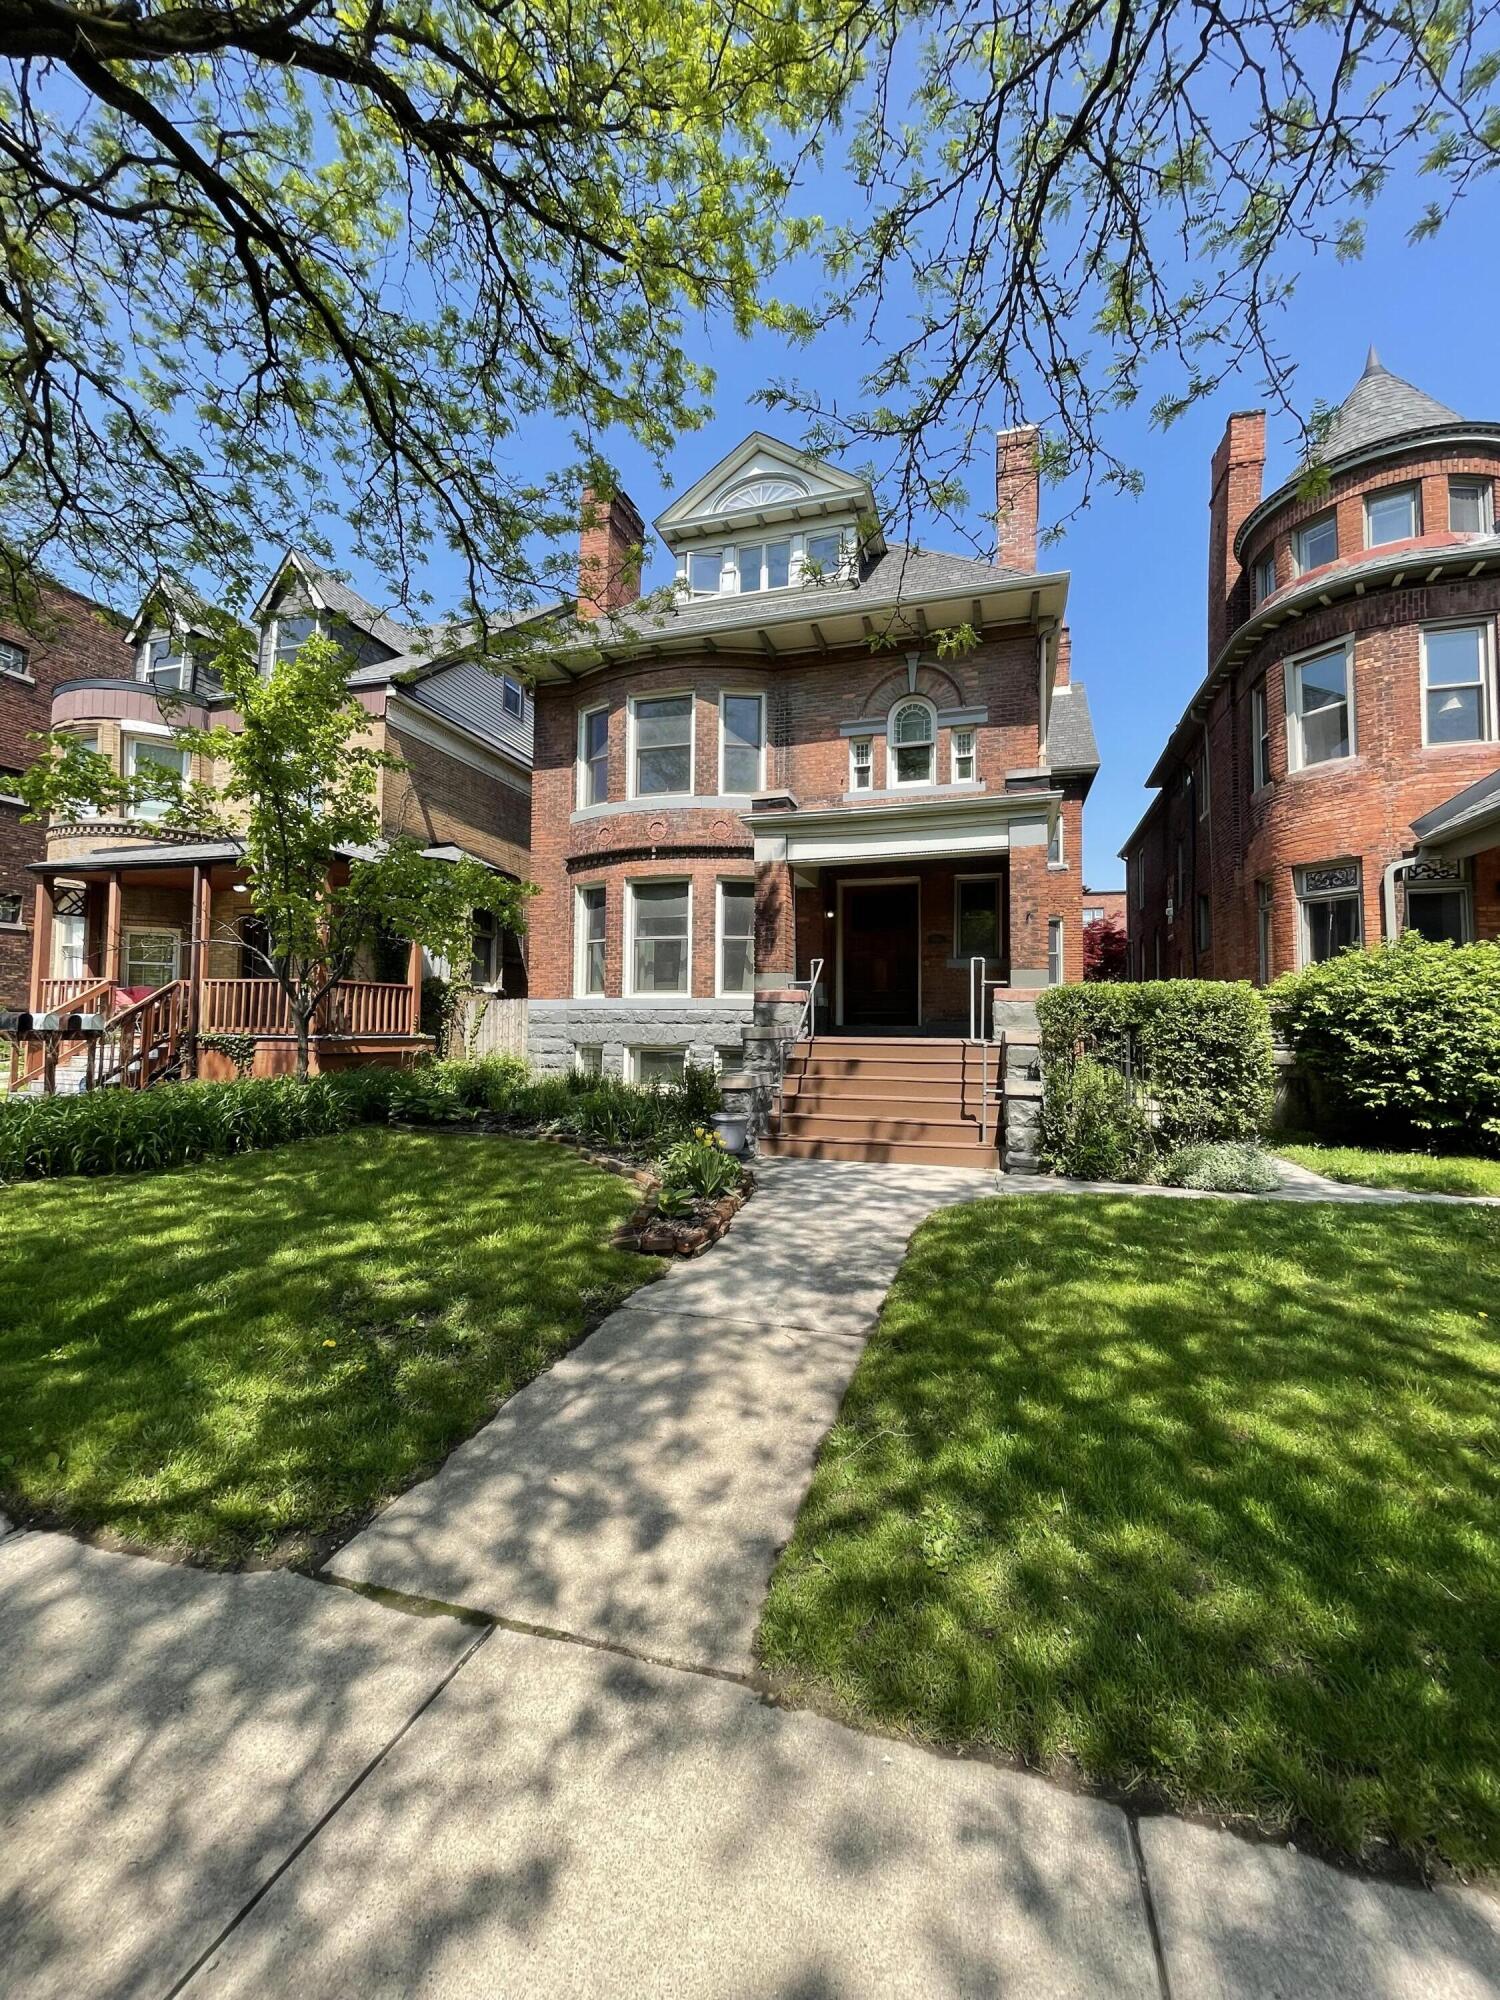
$59,900
4
bds
|
2
ba
|
2,700
sqft
|
built
1913
3771 24th St, Detroit, MI 48208
$1,197
Cash flow
23.3%
Cash-on-Cash Return
24.0%
Cap rate
3.0%
Rent to Value Ratio
Active
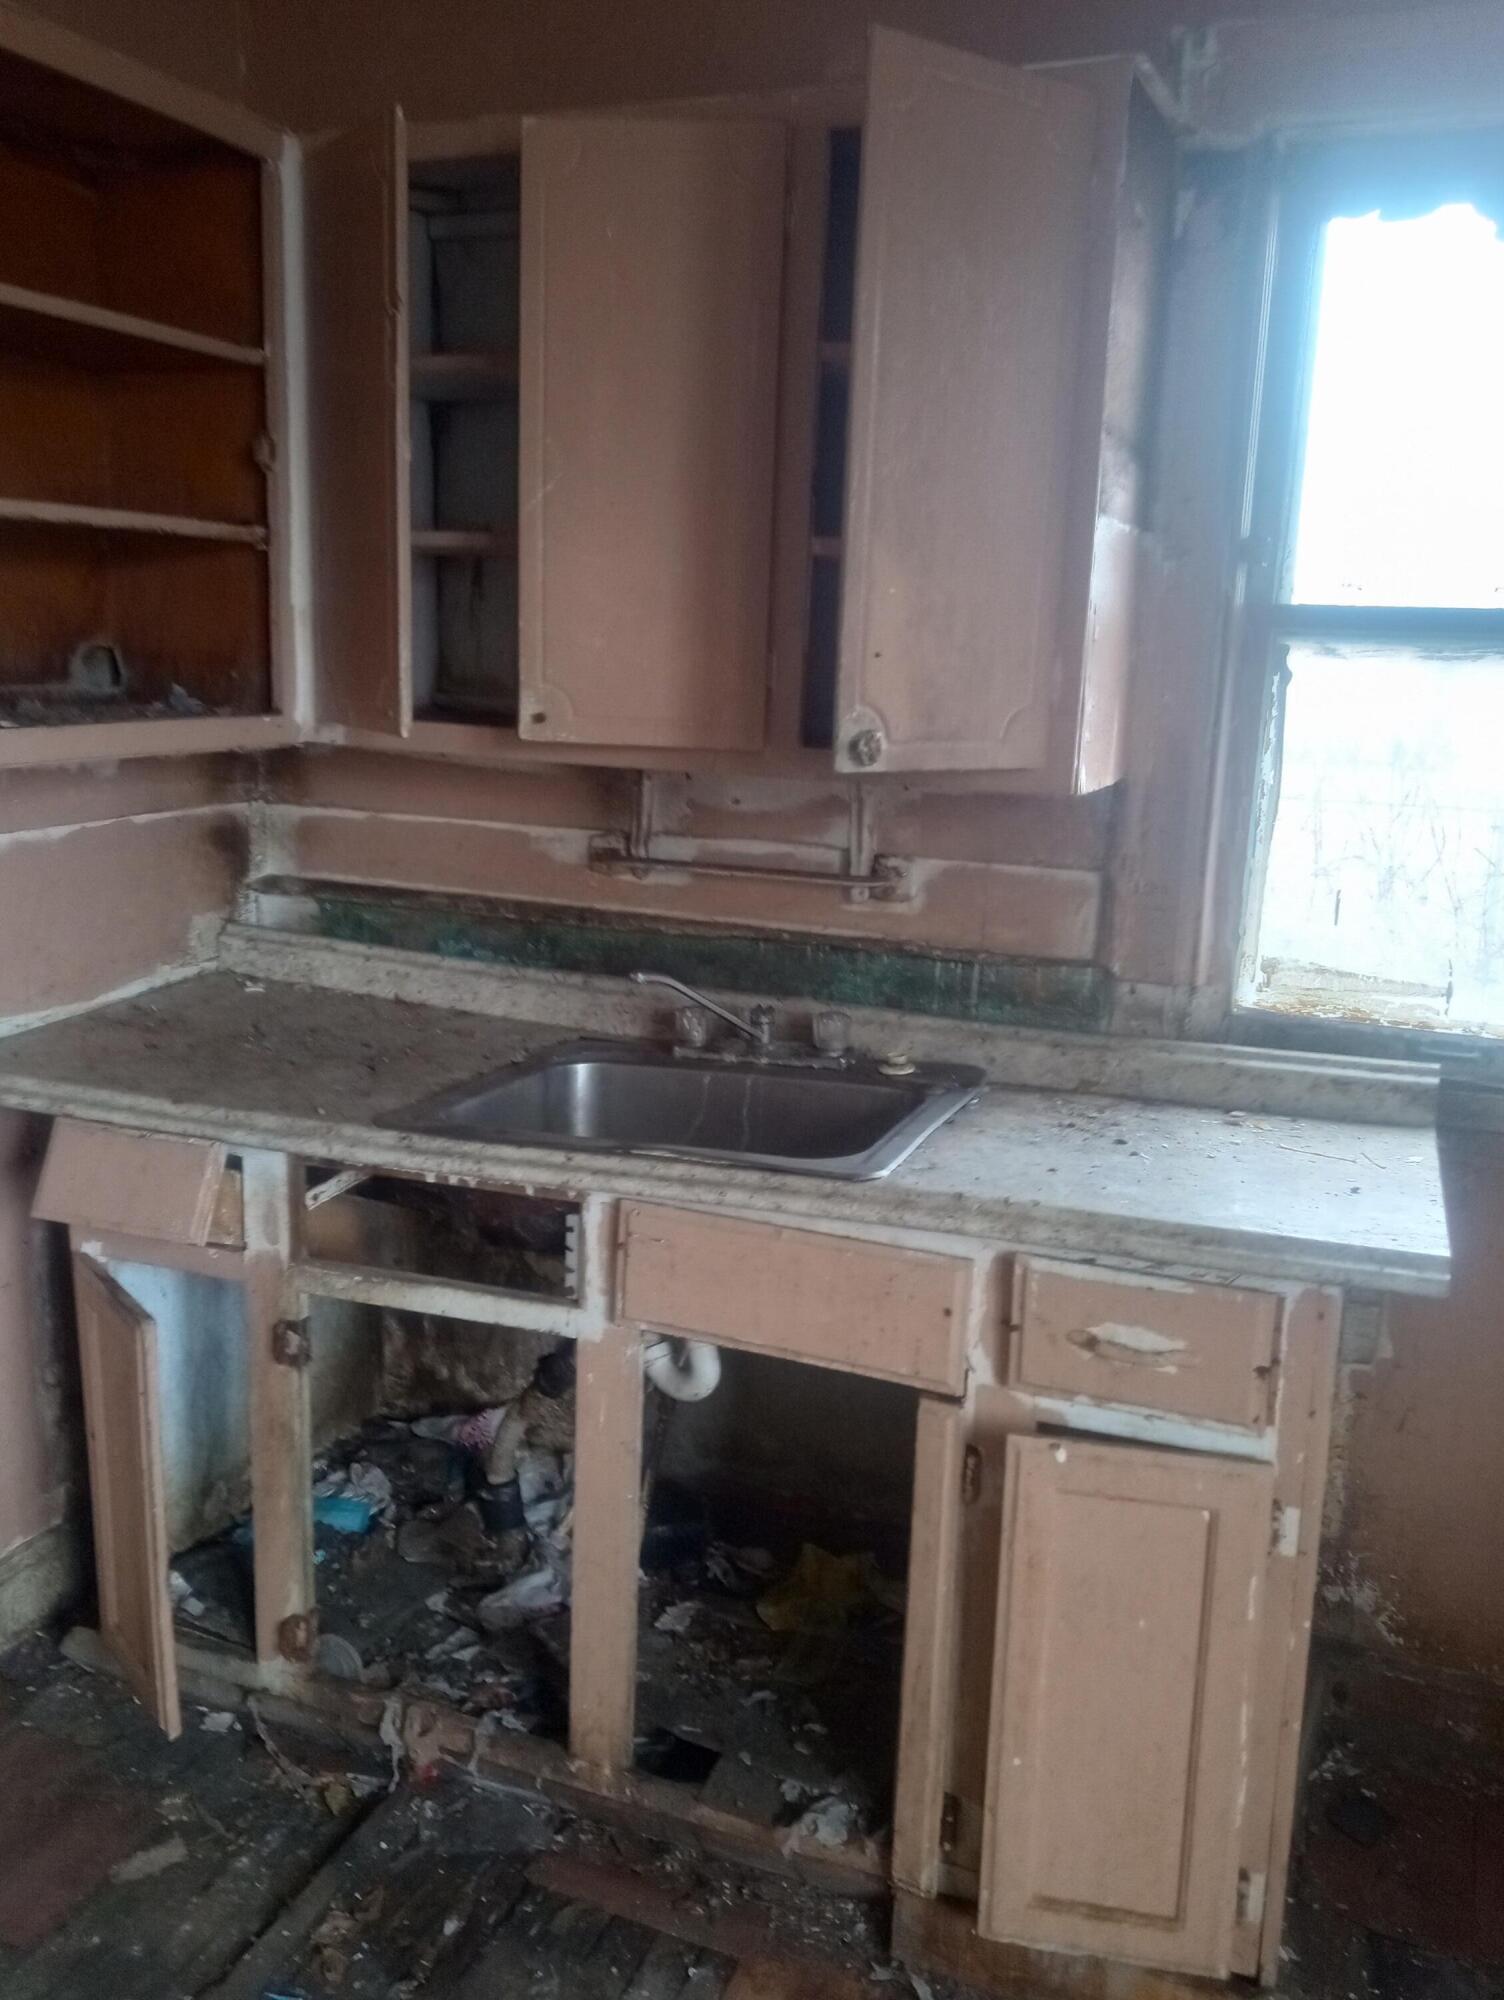
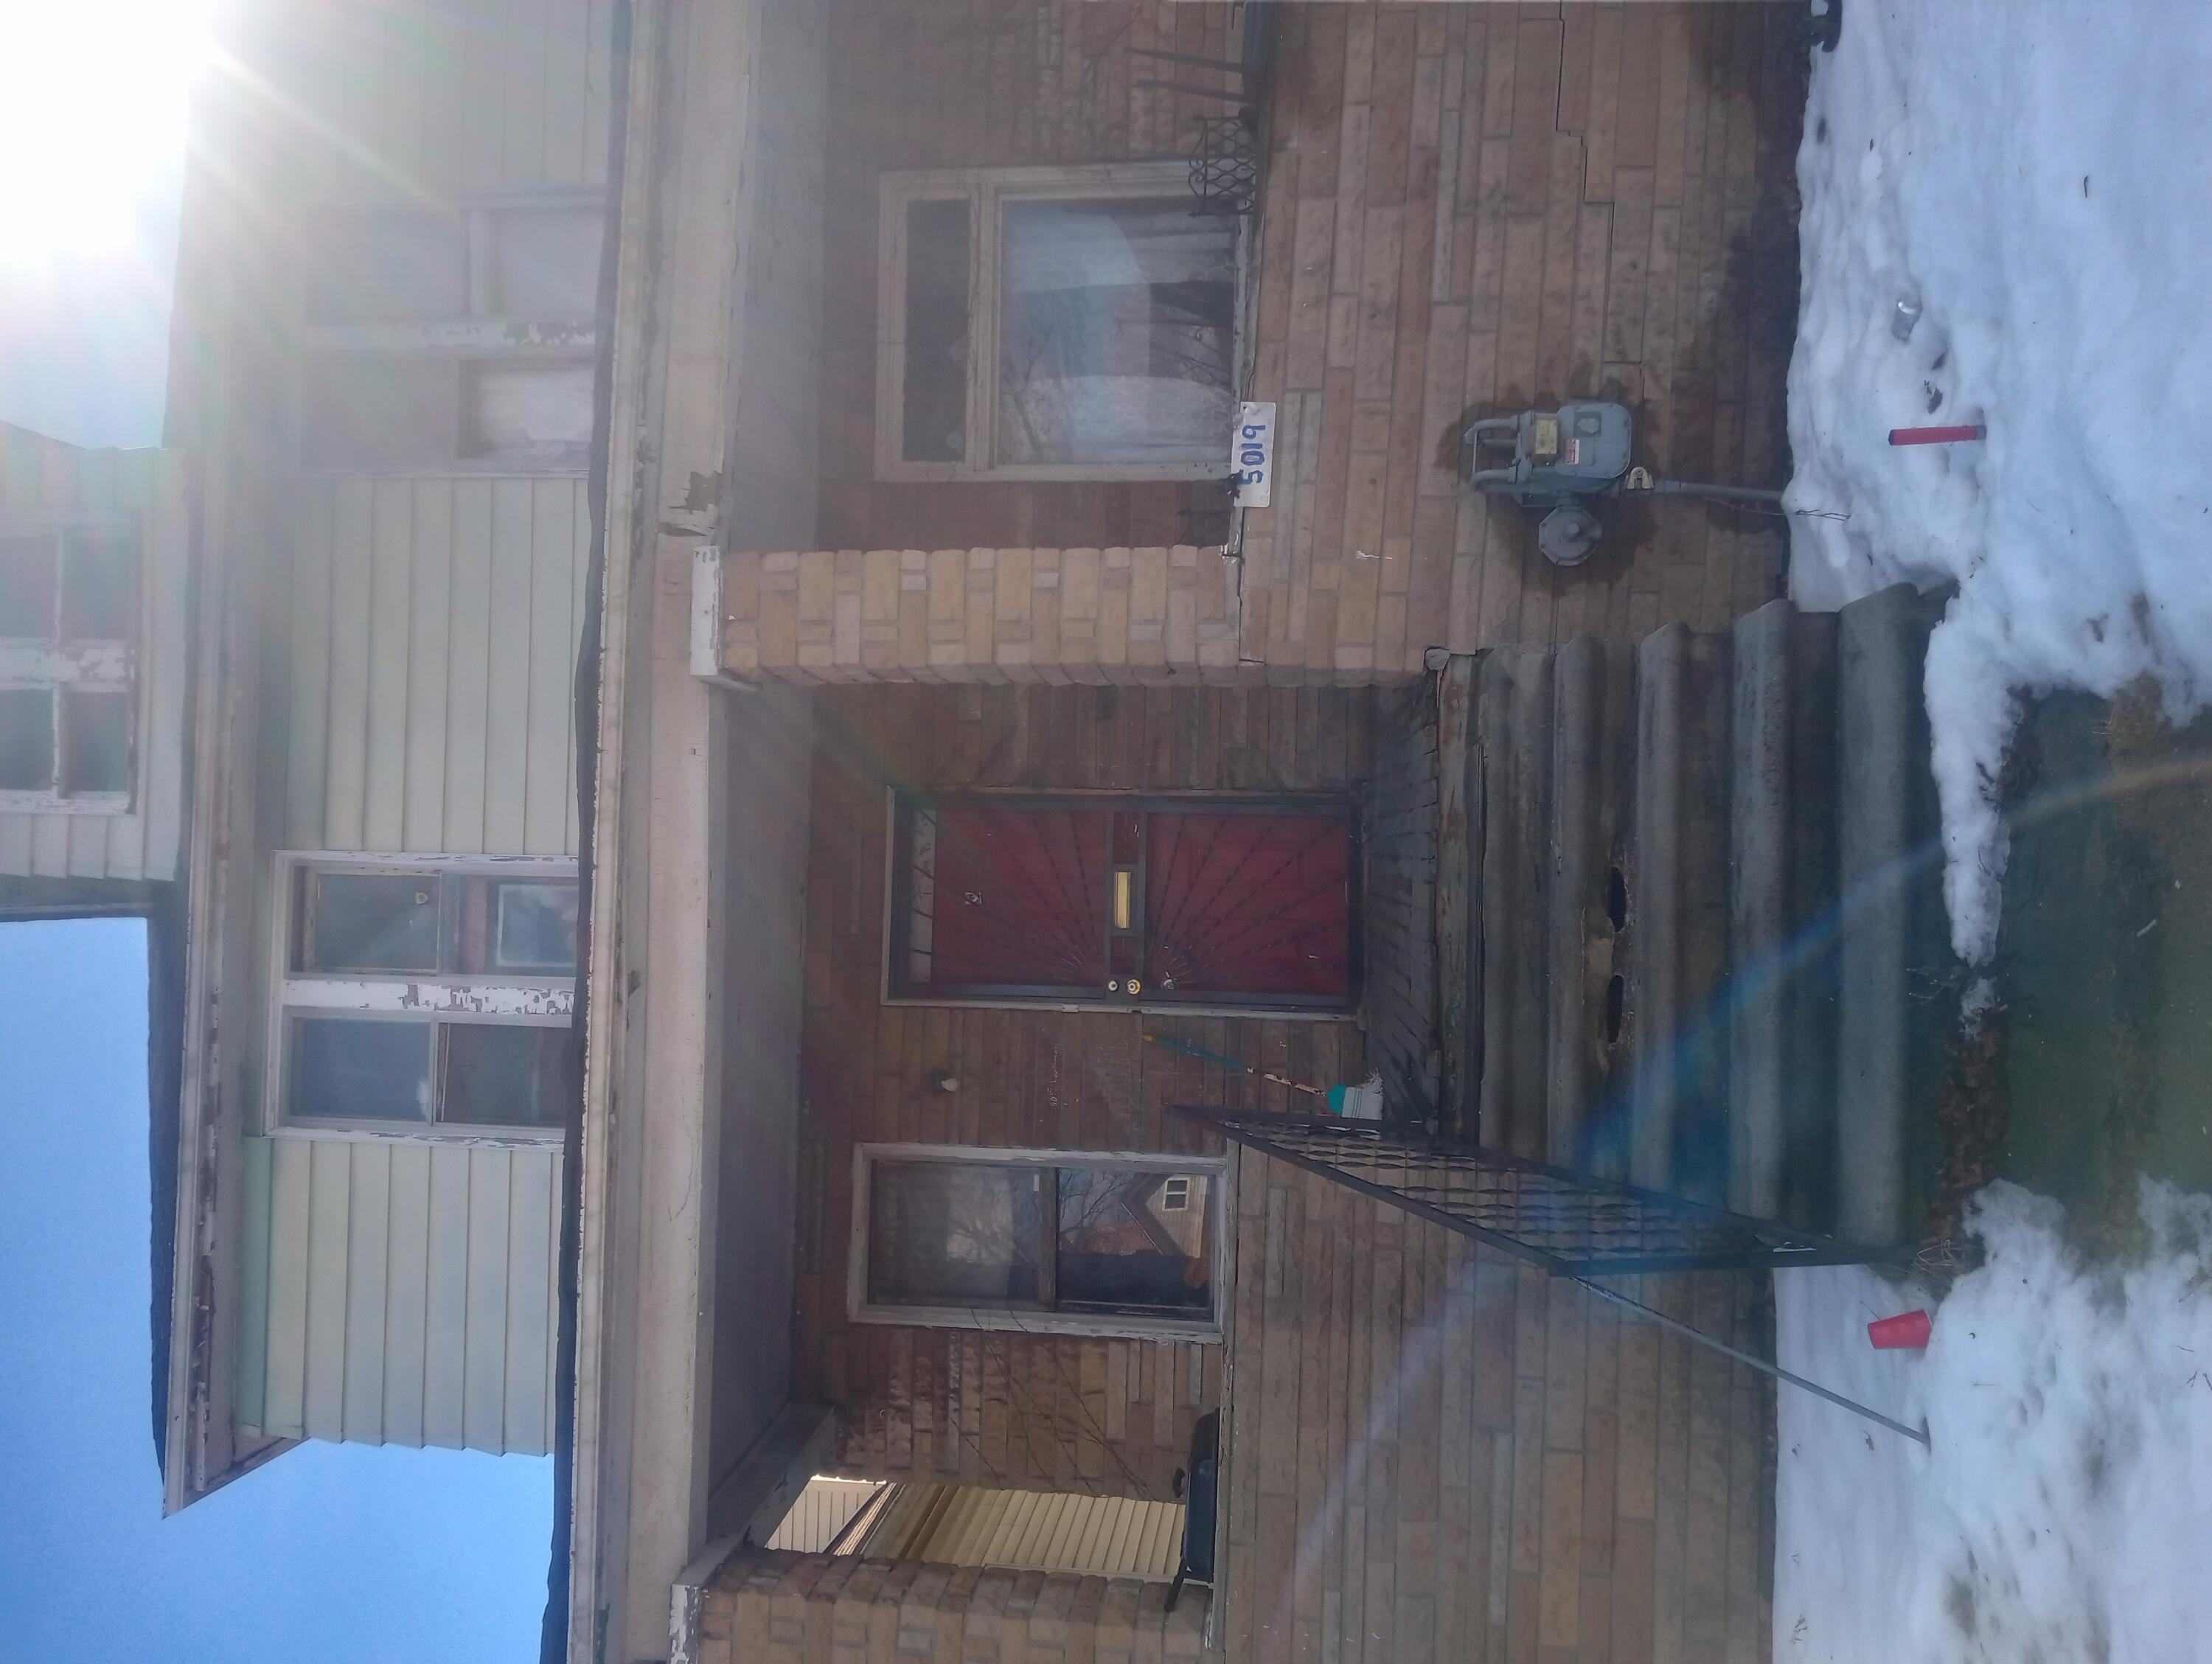
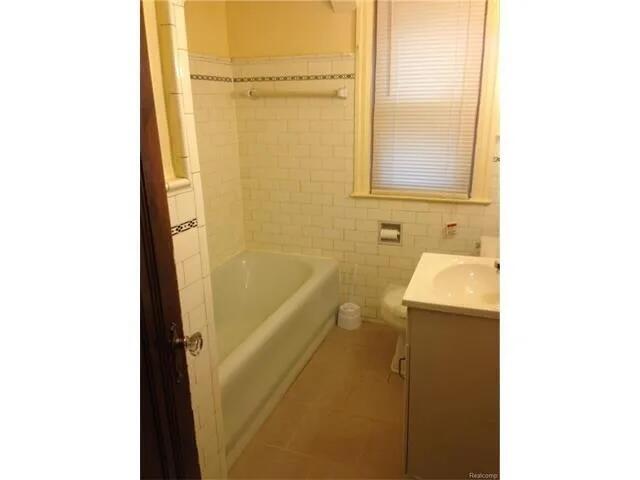
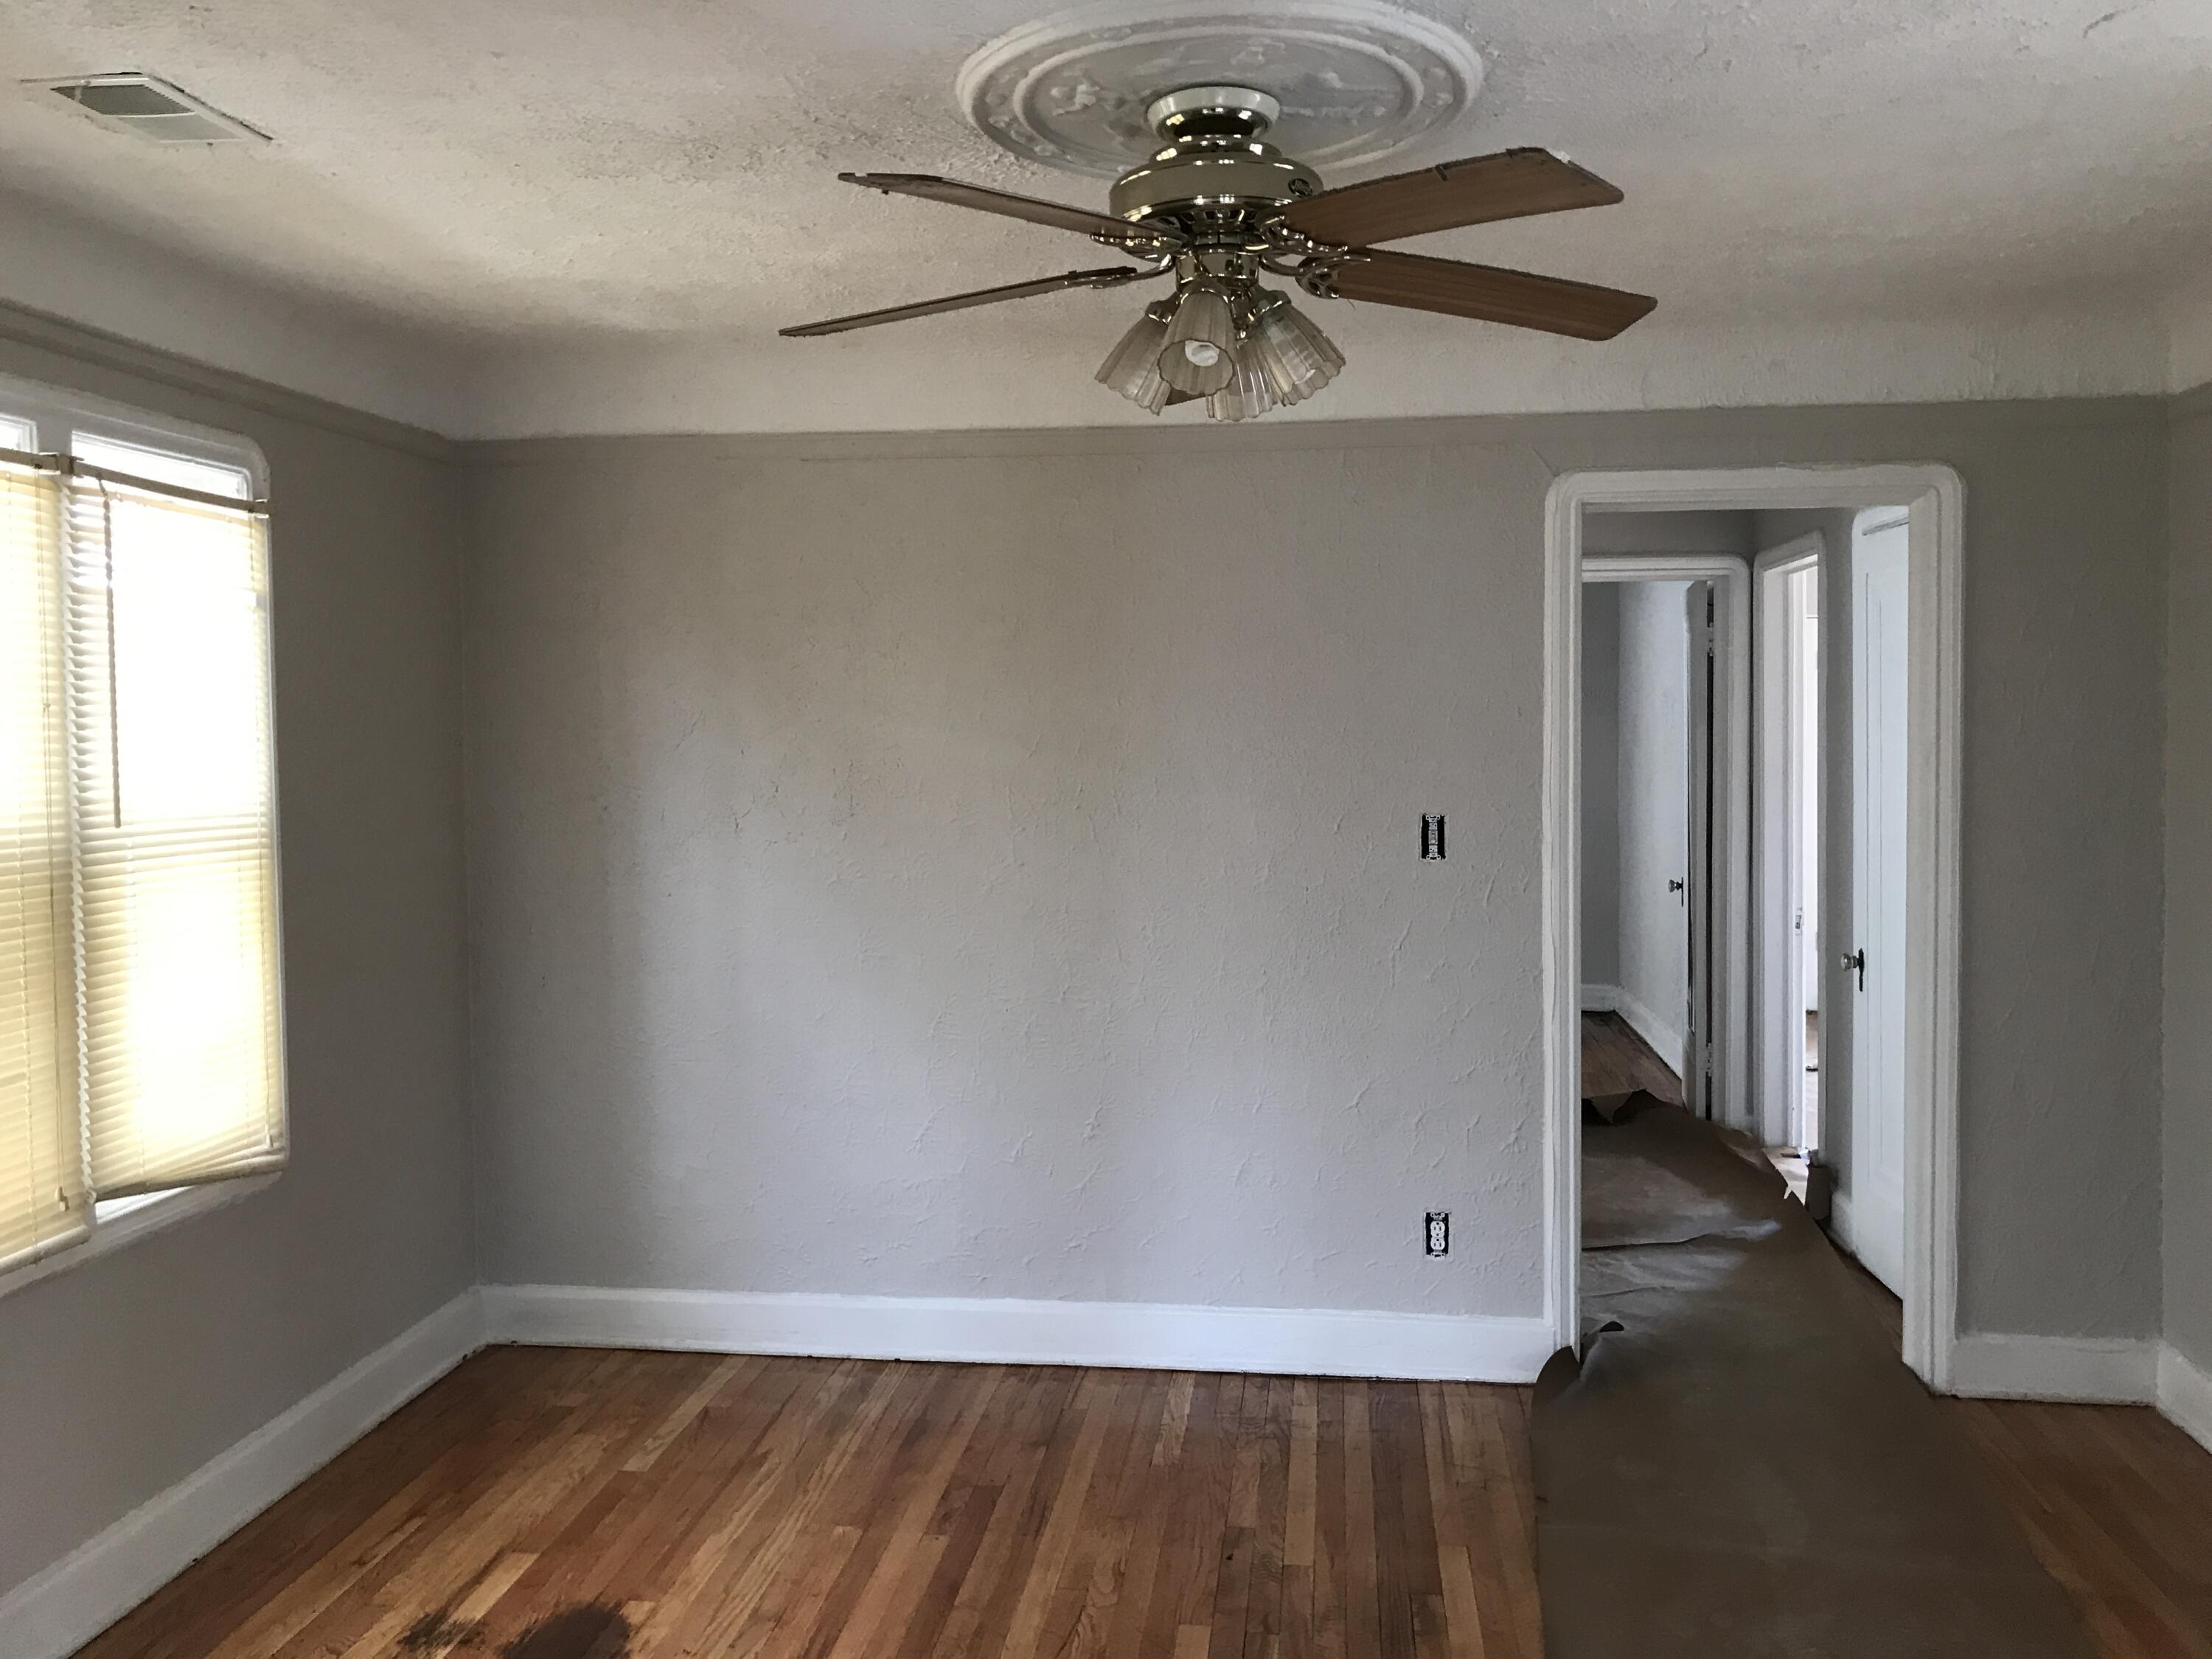
$49,000
3
bds
|
1
ba
|
900
sqft
|
built
1912
5019 Larchmont St, Detroit, MI 48204
$1,170
Cash flow
27.8%
Cash-on-Cash Return
28.7%
Cap rate
3.7%
Rent to Value Ratio
240 out of 250 properties for sale in Detroit, MI
Limited Results Shown
Create a free account, or log in to reveal all property listings and enjoy the complete experience.
Active
$190,000
bds
|
0
ba
|
0
sqft
|
built
1928
17214 Roselawn St, Detroit, MI 48221
$-160
Cash flow
-4.4%
Cash-on-Cash Return
5.1%
Cap rate
0.7%
Rent to Value Ratio
Active
$133,000
bds
|
0
ba
|
0
sqft
|
built
1928
16542 Indiana St, Detroit, MI 48221
$-57
Cash flow
-2.2%
Cash-on-Cash Return
5.6%
Cap rate
0.8%
Rent to Value Ratio

Active
$49,000
2
bds
|
3
ba
|
1,834
sqft
|
built
1923
13417 Tacoma St, Detroit, MI 48205
$786
Cash flow
18.7%
Cash-on-Cash Return
19.2%
Cap rate
2.4%
Rent to Value Ratio
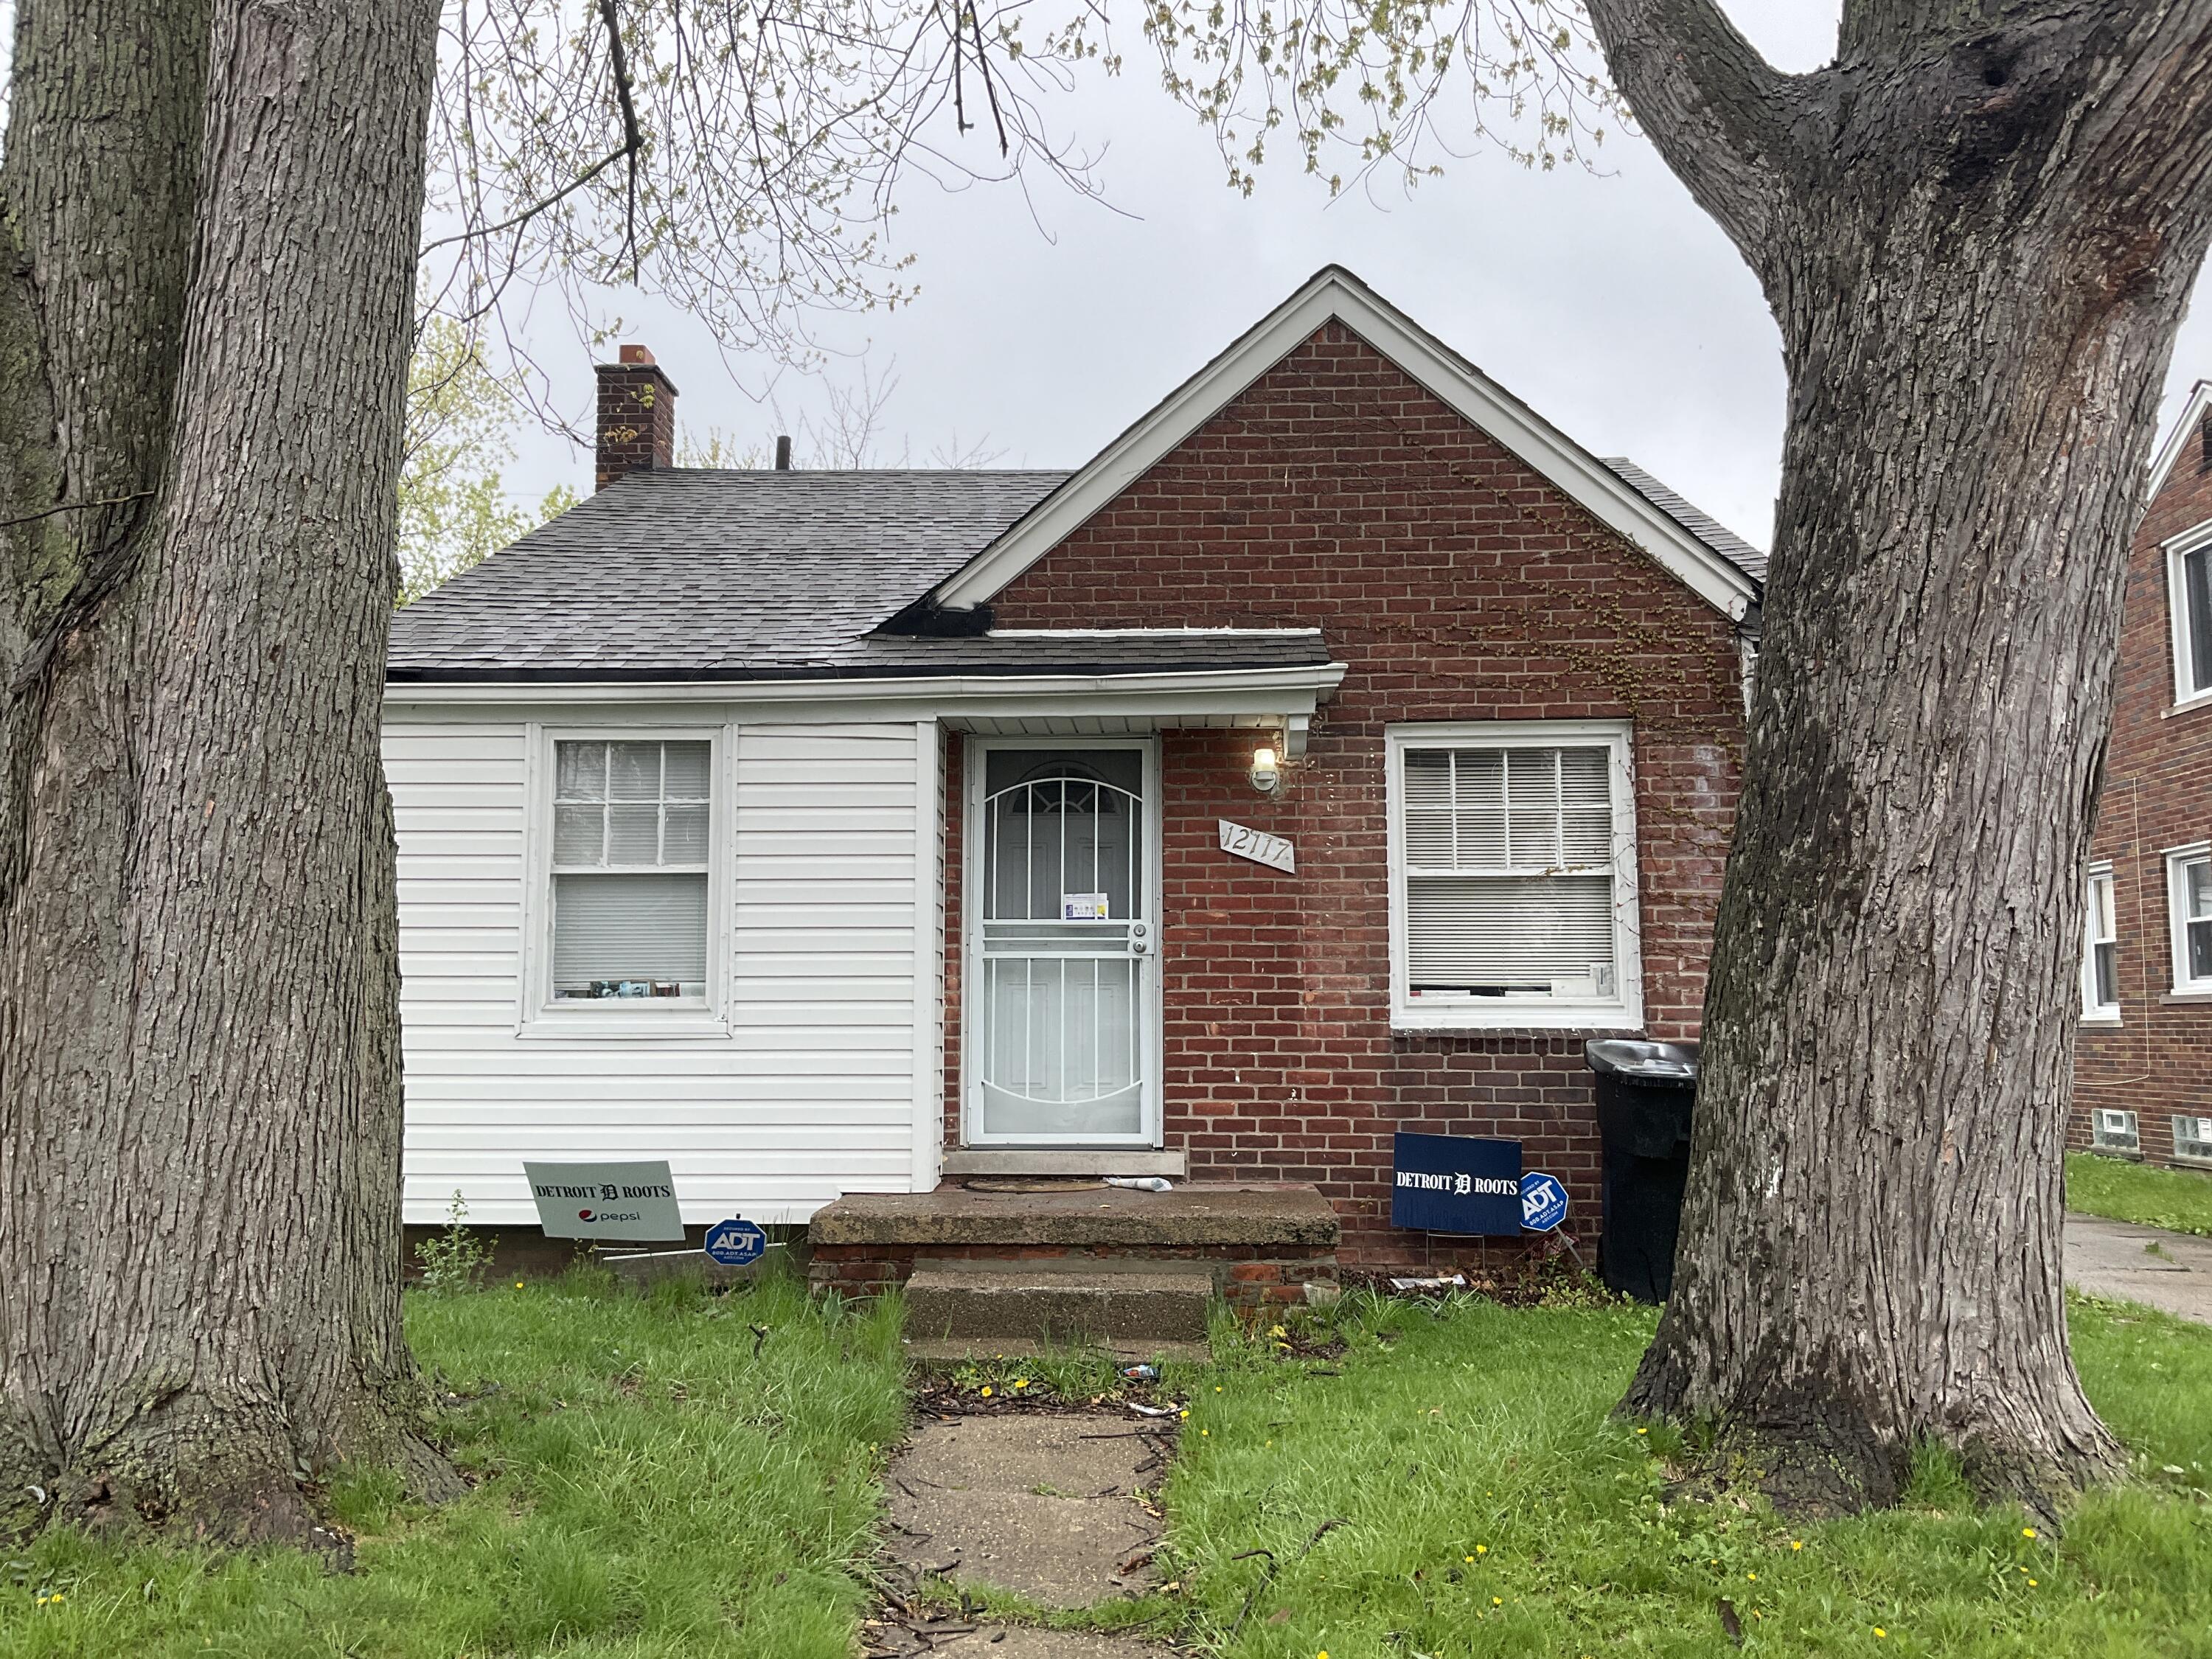
Active
$72,000
2
bds
|
1
ba
|
1,470
sqft
|
built
1945
12117 Laing St, Detroit, MI 48224
$700
Cash flow
11.3%
Cash-on-Cash Return
11.7%
Cap rate
1.7%
Rent to Value Ratio
Active
$48,000
1
bds
|
1
ba
|
0
sqft
|
built
1957
17274 Bentler St, Detroit, MI 48219
$650
Cash flow
15.8%
Cash-on-Cash Return
16.3%
Cap rate
2.3%
Rent to Value Ratio
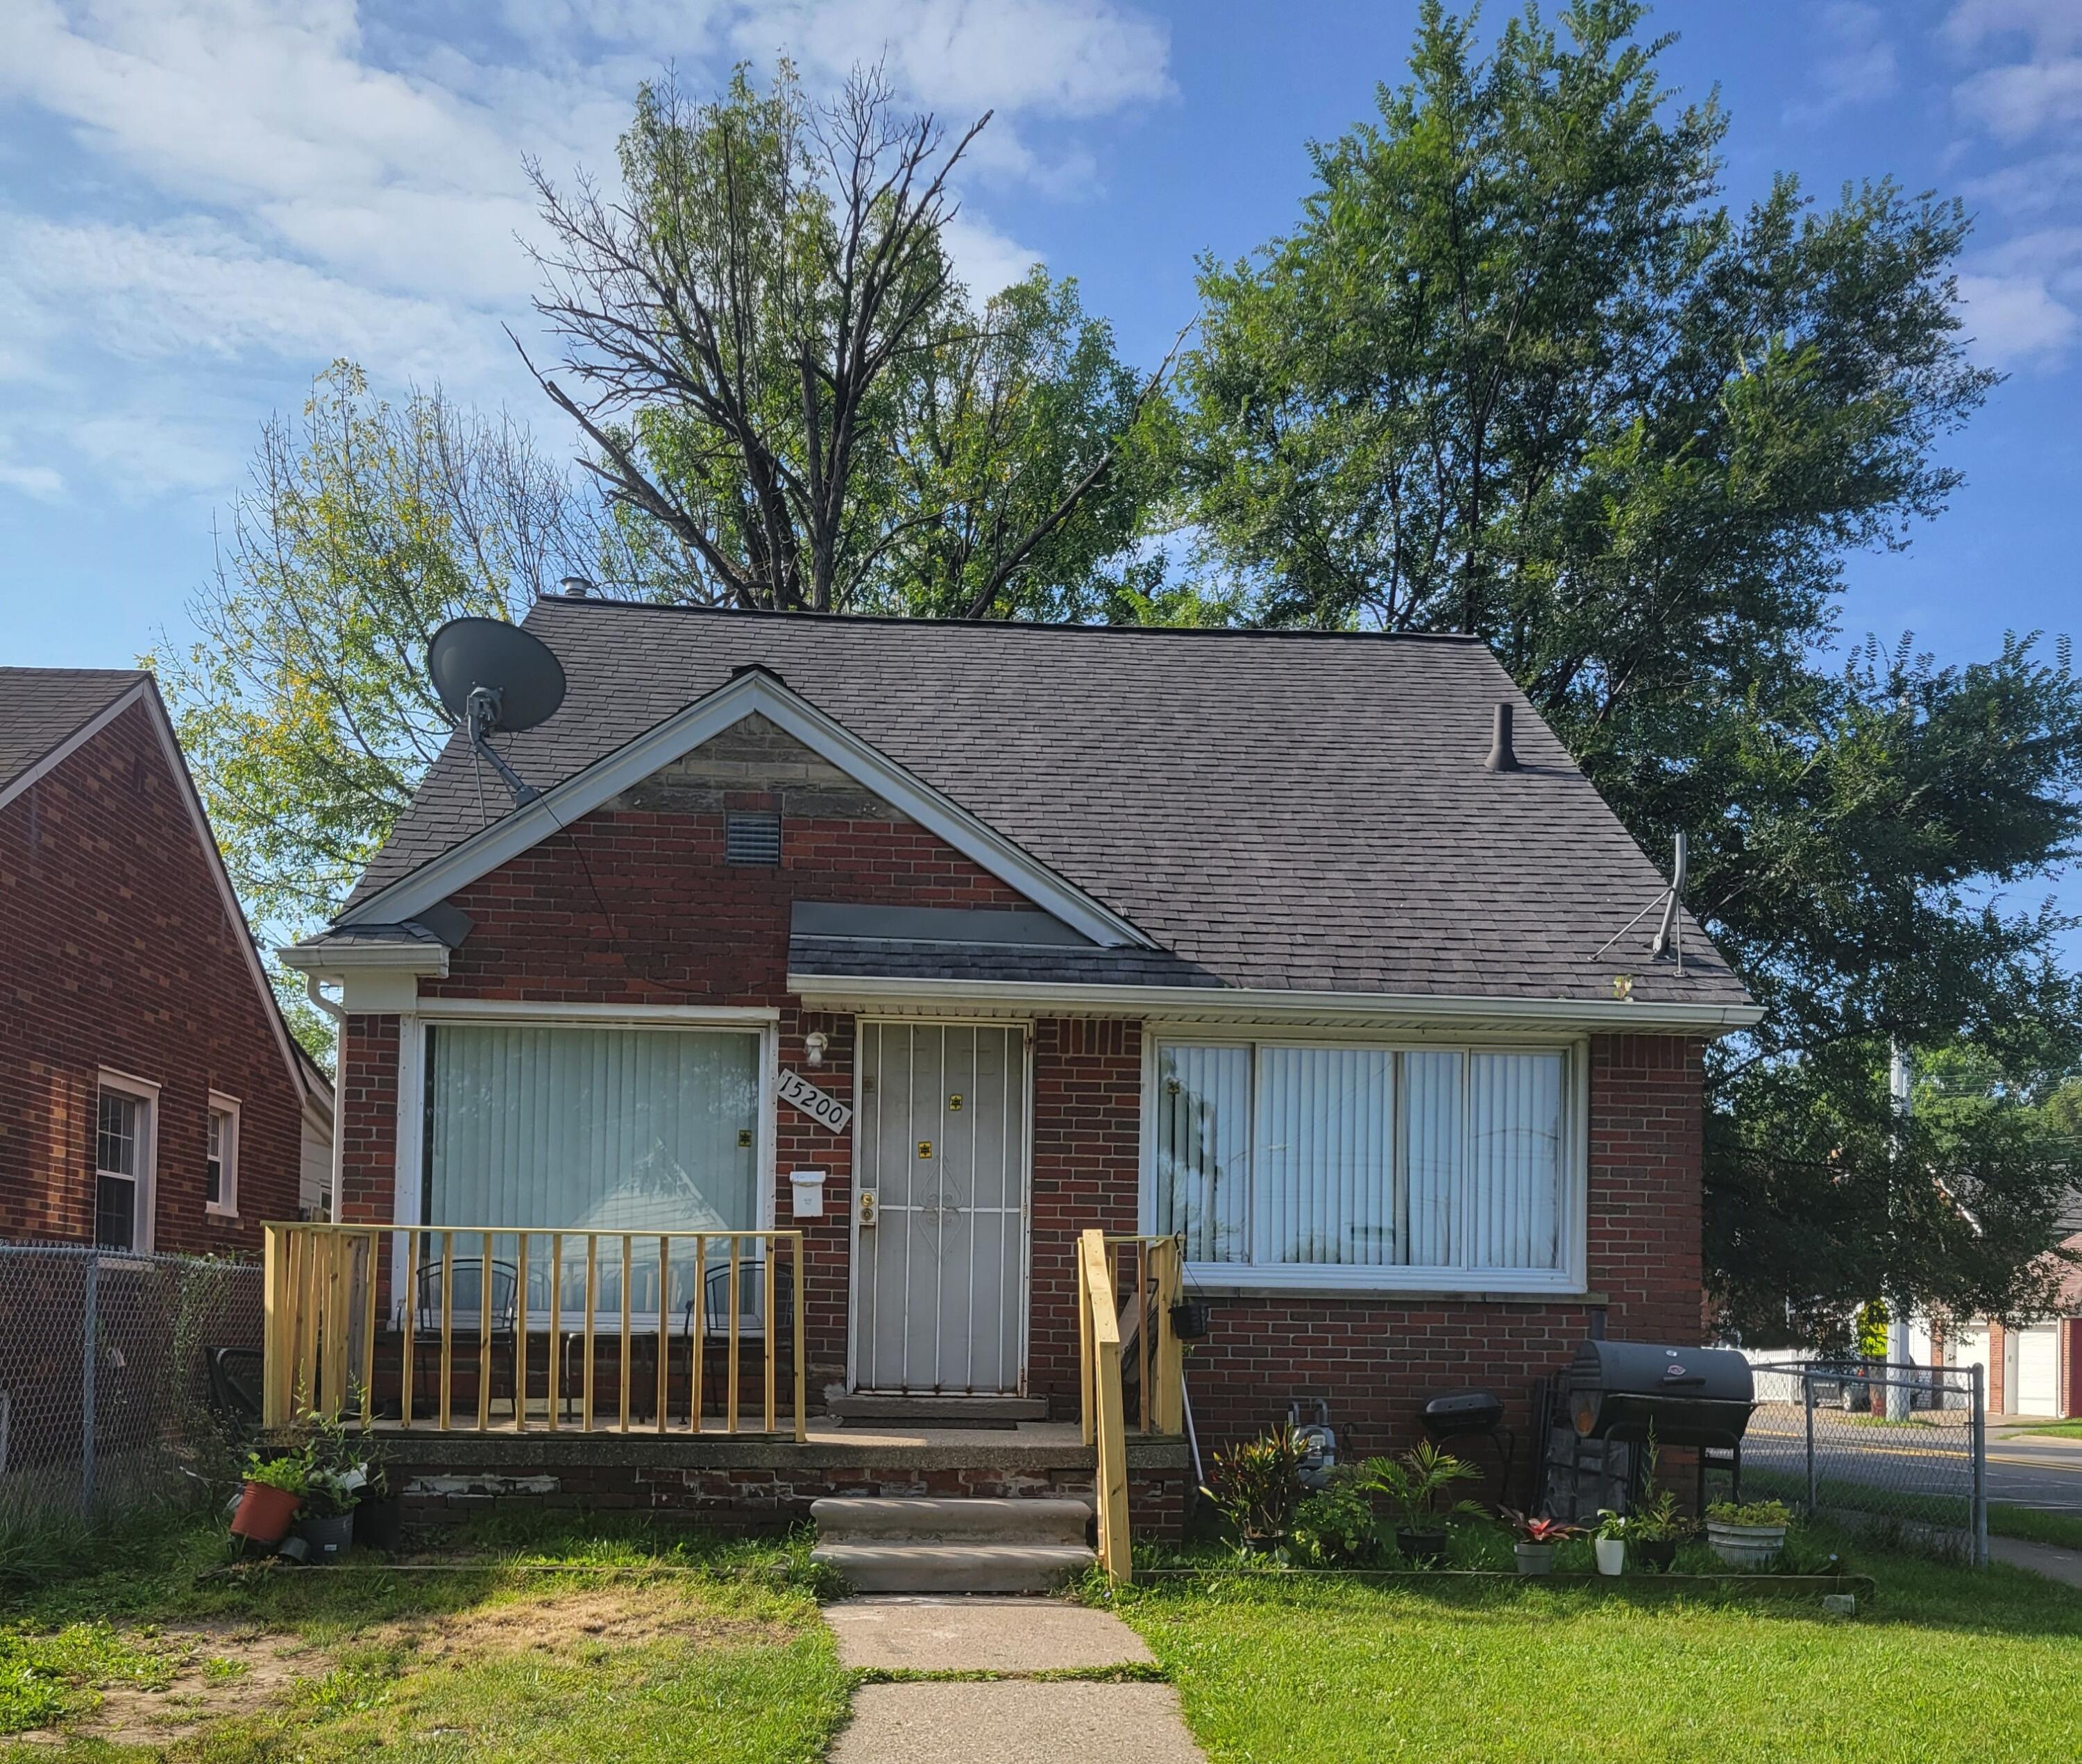
Active
$60,000
3
bds
|
1
ba
|
1,680
sqft
|
built
1952
15200 Rossini Dr, Detroit, MI 48205
$829
Cash flow
16.1%
Cash-on-Cash Return
16.6%
Cap rate
2.2%
Rent to Value Ratio

Active
$98,000
3
bds
|
1
ba
|
0
sqft
|
built
1942
10800 Somerset Ave, Detroit, MI 48224
$163
Cash flow
8.7%
Cash-on-Cash Return
8.1%
Cap rate
1.3%
Rent to Value Ratio
Active
$99,000
3
bds
|
1
ba
|
1,107
sqft
|
built
1948
11368 Pierson St, Detroit, MI 48228
$275
Cash flow
14.5%
Cash-on-Cash Return
9.5%
Cap rate
1.3%
Rent to Value Ratio
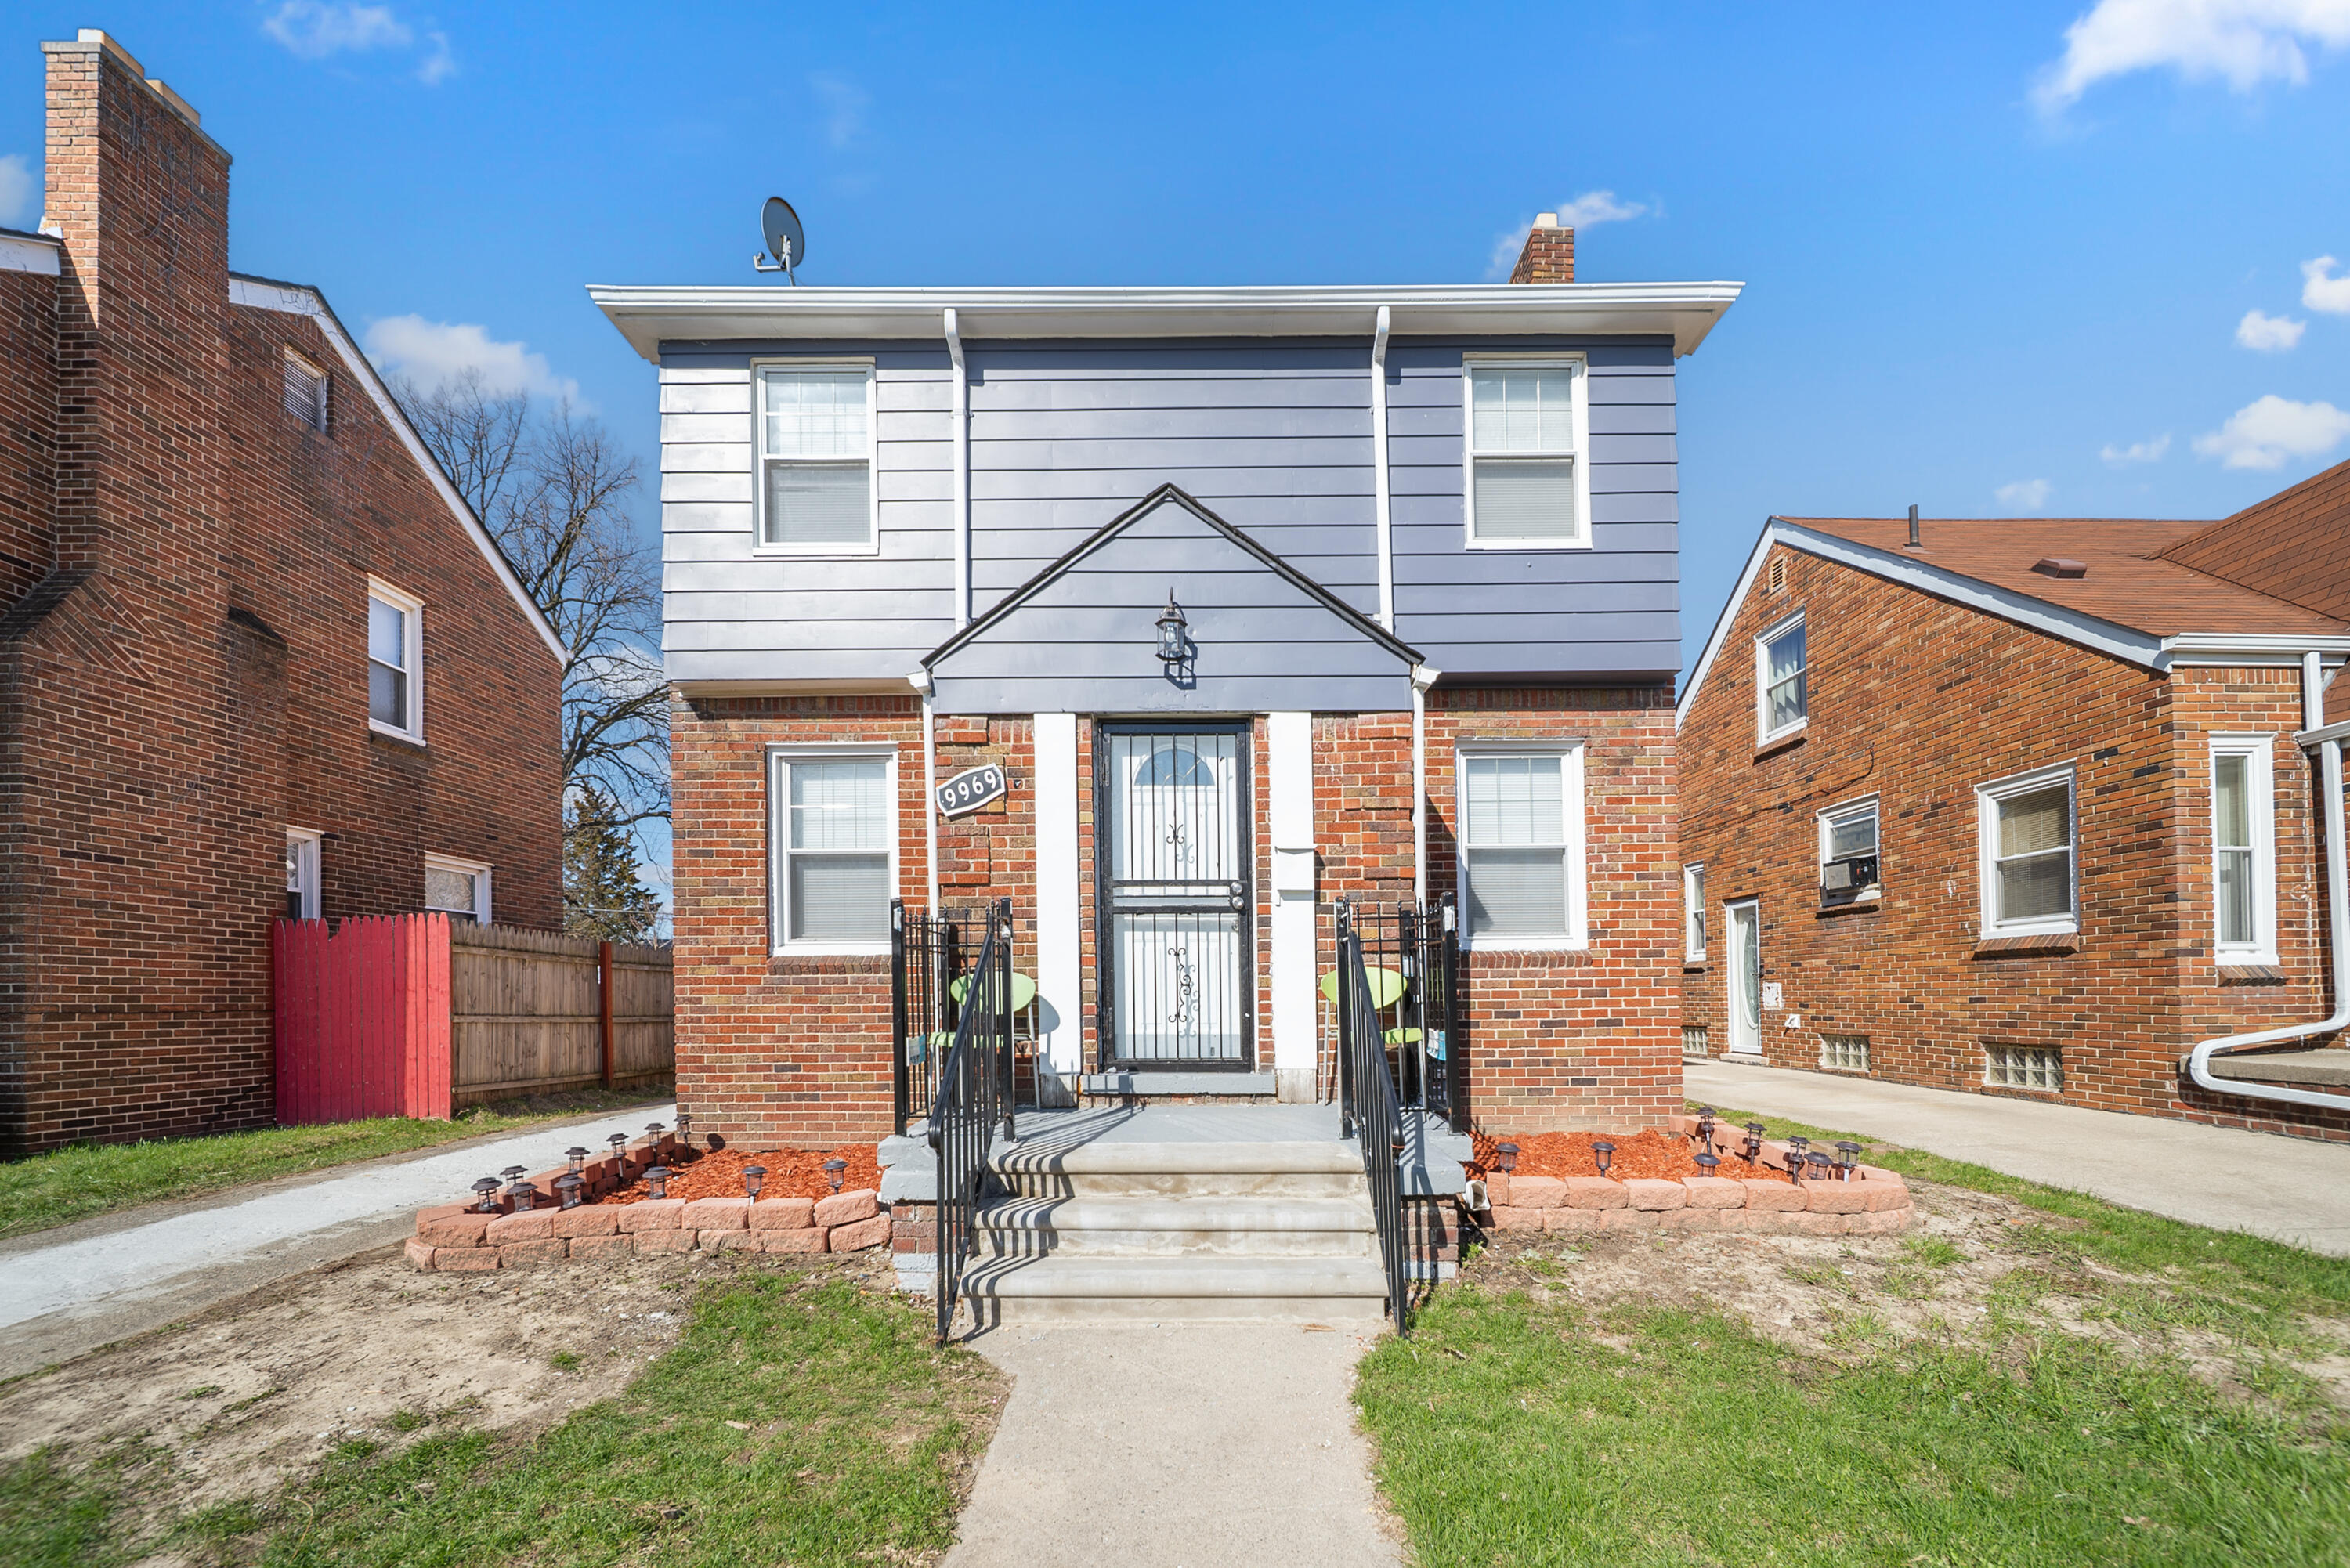
Active
$124,999
2
bds
|
1
ba
|
1,038
sqft
|
built
1937
9969 Robson St, Detroit, MI 48227
$82
Cash flow
3.4%
Cash-on-Cash Return
6.9%
Cap rate
1.0%
Rent to Value Ratio
Active
$155,000
3
bds
|
1
ba
|
1,440
sqft
|
built
1936
16575 Mendota St, Detroit, MI 48221
$211
Cash flow
7.1%
Cash-on-Cash Return
7.8%
Cap rate
1.0%
Rent to Value Ratio
Active
$355,000
5
bds
|
2
ba
|
2,500
sqft
|
built
1915
250 Alger St, Detroit, MI 48202
$-787
Cash flow
-11.6%
Cash-on-Cash Return
3.5%
Cap rate
0.5%
Rent to Value Ratio

Active
$110,000
3
bds
|
2
ba
|
2,250
sqft
|
built
1941
5566 Somerset Ave, Detroit, MI 48224
$203
Cash flow
9.6%
Cash-on-Cash Return
8.4%
Cap rate
1.2%
Rent to Value Ratio

Active
$590,000
3
bds
|
4
ba
|
3,973
sqft
|
built
1951
14511 Harbor Is, Detroit, MI 48215
$-756
Cash flow
-6.7%
Cash-on-Cash Return
4.6%
Cap rate
0.7%
Rent to Value Ratio
Active
$79,900
2
bds
|
1
ba
|
765
sqft
|
built
1920
5506 Philip St, Detroit, MI 48224
$164
Cash flow
10.7%
Cash-on-Cash Return
8.6%
Cap rate
1.1%
Rent to Value Ratio
Active
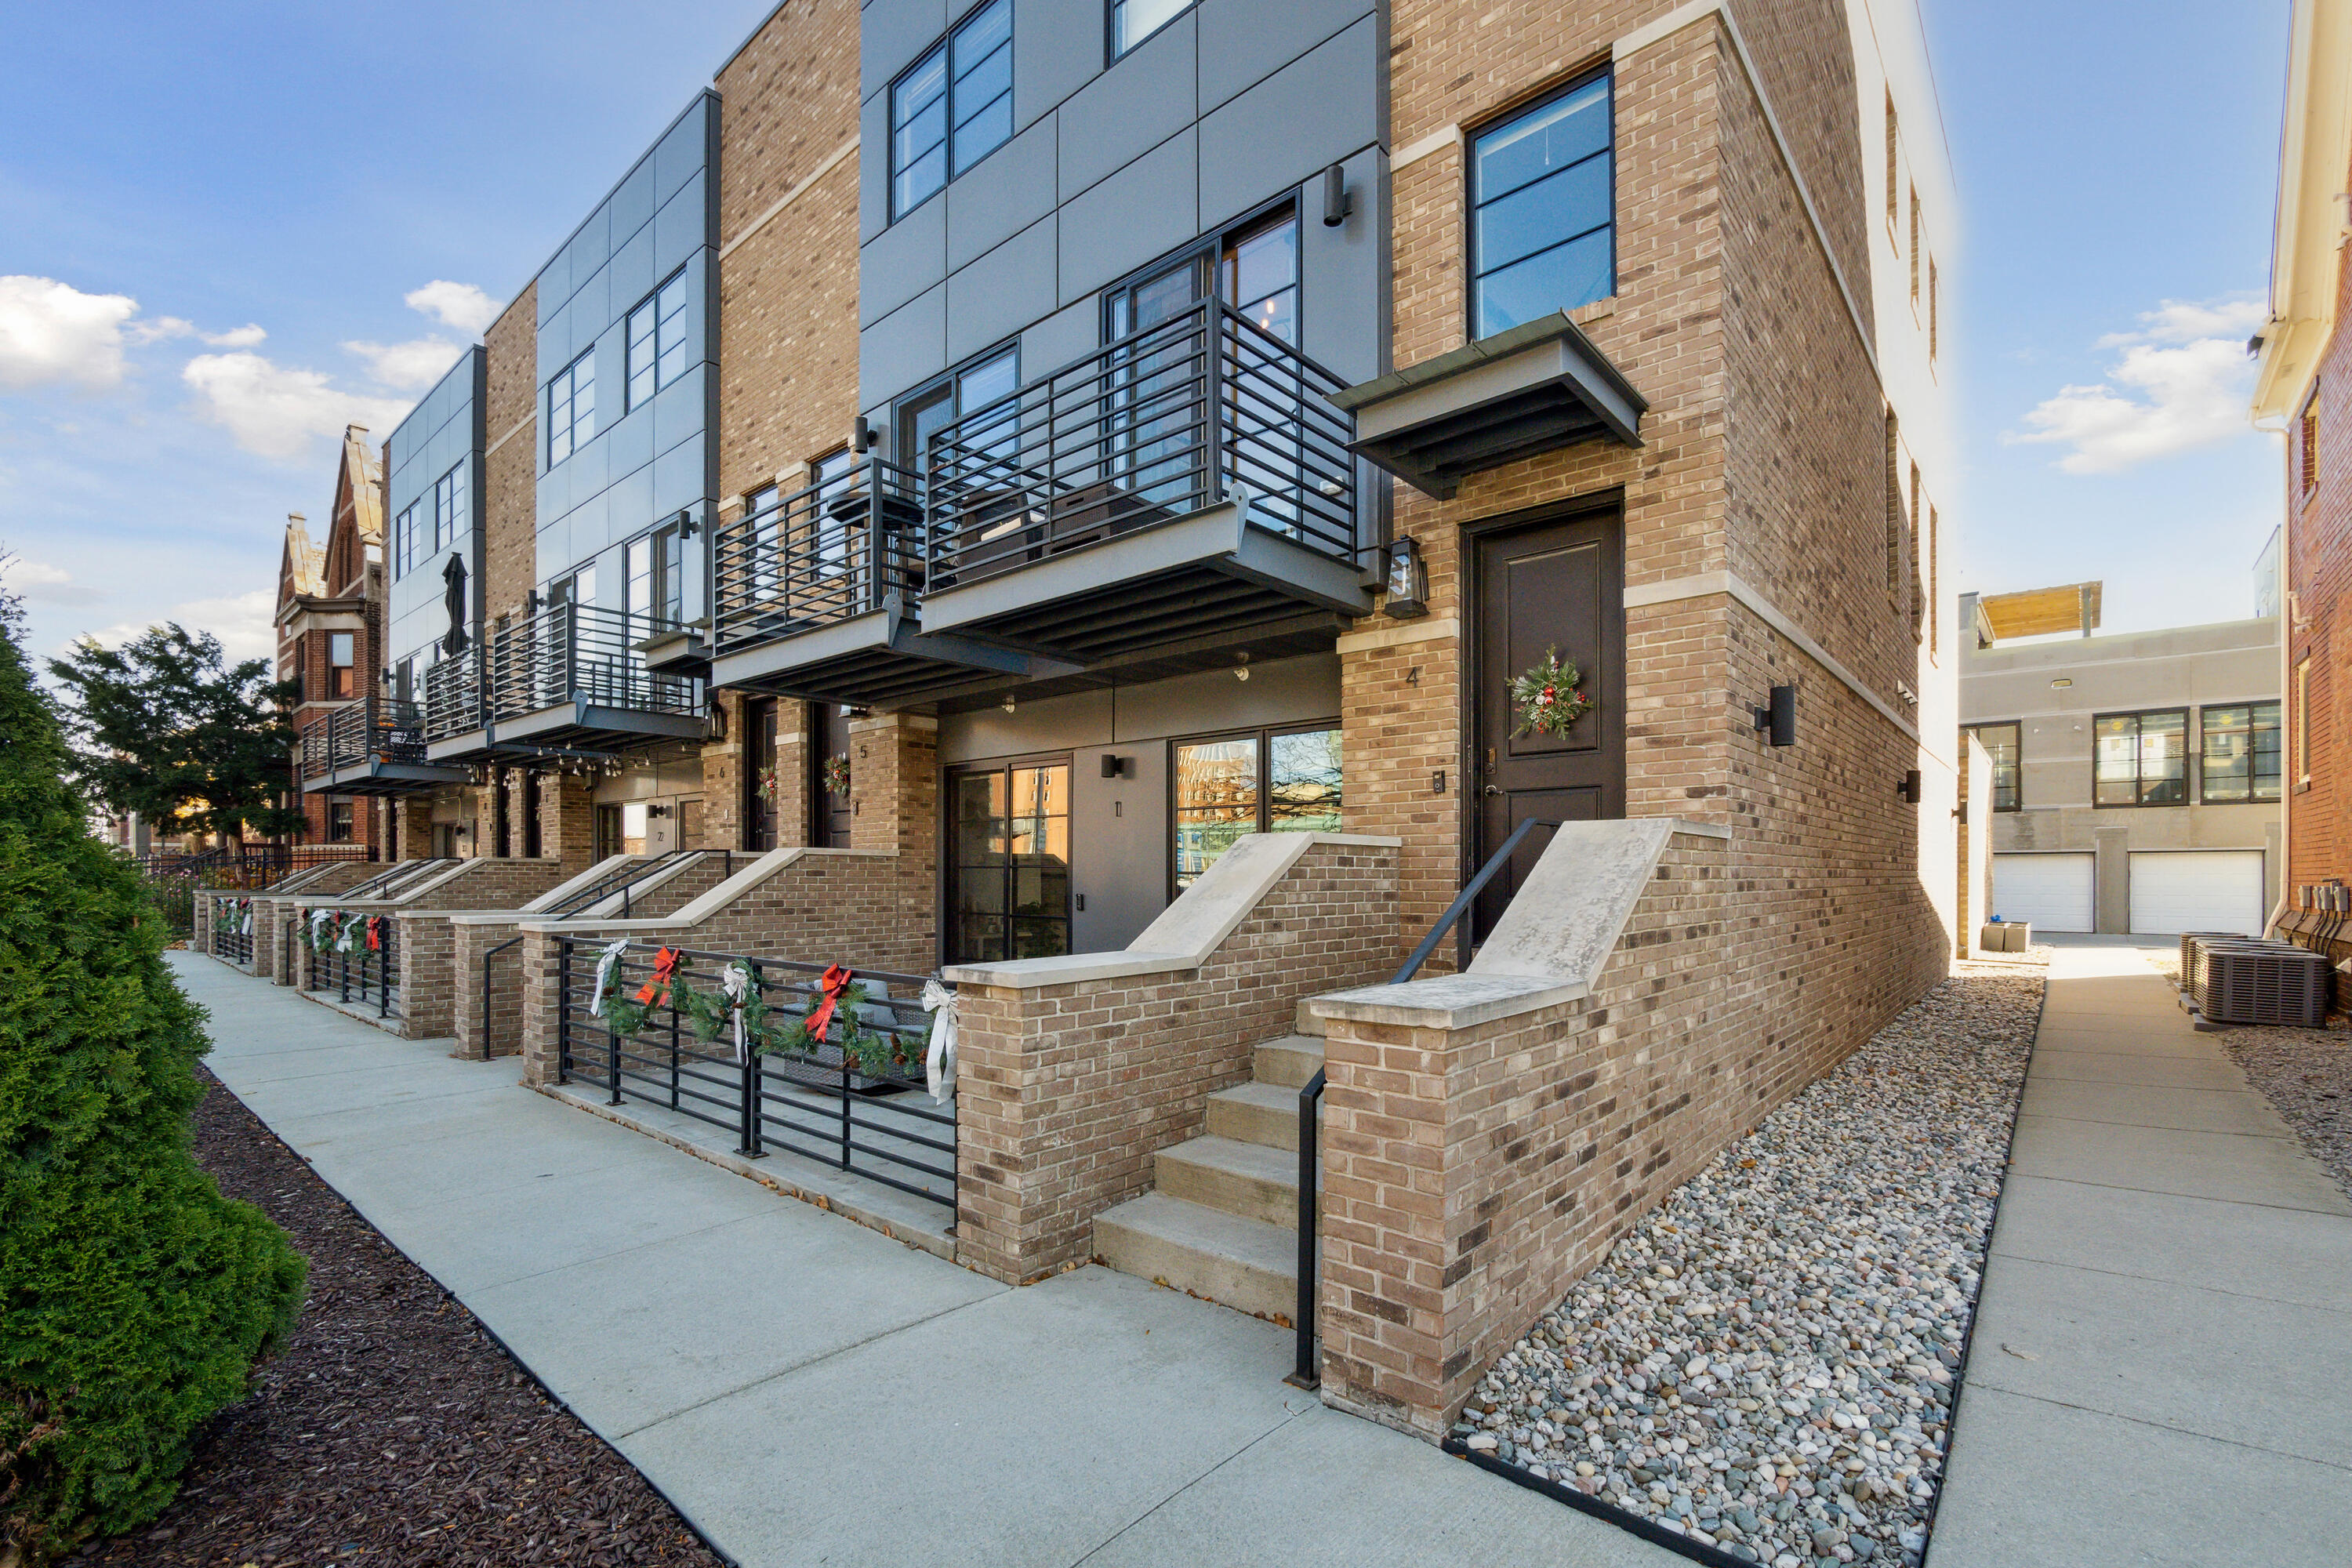
$535,000
2
bds
|
3
ba
|
1,278
sqft
|
built
2018
262 Mack Ave, Detroit, MI 48201
$-769
Cash flow
-7.5%
Cash-on-Cash Return
4.4%
Cap rate
0.7%
Rent to Value Ratio

Active
$125,000
3
bds
|
1
ba
|
1,210
sqft
|
built
1928
5793 Yorkshire Rd, Detroit, MI 48224
$217
Cash flow
9.1%
Cash-on-Cash Return
8.2%
Cap rate
1.1%
Rent to Value Ratio
Active
$75,000
4
bds
|
1
ba
|
1,193
sqft
|
built
1942
8645 Stahelin Ave, Detroit, MI 48228
$382
Cash flow
26.6%
Cash-on-Cash Return
12.3%
Cap rate
1.7%
Rent to Value Ratio
Active
$70,000
bds
|
0
ba
|
0
sqft
|
built
1923
9272 Cascade St, Detroit, MI 48204
$862
Cash flow
14.3%
Cash-on-Cash Return
14.8%
Cap rate
2.0%
Rent to Value Ratio
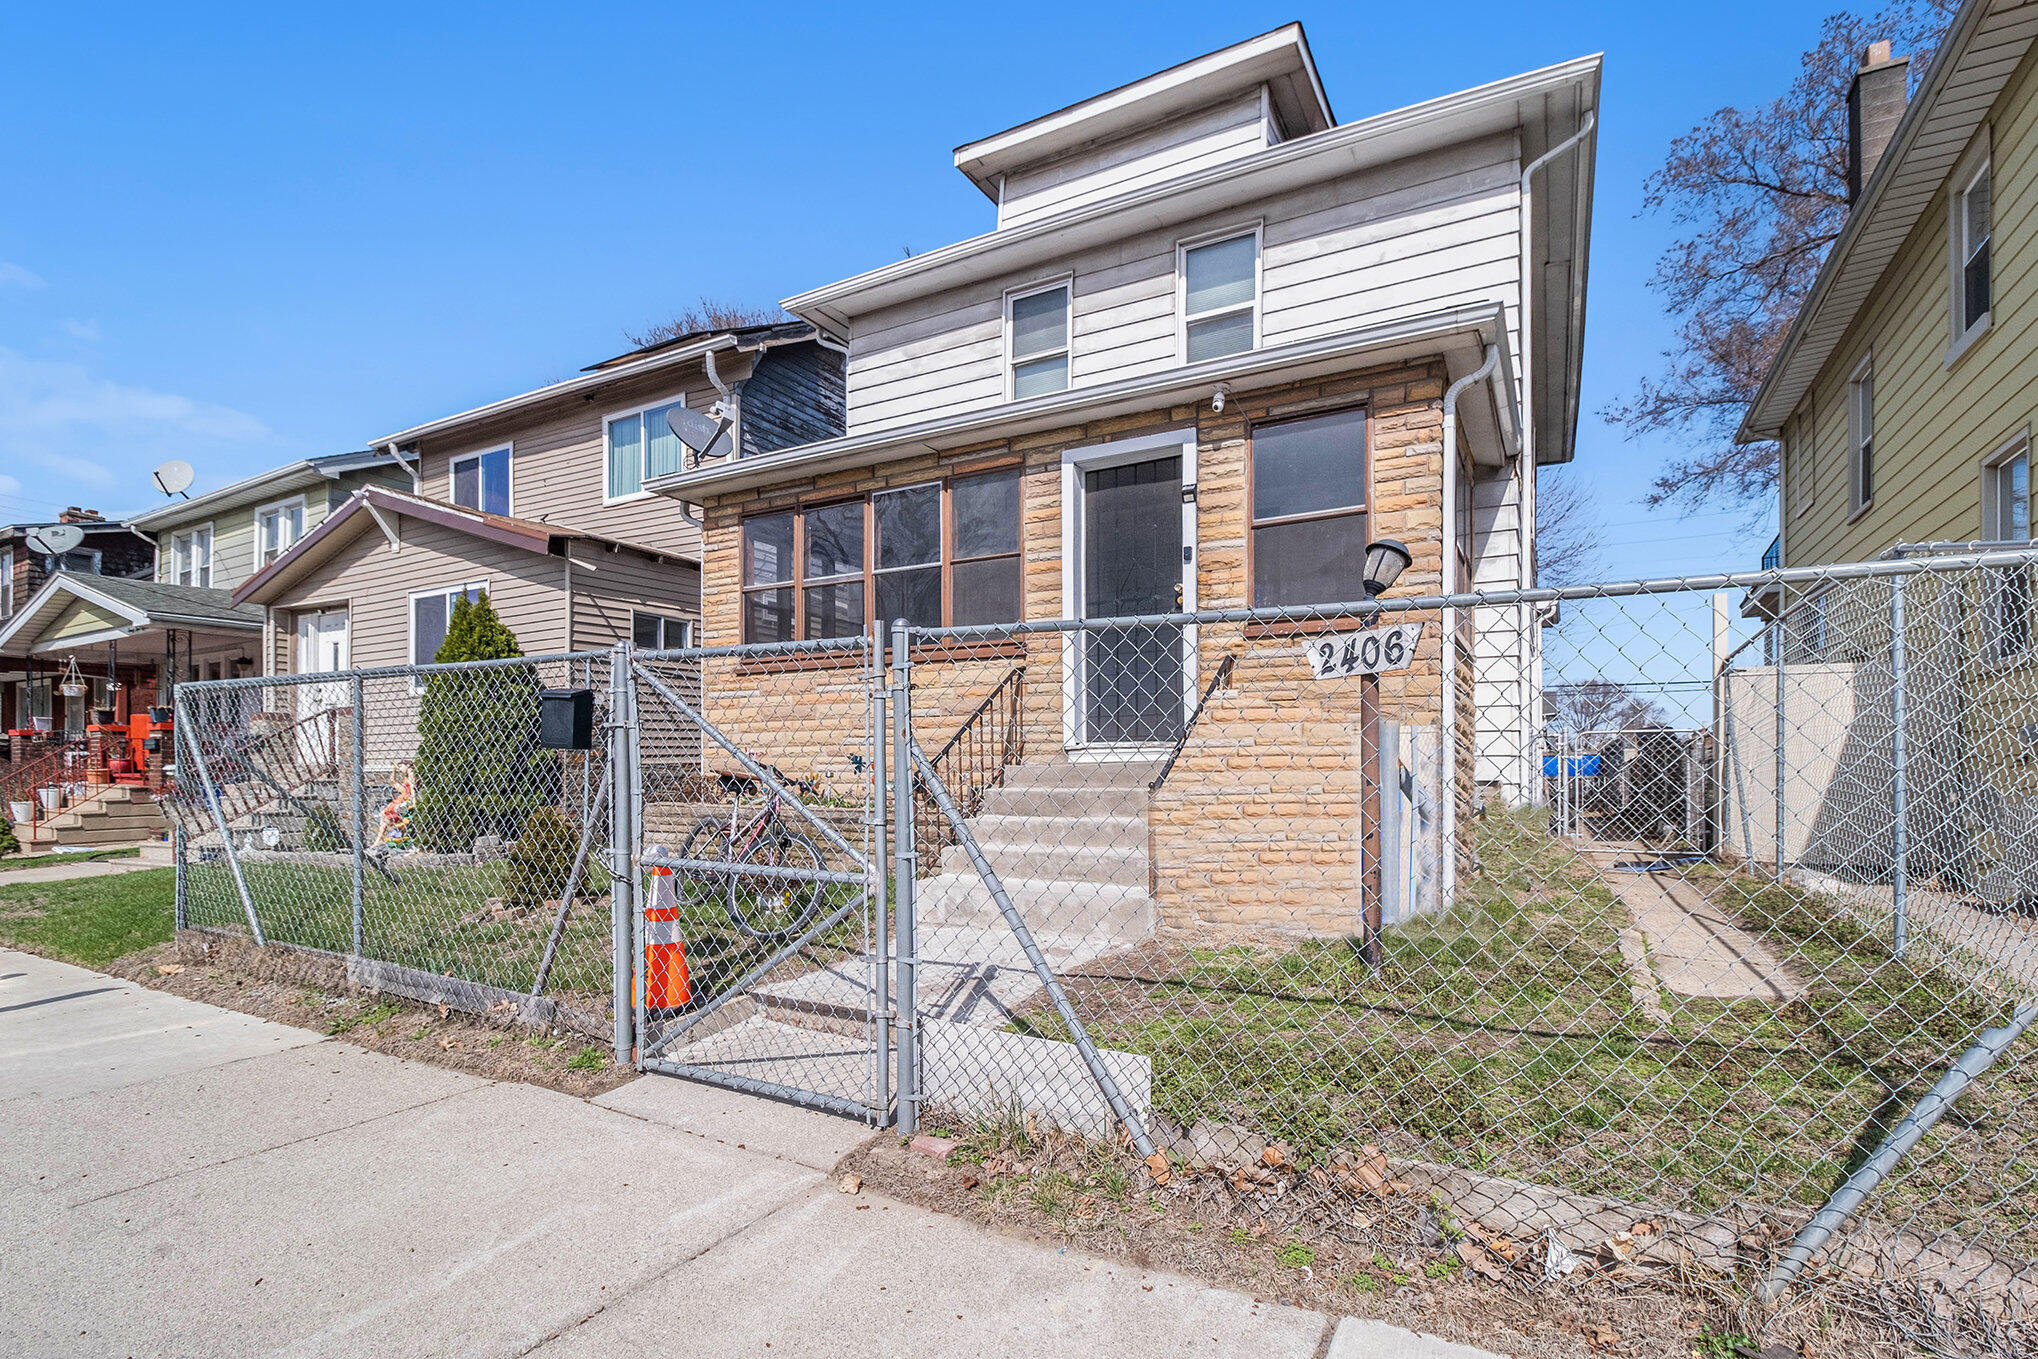
Active
$141,900
3
bds
|
3
ba
|
2,165
sqft
|
built
1919
2406 Sharon St, Detroit, MI 48209
$70
Cash flow
2.6%
Cash-on-Cash Return
6.7%
Cap rate
0.9%
Rent to Value Ratio
Active
$59,900
4
bds
|
2
ba
|
2,700
sqft
|
built
1913
3771 24th St, Detroit, MI 48208
$1,197
Cash flow
23.3%
Cash-on-Cash Return
24.0%
Cap rate
3.0%
Rent to Value Ratio
Active
$245,000
2
bds
|
1
ba
|
842
sqft
|
built
1890
658 W Forest Ave, Detroit, MI 48201
$-379
Cash flow
-8.1%
Cash-on-Cash Return
4.3%
Cap rate
0.9%
Rent to Value Ratio

Active
$109,900
2
bds
|
1
ba
|
737
sqft
|
built
1920
20035 Santa Barbara Dr, Detroit, MI 48221
$355
Cash flow
16.9%
Cash-on-Cash Return
10.0%
Cap rate
1.3%
Rent to Value Ratio

Active
$199,000
1
bds
|
1
ba
|
1,228
sqft
|
built
2007
287 E Palmer St, Detroit, MI 48202
$-760
Cash flow
-19.9%
Cash-on-Cash Return
1.6%
Cap rate
0.9%
Rent to Value Ratio
Active
$110,000
3
bds
|
2
ba
|
1,778
sqft
|
built
1925
4101 Pasadena St, Detroit, MI 48238
$279
Cash flow
13.2%
Cash-on-Cash Return
9.2%
Cap rate
1.3%
Rent to Value Ratio
Pending
$144,500
3
bds
|
2
ba
|
1,240
sqft
|
built
1940
5500 Oldtown St, Detroit, MI 48224
$96
Cash flow
3.5%
Cash-on-Cash Return
6.9%
Cap rate
1.0%
Rent to Value Ratio
Active
$63,000
3
bds
|
1
ba
|
0
sqft
|
built
1941
19624 Anglin St, Detroit, MI 48234
$635
Cash flow
11.7%
Cash-on-Cash Return
12.1%
Cap rate
1.7%
Rent to Value Ratio
Active
$49,000
3
bds
|
1
ba
|
900
sqft
|
built
1912
5019 Larchmont St, Detroit, MI 48204
$1,170
Cash flow
27.8%
Cash-on-Cash Return
28.7%
Cap rate
3.7%
Rent to Value Ratio
Active
$89,000
bds
|
0
ba
|
0
sqft
|
built
1924
12068 Prairie St, Detroit, MI 48204
$308
Cash flow
18.1%
Cash-on-Cash Return
10.3%
Cap rate
1.5%
Rent to Value Ratio
Active
$800,000
bds
|
0
ba
|
0
sqft
|
built
1905
250 Eliot St, Detroit, MI 48201
$-3,601
Cash flow
-23.5%
Cash-on-Cash Return
0.7%
Cap rate
0.2%
Rent to Value Ratio
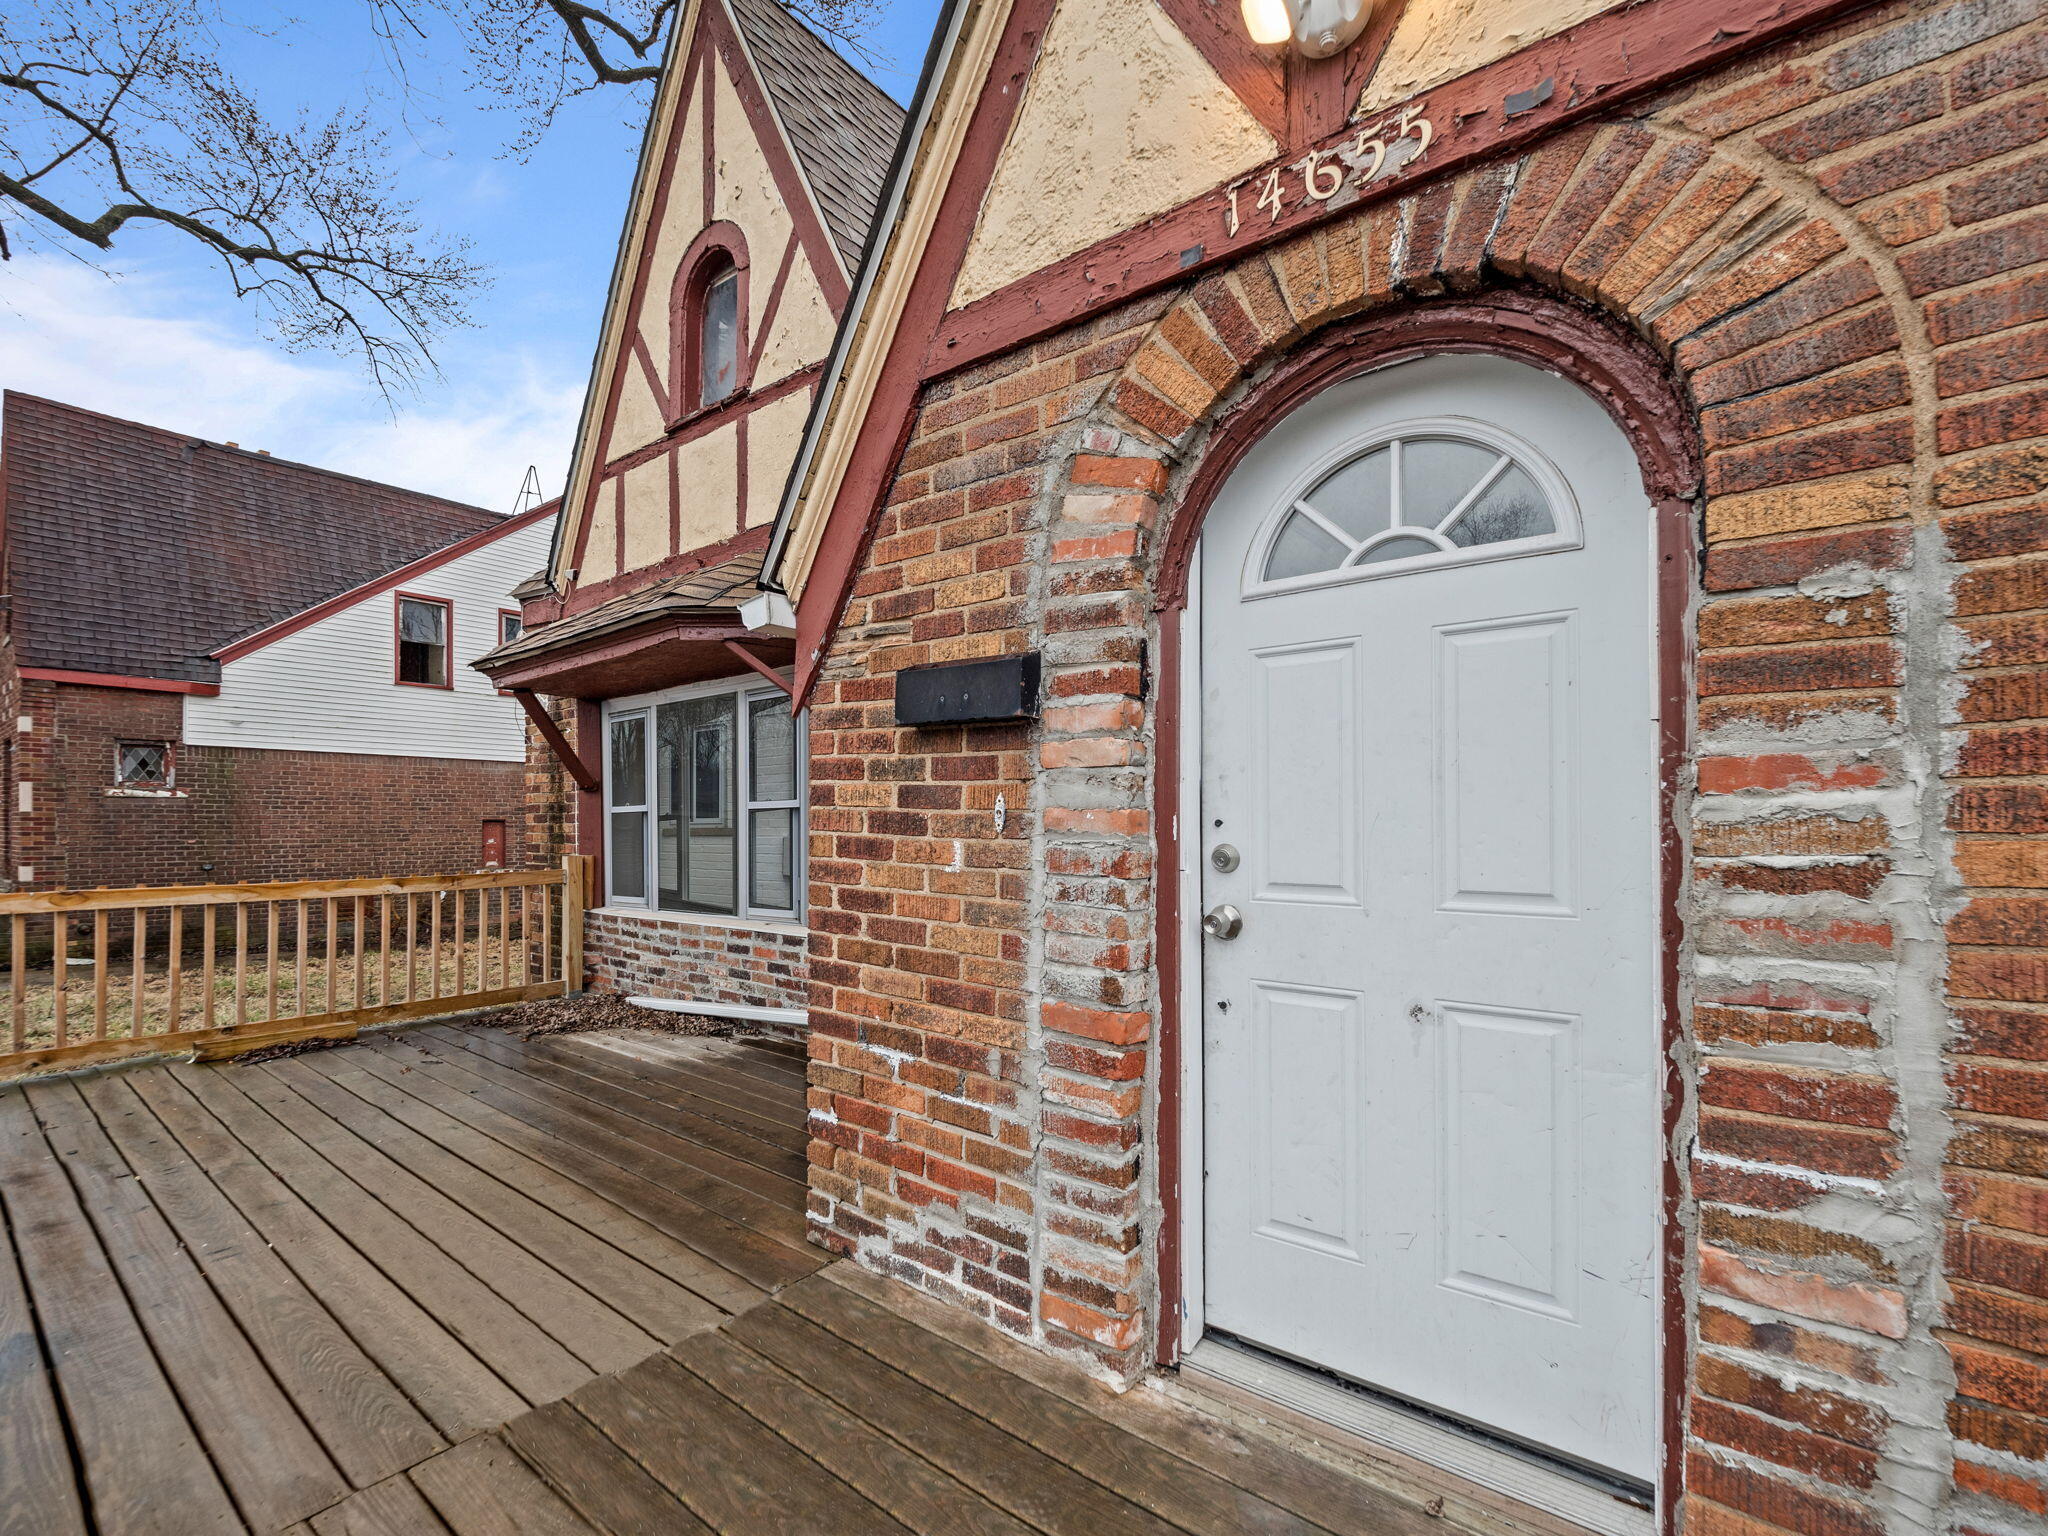
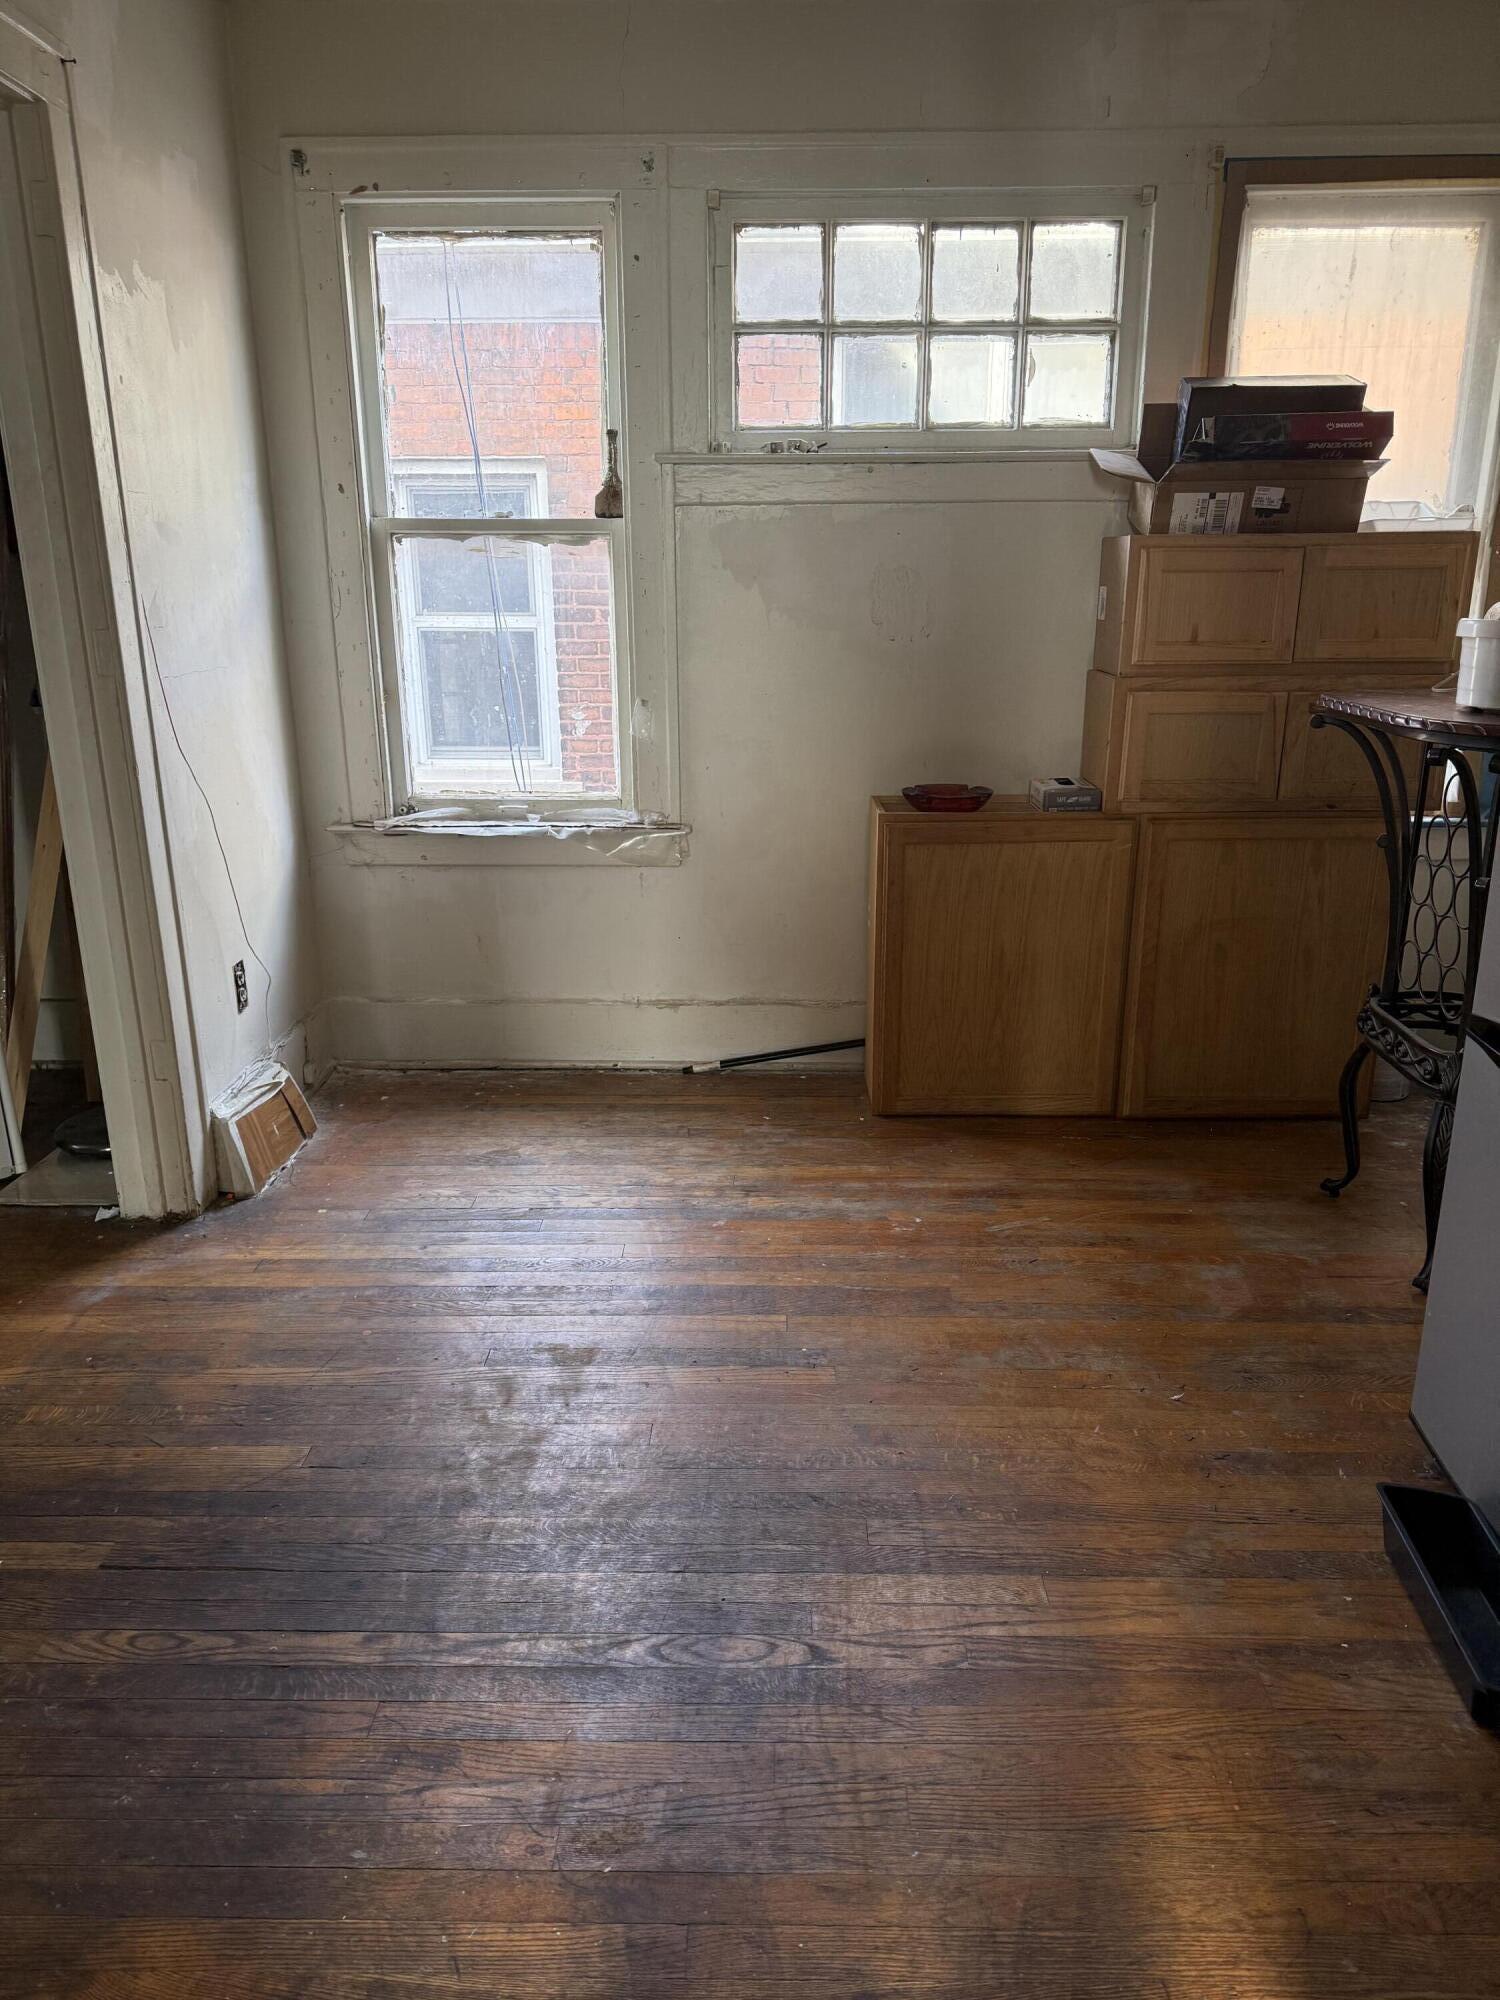
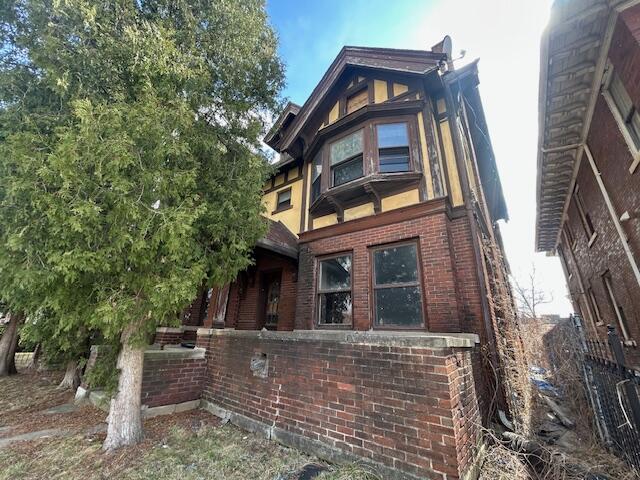
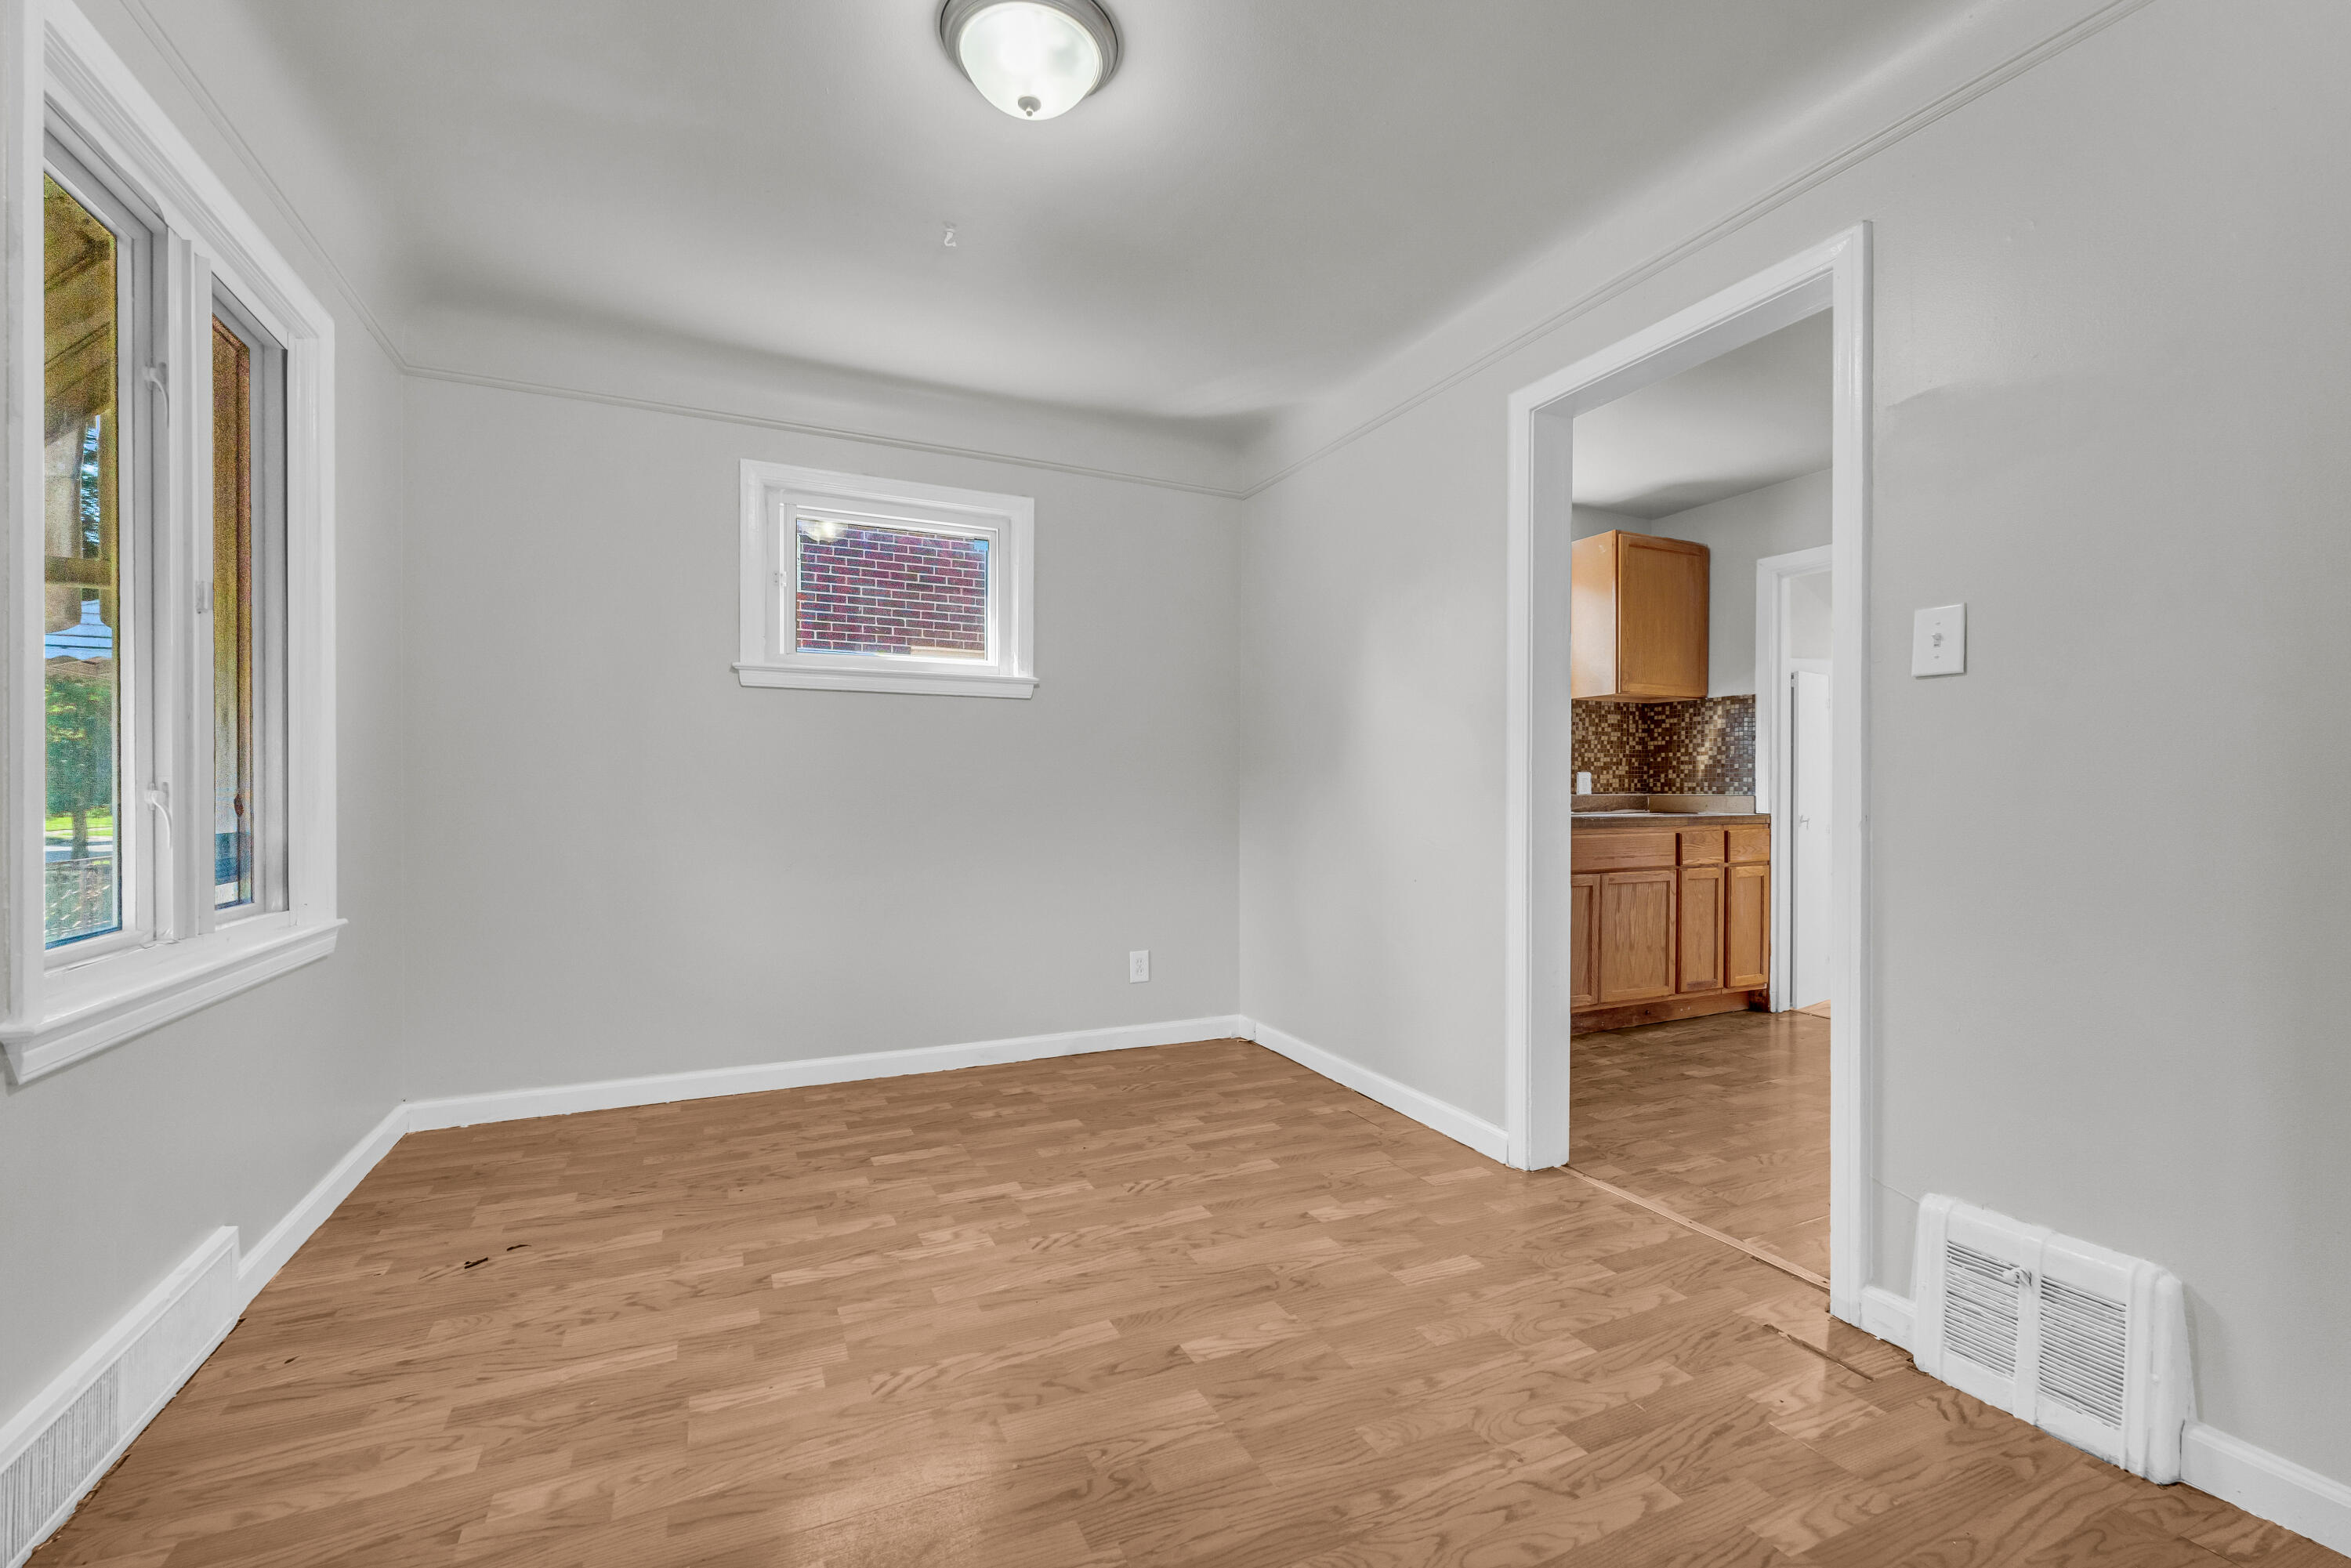
Active
$90,000
3
bds
|
1
ba
|
1,314
sqft
|
built
1928
14655 Sussex St, Detroit, MI 48227
$220
Cash flow
12.8%
Cash-on-Cash Return
9.1%
Cap rate
1.6%
Rent to Value Ratio
Active
$119,900
3
bds
|
2
ba
|
1,264
sqft
|
built
1941
17189 Albion St, Detroit, MI 48234
$336
Cash flow
14.6%
Cash-on-Cash Return
9.5%
Cap rate
1.3%
Rent to Value Ratio
Active
$29,900
3
bds
|
2
ba
|
1,800
sqft
|
built
1939
13151 Indiana St, Detroit, MI 48238
$626
Cash flow
24.4%
Cash-on-Cash Return
25.1%
Cap rate
3.7%
Rent to Value Ratio
Active
$129,000
bds
|
0
ba
|
0
sqft
|
built
1928
16127 Princeton St, Detroit, MI 48221
$-102
Cash flow
-4.1%
Cash-on-Cash Return
5.2%
Cap rate
0.9%
Rent to Value Ratio
Active
$120,000
3
bds
|
1
ba
|
1,188
sqft
|
built
1948
9570 Westwood St, Detroit, MI 48228
$128
Cash flow
5.6%
Cash-on-Cash Return
7.4%
Cap rate
1.2%
Rent to Value Ratio
Active
$65,000
3
bds
|
1
ba
|
0
sqft
|
built
1951
15881 Bramell St, Detroit, MI 48223
$587
Cash flow
10.5%
Cash-on-Cash Return
10.8%
Cap rate
1.7%
Rent to Value Ratio
Active
$35,000
2
bds
|
1
ba
|
0
sqft
|
built
1950
12690 Kentfield St, Detroit, MI 48223
$575
Cash flow
19.1%
Cash-on-Cash Return
19.7%
Cap rate
2.9%
Rent to Value Ratio
Active
$85,900
2
bds
|
1
ba
|
0
sqft
|
built
1940
8144 Sussex St, Detroit, MI 48228
$224
Cash flow
13.6%
Cash-on-Cash Return
9.3%
Cap rate
1.3%
Rent to Value Ratio
Active
$215,000
4
bds
|
2
ba
|
4,045
sqft
|
built
1917
1139 Atkinson St, Detroit, MI 48202
$263
Cash flow
6.4%
Cash-on-Cash Return
7.6%
Cap rate
1.0%
Rent to Value Ratio
Active
$55,000
4
bds
|
1
ba
|
0
sqft
|
built
1926
14783 Lappin St, Detroit, MI 48205
$928
Cash flow
19.7%
Cash-on-Cash Return
20.2%
Cap rate
2.5%
Rent to Value Ratio
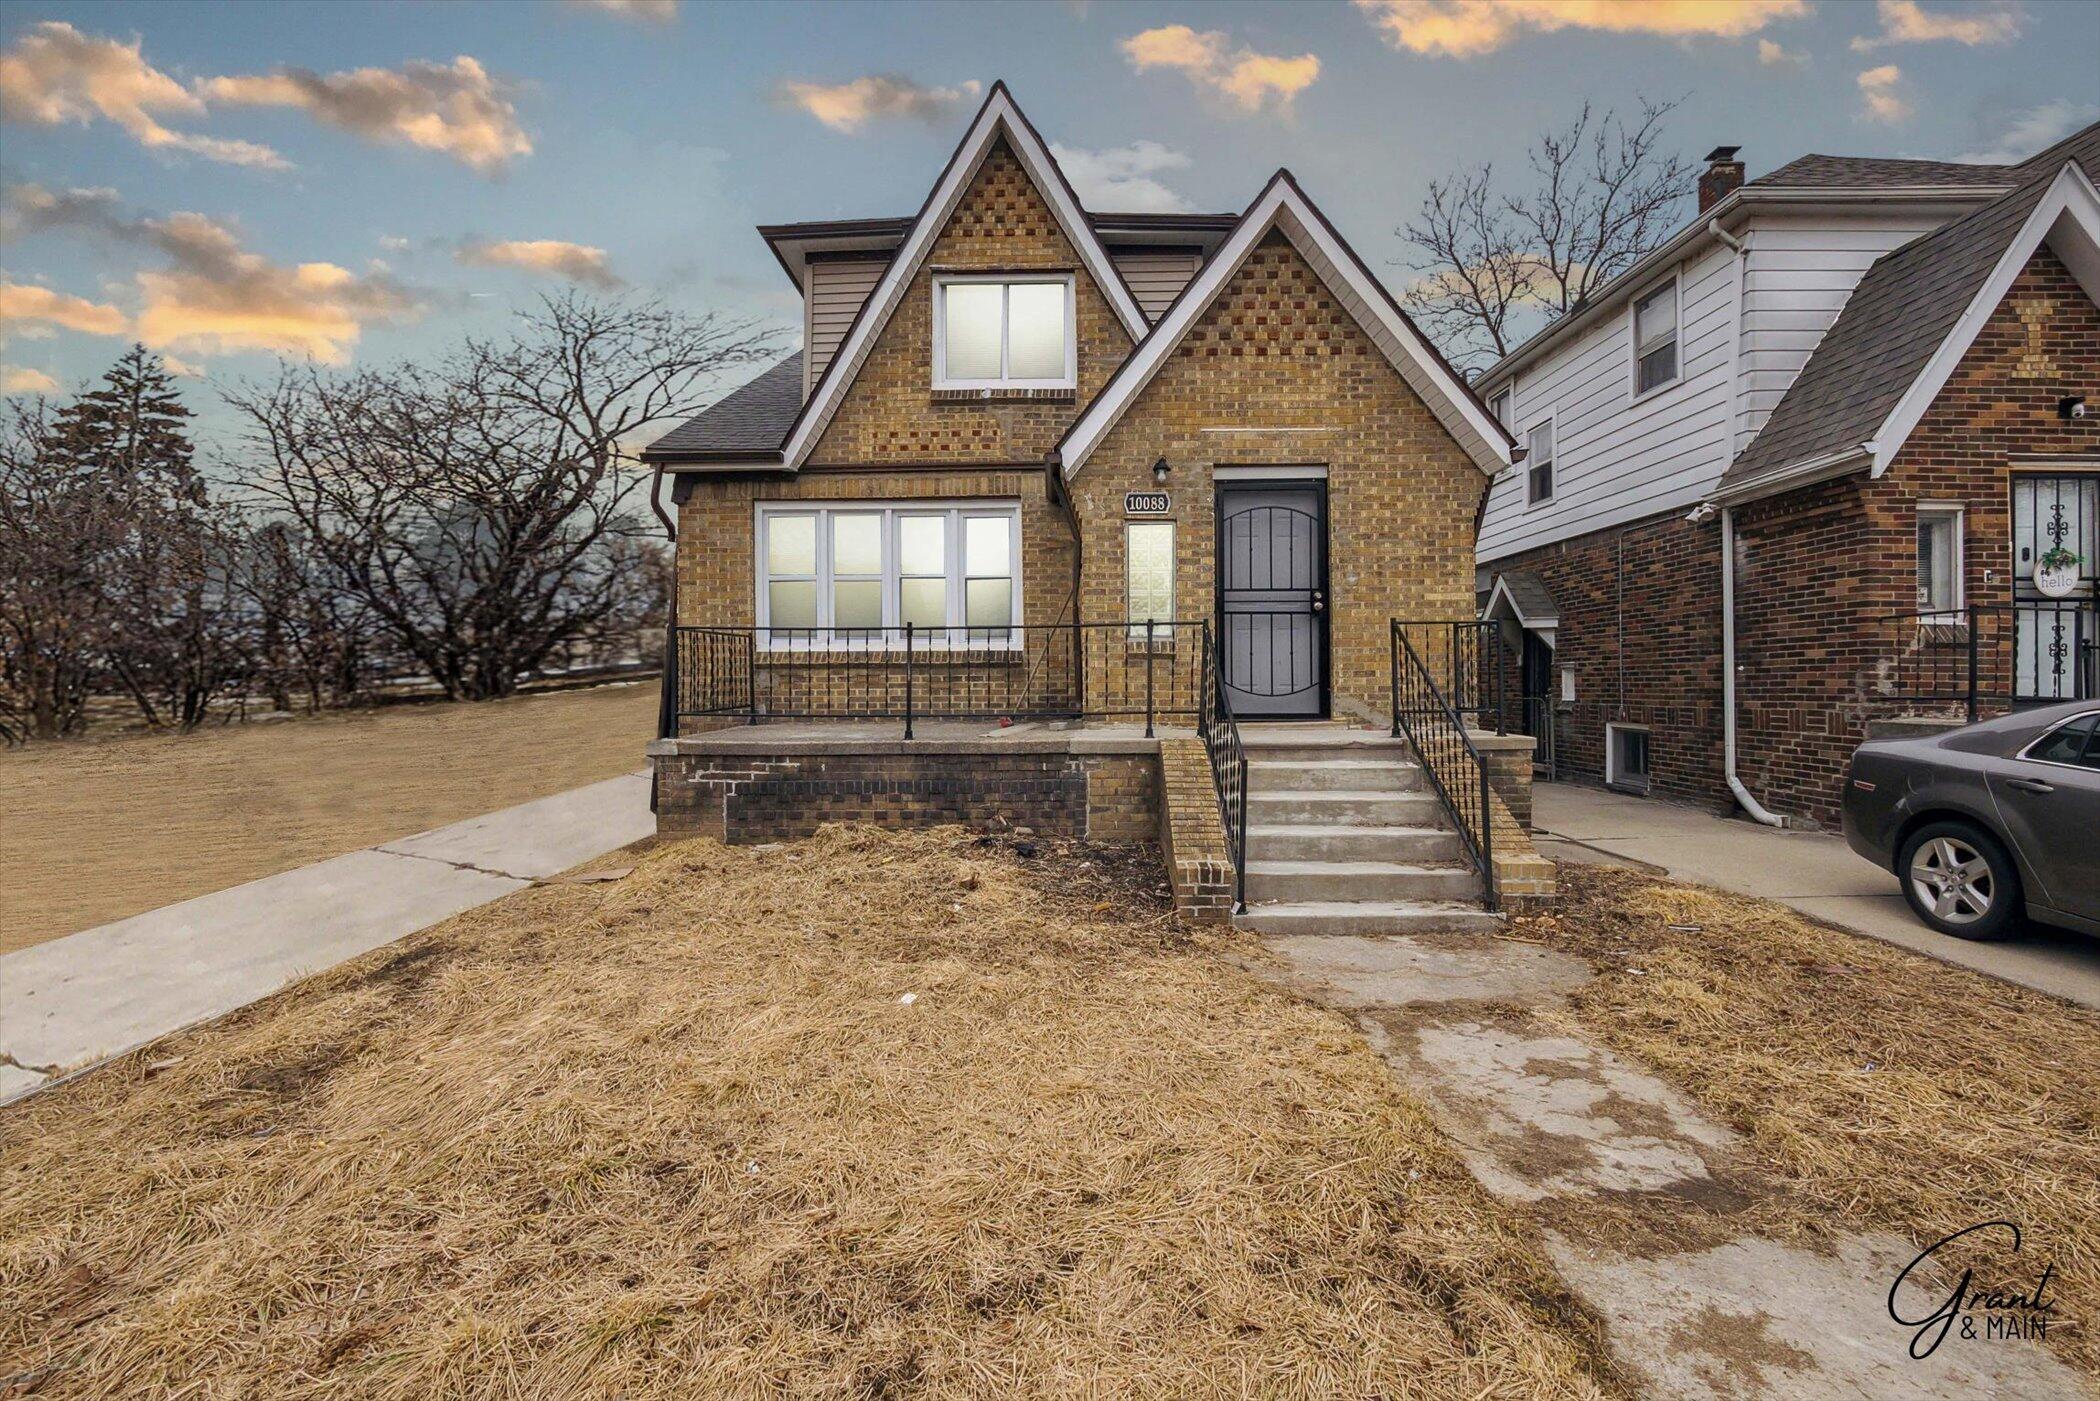
Active
$149,900
4
bds
|
3
ba
|
1,496
sqft
|
built
1929
10088 Britain St, Detroit, MI 48224
$-58
Cash flow
-2.0%
Cash-on-Cash Return
5.7%
Cap rate
0.9%
Rent to Value Ratio