Dickinson, TX Investment Properties for Sale
Browse homes for sale and investment properties in Dickinson, TX. Refine your search by price, property type, or more.
Best cash flowing properties in Dickinson, TX
Active
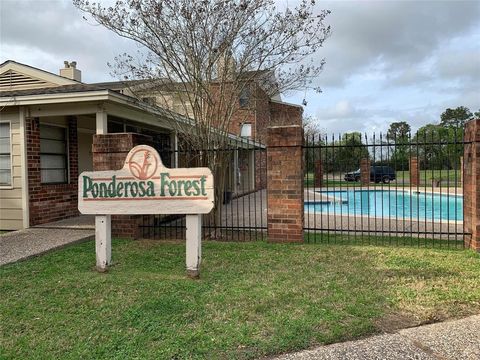
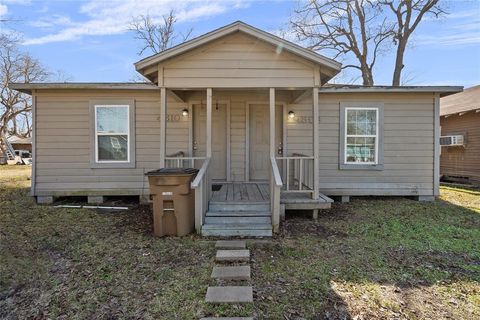
$61,800
1
bds
|
0
ba
|
639
sqft
|
built
1980
2501 Gulf Fwy, Dickinson, TX 77539
$181
Cash flow
3.4%
Cash-on-Cash Return
3.5%
Cap rate
1.8%
Rent to Value Ratio
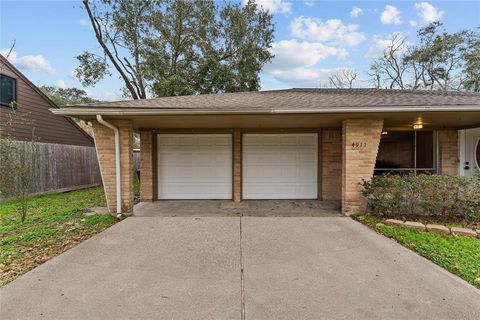
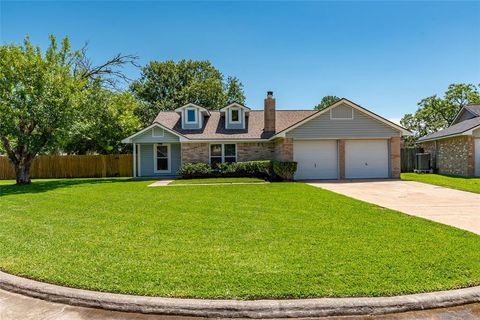
Active
$249,900
3
bds
|
0
ba
|
1,946
sqft
|
built
1972
4911 Old Castle Ln, Dickinson, TX 77539
$75
Cash flow
1.6%
Cash-on-Cash Return
6.6%
Cap rate
0.8%
Rent to Value Ratio
135 out of 144 properties for sale in Dickinson, TX
Limited Results Shown
Create a free account, or log in to reveal all property listings and enjoy the complete experience.

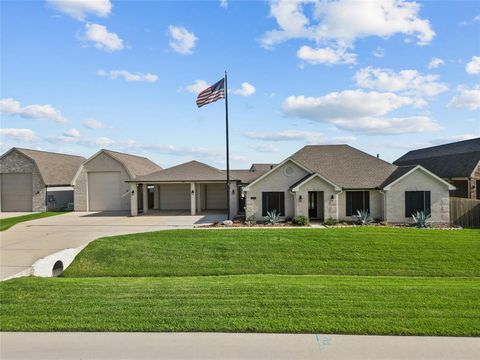
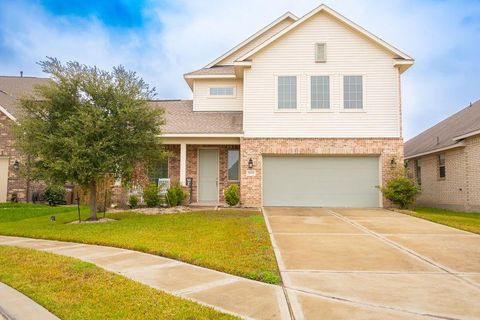
Active
$545,900
4
bds
|
0
ba
|
3,514
sqft
|
built
2022
3314 Bastian Rd, Dickinson, TX 77539
$-1,243
Cash flow
-11.9%
Cash-on-Cash Return
3.5%
Cap rate
0.7%
Rent to Value Ratio

Pending
$267,500
3
bds
|
0
ba
|
1,622
sqft
|
built
2002
218 Jordy Ln, Dickinson, TX 77539
$-577
Cash flow
-11.3%
Cash-on-Cash Return
3.7%
Cap rate
0.7%
Rent to Value Ratio
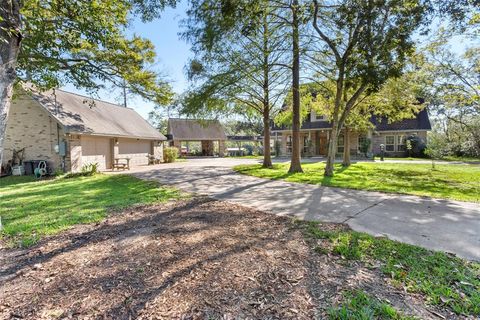
Active
$1,999,000
4
bds
|
0
ba
|
2,936
sqft
|
built
1988
860 Fm 517 Rd E, Dickinson, TX 77539
$-8,943
Cash flow
-23.3%
Cash-on-Cash Return
0.9%
Cap rate
0.2%
Rent to Value Ratio

Active
$84,000
2
bds
|
0
ba
|
886
sqft
|
built
1980
2501 Gulf Fwy, Dickinson, TX 77539
$-228
Cash flow
-14.2%
Cash-on-Cash Return
3.0%
Cap rate
1.3%
Rent to Value Ratio

Active
$329,000
4
bds
|
0
ba
|
2,500
sqft
|
built
2014
6861 Dogwood Cliff Ln, Dickinson, TX 77539
$-897
Cash flow
-14.2%
Cash-on-Cash Return
3.0%
Cap rate
0.8%
Rent to Value Ratio

Pending
$237,900
3
bds
|
0
ba
|
1,702
sqft
|
built
2004
410 Folk Crest Ln, Dickinson, TX 77539
$-388
Cash flow
-8.5%
Cash-on-Cash Return
4.3%
Cap rate
0.8%
Rent to Value Ratio

Active
$101,900
2
bds
|
0
ba
|
865
sqft
|
built
1980
2501 Gulf Fwy, Dickinson, TX 77539
$-523
Cash flow
-26.8%
Cash-on-Cash Return
0.1%
Cap rate
0.9%
Rent to Value Ratio

Active
$909,900
4
bds
|
0
ba
|
4,326
sqft
|
built
2018
5520 Forest Cove Dr, Dickinson, TX 77539
$-3,525
Cash flow
-20.2%
Cash-on-Cash Return
1.6%
Cap rate
0.5%
Rent to Value Ratio

Active
$200,000
3
bds
|
0
ba
|
1,572
sqft
|
built
2015
4112 Pine Shadows St, Dickinson, TX 77539
$-131
Cash flow
-3.4%
Cash-on-Cash Return
5.5%
Cap rate
1.0%
Rent to Value Ratio
Active
$535,000
3
bds
|
0
ba
|
2,170
sqft
|
built
2022
2214 Morales Dr, Dickinson, TX 77539
$-830
Cash flow
-8.1%
Cash-on-Cash Return
4.4%
Cap rate
0.5%
Rent to Value Ratio
Active
$315,000
3
bds
|
0
ba
|
1,496
sqft
|
built
2020
1824 Oakdale Mist Dr, Dickinson, TX 77539
$-758
Cash flow
-12.6%
Cash-on-Cash Return
3.4%
Cap rate
0.7%
Rent to Value Ratio

Active
$150,000
2
bds
|
0
ba
|
1,484
sqft
|
built
1975
2135 Casa Rio Cir, Dickinson, TX 77539
$-375
Cash flow
-13.0%
Cash-on-Cash Return
3.3%
Cap rate
1.3%
Rent to Value Ratio
Active
$360,000
4
bds
|
0
ba
|
2,480
sqft
|
built
2001
414 Lookout Ln, Dickinson, TX 77539
$-559
Cash flow
-8.1%
Cash-on-Cash Return
4.4%
Cap rate
0.8%
Rent to Value Ratio
Active
$469,000
4
bds
|
0
ba
|
3,638
sqft
|
built
2017
1736 Lake Raven Dr, Dickinson, TX 77539
$-1,216
Cash flow
-13.5%
Cash-on-Cash Return
3.2%
Cap rate
0.7%
Rent to Value Ratio
Active
$289,900
4
bds
|
0
ba
|
1,896
sqft
|
built
1966
1057 Royal Oak Dr, Dickinson, TX 77539
$-321
Cash flow
-5.8%
Cash-on-Cash Return
4.9%
Cap rate
0.8%
Rent to Value Ratio

Active
$489,999
3
bds
|
0
ba
|
2,985
sqft
|
built
1999
2209 Oak Dr, Dickinson, TX 77539
$-143
Cash flow
-1.5%
Cash-on-Cash Return
5.9%
Cap rate
0.7%
Rent to Value Ratio
Active
$290,000
4
bds
|
0
ba
|
1,951
sqft
|
built
2009
6718 Poplar Bend Ln, Dickinson, TX 77539
$-660
Cash flow
-11.9%
Cash-on-Cash Return
3.5%
Cap rate
0.8%
Rent to Value Ratio

Active
$215,000
3
bds
|
0
ba
|
1,322
sqft
|
built
1972
4014 Beatrice Ave, Dickinson, TX 77539
$-294
Cash flow
-7.1%
Cash-on-Cash Return
4.6%
Cap rate
0.7%
Rent to Value Ratio

Pending
$250,000
2
bds
|
0
ba
|
916
sqft
|
built
1978
8409 Benoist Dr, Dickinson, TX 77539
$-463
Cash flow
-9.7%
Cash-on-Cash Return
4.0%
Cap rate
0.6%
Rent to Value Ratio
Active
$95,000
2
bds
|
0
ba
|
886
sqft
|
built
1980
2501 Gulf Fwy, Dickinson, TX 77539
$-413
Cash flow
-22.7%
Cash-on-Cash Return
1.0%
Cap rate
1.2%
Rent to Value Ratio
Active
$209,000
4
bds
|
0
ba
|
1,648
sqft
|
built
1959
3702 Bayou Cir, Dickinson, TX 77539
$-172
Cash flow
-4.3%
Cash-on-Cash Return
5.3%
Cap rate
1.0%
Rent to Value Ratio

Active
$329,500
4
bds
|
0
ba
|
2,229
sqft
|
built
1987
5012 Harbor Light Dr, Dickinson, TX 77539
$-258
Cash flow
-4.1%
Cash-on-Cash Return
5.3%
Cap rate
0.8%
Rent to Value Ratio
Active
$260,000
4
bds
|
0
ba
|
1,729
sqft
|
built
1968
5000 Old Castle Ln, Dickinson, TX 77539
$-328
Cash flow
-6.6%
Cash-on-Cash Return
4.7%
Cap rate
0.8%
Rent to Value Ratio

Active
$1,000,000
bds
|
0
ba
|
2,127
sqft
|
built
1995
4419 Leonetti Ln, Dickinson, TX 77539
$-3,947
Cash flow
-20.6%
Cash-on-Cash Return
1.5%
Cap rate
0.2%
Rent to Value Ratio
Active
$499,900
4
bds
|
0
ba
|
3,985
sqft
|
built
1997
1400 Oak Hollow Dr, Dickinson, TX 77539
$-1,009
Cash flow
-10.5%
Cash-on-Cash Return
3.8%
Cap rate
0.7%
Rent to Value Ratio

Active
$335,000
3
bds
|
0
ba
|
1,903
sqft
|
built
1987
605 Kings Ct, Dickinson, TX 77539
$-484
Cash flow
-7.5%
Cash-on-Cash Return
4.5%
Cap rate
0.7%
Rent to Value Ratio
Active
$61,800
1
bds
|
0
ba
|
639
sqft
|
built
1980
2501 Gulf Fwy, Dickinson, TX 77539
$181
Cash flow
3.4%
Cash-on-Cash Return
3.5%
Cap rate
1.8%
Rent to Value Ratio

Active
$285,000
3
bds
|
0
ba
|
2,059
sqft
|
built
1976
4004 Briarglen Dr, Dickinson, TX 77539
$-298
Cash flow
-5.5%
Cash-on-Cash Return
5.0%
Cap rate
0.9%
Rent to Value Ratio
Active
$169,900
bds
|
0
ba
|
1,548
sqft
|
built
1972
4808 35th St, Dickinson, TX 77539
$-645
Cash flow
-19.8%
Cash-on-Cash Return
1.7%
Cap rate
0.5%
Rent to Value Ratio

Active
$412,500
5
bds
|
0
ba
|
3,591
sqft
|
built
2007
1752 Cypress Meadows Dr, Dickinson, TX 77539
$-495
Cash flow
-6.3%
Cash-on-Cash Return
4.8%
Cap rate
0.8%
Rent to Value Ratio
Active
$265,000
3
bds
|
0
ba
|
1,290
sqft
|
built
1983
5417 Teameadow Ct, Dickinson, TX 77539
$-466
Cash flow
-9.2%
Cash-on-Cash Return
4.2%
Cap rate
0.7%
Rent to Value Ratio
Active
$249,900
3
bds
|
0
ba
|
1,946
sqft
|
built
1972
4911 Old Castle Ln, Dickinson, TX 77539
$75
Cash flow
1.6%
Cash-on-Cash Return
6.6%
Cap rate
0.8%
Rent to Value Ratio

Active
$440,000
2
bds
|
0
ba
|
4,164
sqft
|
built
1974
4029 Briar Hollow Dr, Dickinson, TX 77539
$-2,119
Cash flow
-25.1%
Cash-on-Cash Return
0.5%
Cap rate
0.2%
Rent to Value Ratio

Active
$629,000
5
bds
|
0
ba
|
4,872
sqft
|
built
2014
422 Old Orchard Dr, Dickinson, TX 77539
$-2,052
Cash flow
-17.0%
Cash-on-Cash Return
2.4%
Cap rate
0.6%
Rent to Value Ratio
Active
$320,000
3
bds
|
0
ba
|
2,363
sqft
|
built
2019
5319 Decatur Ct, Dickinson, TX 77539
$-482
Cash flow
-7.9%
Cash-on-Cash Return
4.5%
Cap rate
0.8%
Rent to Value Ratio

Active
$3,200,000
4
bds
|
0
ba
|
7,761
sqft
|
built
2007
6710 Falcon Pt, Dickinson, TX 77539
$-15,761
Cash flow
-25.7%
Cash-on-Cash Return
0.4%
Cap rate
0.2%
Rent to Value Ratio
Active
$300,000
3
bds
|
0
ba
|
1,875
sqft
|
built
1970
5404 Tanglebriar Dr, Dickinson, TX 77539
$-273
Cash flow
-4.7%
Cash-on-Cash Return
5.2%
Cap rate
0.8%
Rent to Value Ratio
Active
$351,000
3
bds
|
0
ba
|
2,048
sqft
|
built
1999
412 Pecan Grv, Dickinson, TX 77539
$-583
Cash flow
-8.7%
Cash-on-Cash Return
4.3%
Cap rate
0.8%
Rent to Value Ratio

Active
$269,900
3
bds
|
0
ba
|
1,713
sqft
|
built
1988
513 White Wing Ct, Dickinson, TX 77539
$-214
Cash flow
-4.1%
Cash-on-Cash Return
5.3%
Cap rate
0.8%
Rent to Value Ratio

Active
$309,500
3
bds
|
0
ba
|
1,625
sqft
|
built
1969
5117 Winding Way, Dickinson, TX 77539
$-846
Cash flow
-14.3%
Cash-on-Cash Return
3.0%
Cap rate
0.5%
Rent to Value Ratio