Elgin, IL Investment Properties for Sale
Browse homes for sale and investment properties in Elgin, IL. Refine your search by price, property type, or more.
Best cash flowing properties in Elgin, IL
Active
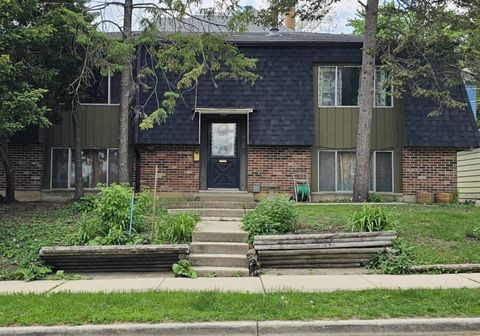
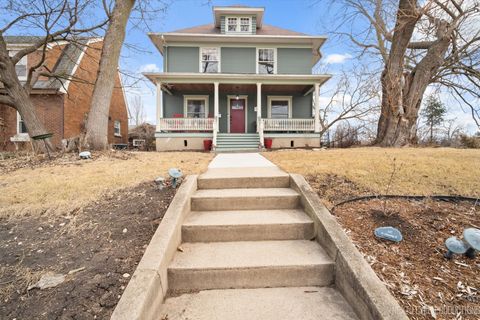
$259,900
4
bds
|
2
ba
|
2,150
sqft
|
built
1968
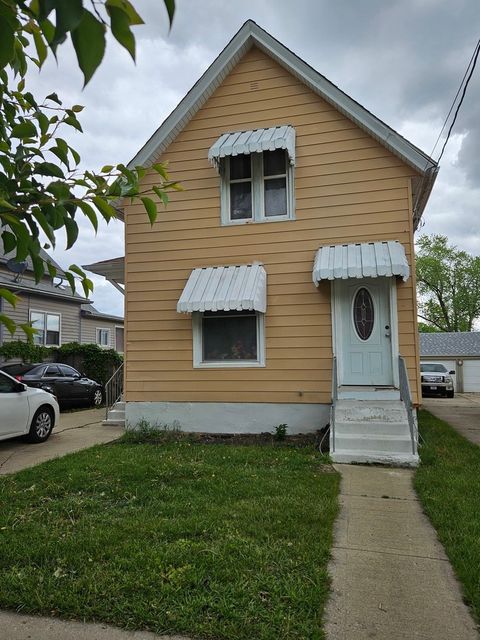
422 Ryerson Ave, Elgin, IL 60123
$-74
Cash flow
-1.5%
Cash-on-Cash Return
5.9%
Cap rate
1.0%
Rent to Value Ratio

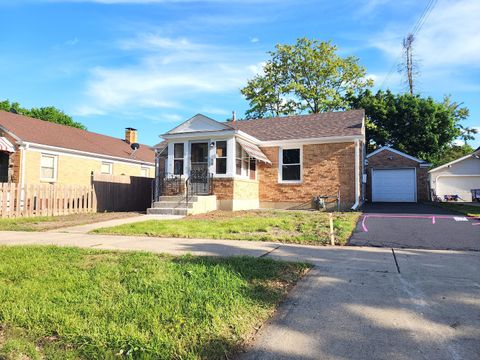
Active under contract
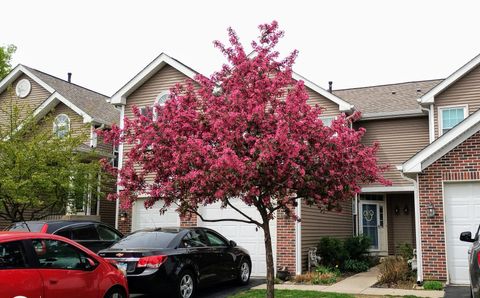
$239,900
3
bds
|
2
ba
|
1,125
sqft
|
built
1948
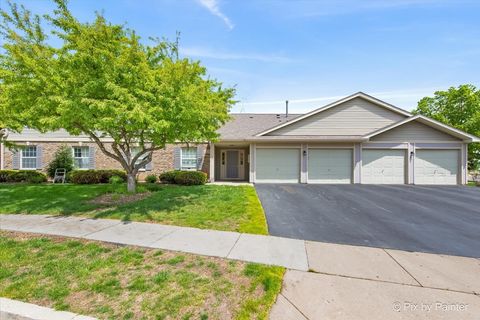
510 S Alfred Ave, Elgin, IL 60123
$-97
Cash flow
-2.1%
Cash-on-Cash Return
5.8%
Cap rate
0.9%
Rent to Value Ratio
86 out of 95 properties for sale in Elgin, IL
Limited Results Shown
Create a free account, or log in to reveal all property listings and enjoy the complete experience.

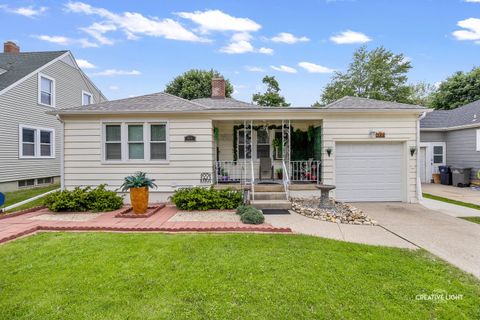
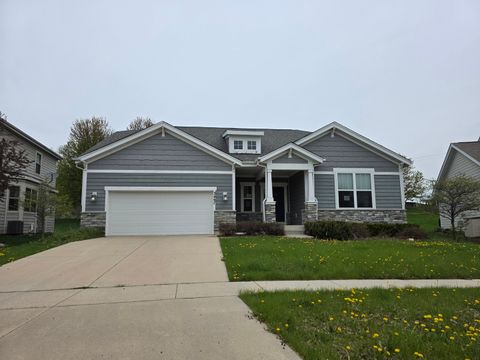
Active under contract
$325,000
3
bds
|
3
ba
|
0
sqft
|
built
1863
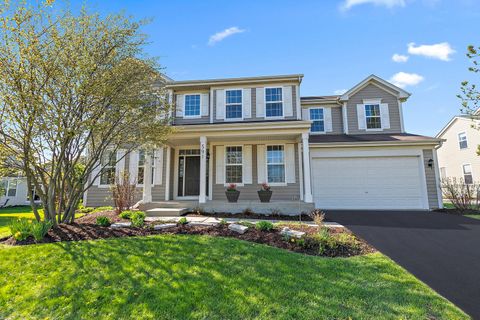
572 Walnut Ave, Elgin, IL 60123
$-584
Cash flow
-9.4%
Cash-on-Cash Return
4.1%
Cap rate
0.8%
Rent to Value Ratio

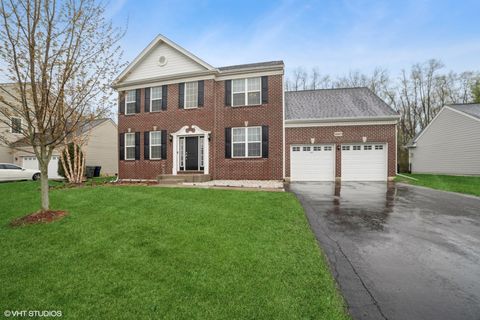
Active
$499,000
4
bds
|
3
ba
|
2,750
sqft
|
built
2012
3077 Wickenden Ave, Elgin, IL 60124
$-1,379
Cash flow
-14.4%
Cash-on-Cash Return
2.9%
Cap rate
0.6%
Rent to Value Ratio

Active
$539,900
4
bds
|
3
ba
|
2,952
sqft
|
built
2014
3645 Thornhill Dr, Elgin, IL 60124
$-1,407
Cash flow
-13.6%
Cash-on-Cash Return
3.1%
Cap rate
0.7%
Rent to Value Ratio
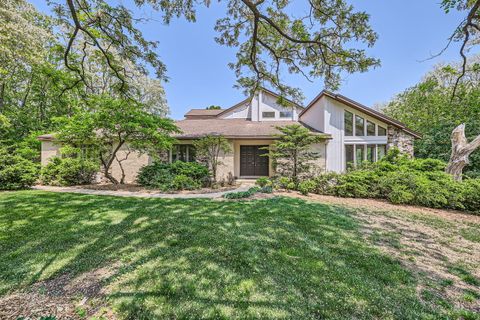
Active under contract
$450,000
3
bds
|
4
ba
|
4,856
sqft
|
built
1984
37W396 Maryhill Ln, Elgin, IL 60124
$-1,084
Cash flow
-12.6%
Cash-on-Cash Return
3.4%
Cap rate
0.8%
Rent to Value Ratio

Active under contract
$314,900
3
bds
|
2
ba
|
1,728
sqft
|
built
1963
165 Kathleen Dr, Elgin, IL 60123
$-527
Cash flow
-8.7%
Cash-on-Cash Return
4.3%
Cap rate
0.7%
Rent to Value Ratio

Active
$560,000
3
bds
|
4
ba
|
3,873
sqft
|
built
1992
2760 Glendower Ter, Elgin, IL 60124
$-1,629
Cash flow
-15.2%
Cash-on-Cash Return
2.8%
Cap rate
0.6%
Rent to Value Ratio

Active
$510,000
3
bds
|
3
ba
|
2,470
sqft
|
built
2013
3879 Seigle Dr, Elgin, IL 60124
$-1,632
Cash flow
-16.7%
Cash-on-Cash Return
2.4%
Cap rate
0.6%
Rent to Value Ratio

Active
$375,000
3
bds
|
2
ba
|
1,834
sqft
|
built
1930
1310 Larkin Ave, Elgin, IL 60123
$-908
Cash flow
-12.6%
Cash-on-Cash Return
3.4%
Cap rate
0.7%
Rent to Value Ratio

Active
$336,555
3
bds
|
3
ba
|
2,655
sqft
|
built
2005
3116 Taunton St, Elgin, IL 60124
$-767
Cash flow
-11.9%
Cash-on-Cash Return
3.5%
Cap rate
0.8%
Rent to Value Ratio

Active under contract
$450,000
3
bds
|
2
ba
|
2,413
sqft
|
built
2006
316 Weymouth Ave, Elgin, IL 60124
$-166
Cash flow
-1.9%
Cash-on-Cash Return
5.8%
Cap rate
0.7%
Rent to Value Ratio
Active under contract
$239,900
3
bds
|
2
ba
|
1,125
sqft
|
built
1948
510 S Alfred Ave, Elgin, IL 60123
$-97
Cash flow
-2.1%
Cash-on-Cash Return
5.8%
Cap rate
0.9%
Rent to Value Ratio
Active
$289,900
2
bds
|
2
ba
|
837
sqft
|
built
1951
673 Slade Ave, Elgin, IL 60120
$-527
Cash flow
-9.5%
Cash-on-Cash Return
4.1%
Cap rate
0.7%
Rent to Value Ratio
Active under contract
$279,900
2
bds
|
2
ba
|
837
sqft
|
built
1938
311 S Clifton Ave, Elgin, IL 60123
$-550
Cash flow
-10.3%
Cash-on-Cash Return
3.9%
Cap rate
0.6%
Rent to Value Ratio
Active
$239,500
3
bds
|
2
ba
|
1,200
sqft
|
built
1920
315 Vandalia St, Elgin, IL 60123
$-321
Cash flow
-7.0%
Cash-on-Cash Return
4.7%
Cap rate
0.8%
Rent to Value Ratio
Active under contract
$309,900
4
bds
|
2
ba
|
2,613
sqft
|
built
1956
301 Illinois Ave, Elgin, IL 60120
$-623
Cash flow
-10.5%
Cash-on-Cash Return
3.9%
Cap rate
0.7%
Rent to Value Ratio

Active
$565,000
4
bds
|
3
ba
|
2,932
sqft
|
built
2022
752 Kentshire Cir, Elgin, IL 60124
$-1,794
Cash flow
-16.6%
Cash-on-Cash Return
2.5%
Cap rate
0.6%
Rent to Value Ratio

Active
$329,900
3
bds
|
2
ba
|
0
sqft
|
built
1900
558 Franklin Blvd, Elgin, IL 60120
$-574
Cash flow
-9.1%
Cash-on-Cash Return
4.2%
Cap rate
0.7%
Rent to Value Ratio

Active
$599,900
4
bds
|
3
ba
|
3,100
sqft
|
built
2006
879 Oak Ridge Blvd, Elgin, IL 60120
$-1,688
Cash flow
-14.7%
Cash-on-Cash Return
2.9%
Cap rate
0.6%
Rent to Value Ratio

Active
$310,000
2
bds
|
3
ba
|
1,711
sqft
|
built
2001
740 Countryfield Ln, Elgin, IL 60120
$-687
Cash flow
-11.6%
Cash-on-Cash Return
3.6%
Cap rate
0.8%
Rent to Value Ratio

Active
$439,000
4
bds
|
3
ba
|
2,000
sqft
|
built
1989
1010 Hampshire Ln, Elgin, IL 60120
$-865
Cash flow
-10.3%
Cash-on-Cash Return
3.9%
Cap rate
0.7%
Rent to Value Ratio

Pending
$364,900
3
bds
|
2
ba
|
1,980
sqft
|
built
1990
1052 Clover Hill Ln, Elgin, IL 60120
$-541
Cash flow
-7.7%
Cash-on-Cash Return
4.5%
Cap rate
0.8%
Rent to Value Ratio

Active
$499,900
3
bds
|
3
ba
|
2,523
sqft
|
built
2018
166 Morning Glory Way, Elgin, IL 60124
$-1,274
Cash flow
-13.3%
Cash-on-Cash Return
3.2%
Cap rate
0.6%
Rent to Value Ratio
Active under contract
$292,000
3
bds
|
2
ba
|
1,700
sqft
|
built
2002
2406 Daybreak Ct, Elgin, IL 60123
$-709
Cash flow
-12.7%
Cash-on-Cash Return
3.3%
Cap rate
0.8%
Rent to Value Ratio
Active
$229,000
2
bds
|
2
ba
|
0
sqft
|
built
1997
1023 Berkshire Ct, Elgin, IL 60120
$-492
Cash flow
-11.2%
Cash-on-Cash Return
3.7%
Cap rate
0.9%
Rent to Value Ratio
Active
$259,900
4
bds
|
2
ba
|
2,150
sqft
|
built
1968
422 Ryerson Ave, Elgin, IL 60123
$-74
Cash flow
-1.5%
Cash-on-Cash Return
5.9%
Cap rate
1.0%
Rent to Value Ratio

Active under contract
$319,900
2
bds
|
3
ba
|
1,925
sqft
|
built
2007
133 S Grove Ave, Elgin, IL 60120
$-621
Cash flow
-10.1%
Cash-on-Cash Return
3.9%
Cap rate
0.8%
Rent to Value Ratio
Active
$539,000
4
bds
|
3
ba
|
2,512
sqft
|
built
2006
591 Waterford Rd, Elgin, IL 60124
$-1,579
Cash flow
-15.3%
Cash-on-Cash Return
2.7%
Cap rate
0.6%
Rent to Value Ratio

Active
$299,500
2
bds
|
3
ba
|
1,875
sqft
|
built
2005
179 S Grove Ave, Elgin, IL 60120
$-180
Cash flow
-3.1%
Cash-on-Cash Return
5.5%
Cap rate
1.0%
Rent to Value Ratio
Active
$165,000
2
bds
|
1
ba
|
864
sqft
|
built
1987
764 Terrace Ct, Elgin, IL 60120
$-615
Cash flow
-19.4%
Cash-on-Cash Return
1.8%
Cap rate
1.0%
Rent to Value Ratio
Active
$599,000
5
bds
|
5
ba
|
4,590
sqft
|
built
1984
951 Hillcrest Rd, Elgin, IL 60123
$-1,331
Cash flow
-11.6%
Cash-on-Cash Return
3.6%
Cap rate
0.7%
Rent to Value Ratio
Active
$569,900
4
bds
|
4
ba
|
2,700
sqft
|
built
2003
80 Chestnut Ct, Elgin, IL 60120
$-1,392
Cash flow
-12.7%
Cash-on-Cash Return
3.3%
Cap rate
0.6%
Rent to Value Ratio
Active
$316,000
3
bds
|
2
ba
|
1,008
sqft
|
built
1961
362 Heine Ave, Elgin, IL 60123
$-579
Cash flow
-9.6%
Cash-on-Cash Return
4.1%
Cap rate
0.7%
Rent to Value Ratio
Active
$349,900
4
bds
|
1
ba
|
1,906
sqft
|
built
1906
137 N Channing St, Elgin, IL 60120
$-333
Cash flow
-5.0%
Cash-on-Cash Return
5.1%
Cap rate
0.8%
Rent to Value Ratio
Active
$263,000
2
bds
|
2
ba
|
1,270
sqft
|
built
1995
1373 Grayshire Ct, Elgin, IL 60120
$-444
Cash flow
-8.8%
Cash-on-Cash Return
4.2%
Cap rate
0.9%
Rent to Value Ratio
Active
$435,000
3
bds
|
4
ba
|
0
sqft
|
built
3467 Gallant Fox Dr, Elgin, IL 60124
$-1,319
Cash flow
-15.8%
Cash-on-Cash Return
2.6%
Cap rate
0.7%
Rent to Value Ratio

Active
$415,000
3
bds
|
3
ba
|
2,326
sqft
|
built
2007
1111 Pine Valley Ct, Elgin, IL 60124
$-936
Cash flow
-11.8%
Cash-on-Cash Return
3.6%
Cap rate
0.8%
Rent to Value Ratio
Active
$564,990
4
bds
|
3
ba
|
3,368
sqft
|
built
2017
3667 Thornhill Dr, Elgin, IL 60124
$-1,293
Cash flow
-11.9%
Cash-on-Cash Return
3.5%
Cap rate
0.7%
Rent to Value Ratio

Active
$340,000
3
bds
|
2
ba
|
1,415
sqft
|
built
1956
938 Hillcrest Rd, Elgin, IL 60123
$-634
Cash flow
-9.7%
Cash-on-Cash Return
4.0%
Cap rate
0.8%
Rent to Value Ratio
Active
$599,900
5
bds
|
3
ba
|
3,200
sqft
|
built
2007
1179 Shawford Way Dr, Elgin, IL 60120
$-1,481
Cash flow
-12.9%
Cash-on-Cash Return
3.3%
Cap rate
0.6%
Rent to Value Ratio
Active
$489,999
4
bds
|
3
ba
|
2,612
sqft
|
built
2005
610 Erin Dr, Elgin, IL 60124
$-1,393
Cash flow
-14.8%
Cash-on-Cash Return
2.9%
Cap rate
0.7%
Rent to Value Ratio