Englewood, FL Investment Properties for Sale
Browse homes for sale and investment properties in Englewood, FL. Refine your search by price, property type, or more.
Best cash flowing properties in Englewood, FL
Active
$285,000
4
bds
|
2
ba
|
1,728
sqft
|
built
1979
10419 Kidron Ave, Englewood, FL 34224
$-753
Cash flow
-13.8%
Cash-on-Cash Return
3.0%
Cap rate
0.6%
Rent to Value Ratio

Active
$399,500
4
bds
|
4
ba
|
2,125
sqft
|
built
1981
680 Harvey St, Englewood, FL 34223
$-1,074
Cash flow
-14.0%
Cash-on-Cash Return
2.9%
Cap rate
0.5%
Rent to Value Ratio
11 out of 19 properties for sale in Englewood, FL
Limited Results Shown
Create a free account, or log in to reveal all property listings and enjoy the complete experience.

Active
$750,000
2
bds
|
4
ba
|
1,617
sqft
|
built
1956
1765 Manor Rd, Englewood, FL 34223
$-3,236
Cash flow
-22.5%
Cash-on-Cash Return
1.0%
Cap rate
0.3%
Rent to Value Ratio
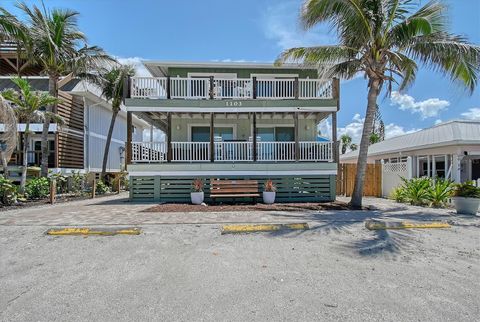
Active
$1,250,000
4
bds
|
2
ba
|
1,664
sqft
|
built
1978
1103 Shore View Dr, Englewood, FL 34223
$-6,060
Cash flow
-25.3%
Cash-on-Cash Return
0.3%
Cap rate
0.1%
Rent to Value Ratio
Active
$1,149,000
2
bds
|
0
ba
|
4,146
sqft
|
built
1946
115 Friendship Ln, Englewood, FL 34223
$-5,863
Cash flow
-26.6%
Cash-on-Cash Return
0.0%
Cap rate
0.2%
Rent to Value Ratio

Active
$1,260,000
6
bds
|
4
ba
|
3,072
sqft
|
built
1974
7035 Placida Rd, Englewood, FL 34224
$-5,818
Cash flow
-24.1%
Cash-on-Cash Return
0.6%
Cap rate
0.2%
Rent to Value Ratio
Active
$399,000
5
bds
|
4
ba
|
2,340
sqft
|
built
1984
1665 Florence Ave, Englewood, FL 34223
$-1,122
Cash flow
-14.7%
Cash-on-Cash Return
2.8%
Cap rate
0.6%
Rent to Value Ratio

Active
$675,000
4
bds
|
3
ba
|
2,165
sqft
|
built
1972
1350 Holiday Dr, Englewood, FL 34223
$-2,592
Cash flow
-20.0%
Cash-on-Cash Return
1.5%
Cap rate
0.4%
Rent to Value Ratio

Active
$1,100,000
9
bds
|
7
ba
|
2,304
sqft
|
built
1972
7500 Beckers Ln, Englewood, FL 34224
$-4,719
Cash flow
-22.4%
Cash-on-Cash Return
1.0%
Cap rate
0.2%
Rent to Value Ratio

Active
$1,200,000
5
bds
|
6
ba
|
2,943
sqft
|
built
1956
1288 Shore View Dr, Englewood, FL 34223
$-5,231
Cash flow
-22.7%
Cash-on-Cash Return
0.9%
Cap rate
0.3%
Rent to Value Ratio
Active
$1,000,000
bds
|
0
ba
|
2,526
sqft
|
built
1958
1080 Gulf Blvd, Englewood, FL 34223
$-3,656
Cash flow
-19.1%
Cash-on-Cash Return
1.8%
Cap rate
0.4%
Rent to Value Ratio