Evanston, IL Investment Properties for Sale
Browse homes for sale and investment properties in Evanston, IL. Refine your search by price, property type, or more.
Best cash flowing properties in Evanston, IL
Active
$150,000
2
bds
|
1
ba
|
750
sqft
|
built
1949
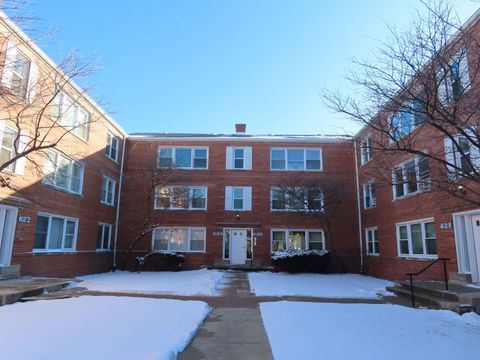
626 Oakton St, Evanston, IL 60202
$-63
Cash flow
-2.2%
Cash-on-Cash Return
5.2%
Cap rate
1.2%
Rent to Value Ratio
Active
$249,500
1
bds
|
1
ba
|
1,000
sqft
|
built
1927
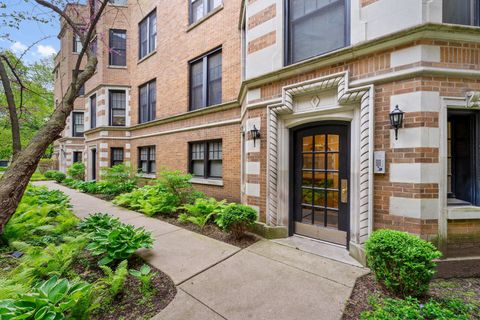
602 Sheridan Rd, Evanston, IL 60202
$-138
Cash flow
-2.9%
Cash-on-Cash Return
5.0%
Cap rate
0.9%
Rent to Value Ratio
25 out of 26 properties for sale in Evanston, IL
Limited Results Shown
Create a free account, or log in to reveal all property listings and enjoy the complete experience.

Active
$289,900
1
bds
|
1
ba
|
730
sqft
|
built
2001
1572 Maple Ave, Evanston, IL 60201
$-574
Cash flow
-10.3%
Cash-on-Cash Return
3.3%
Cap rate
0.8%
Rent to Value Ratio

Active
$320,000
2
bds
|
2
ba
|
1,400
sqft
|
built
1978
9201 Drake Ave, Evanston, IL 60203
$-530
Cash flow
-8.6%
Cash-on-Cash Return
3.7%
Cap rate
0.9%
Rent to Value Ratio

Active under contract
$699,000
2
bds
|
2
ba
|
1,700
sqft
|
built
1904
1629 Hinman Ave, Evanston, IL 60201
$-2,268
Cash flow
-16.9%
Cash-on-Cash Return
1.8%
Cap rate
0.6%
Rent to Value Ratio

Active under contract
$185,000
2
bds
|
1
ba
|
0
sqft
|
built
1955
336 Ridge Ave, Evanston, IL 60202
$-255
Cash flow
-7.2%
Cash-on-Cash Return
4.0%
Cap rate
1.1%
Rent to Value Ratio

Active under contract
$849,000
4
bds
|
3
ba
|
0
sqft
|
built
2008
2642 Prairie Ave, Evanston, IL 60201
$-2,836
Cash flow
-17.4%
Cash-on-Cash Return
1.7%
Cap rate
0.5%
Rent to Value Ratio

Active
$269,900
1
bds
|
1
ba
|
793
sqft
|
built
2006
1720 Oak Ave, Evanston, IL 60201
$-615
Cash flow
-11.9%
Cash-on-Cash Return
2.9%
Cap rate
0.8%
Rent to Value Ratio

Active
$276,500
2
bds
|
1
ba
|
1,000
sqft
|
built
1955
1412 Hinman Ave, Evanston, IL 60201
$-620
Cash flow
-11.7%
Cash-on-Cash Return
3.0%
Cap rate
0.8%
Rent to Value Ratio

Active
$199,750
2
bds
|
1
ba
|
800
sqft
|
built
1940
524 Michigan Ave, Evanston, IL 60202
$-259
Cash flow
-6.8%
Cash-on-Cash Return
4.1%
Cap rate
1.0%
Rent to Value Ratio

Active
$1,899,995
3
bds
|
4
ba
|
0
sqft
|
built
2002
1720 Maple Ave, Evanston, IL 60201
$-12,837
Cash flow
-35.3%
Cash-on-Cash Return
-2.4%
Cap rate
0.5%
Rent to Value Ratio

Active under contract
$570,000
3
bds
|
2
ba
|
1,997
sqft
|
built
1912
425 Greenwood St, Evanston, IL 60201
$-1,462
Cash flow
-13.4%
Cash-on-Cash Return
2.6%
Cap rate
0.6%
Rent to Value Ratio

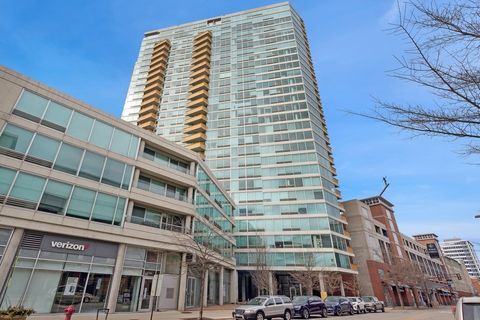
Active
$525,000
2
bds
|
2
ba
|
0
sqft
|
built
2009
1570 Elmwood Ave, Evanston, IL 60201
$-1,495
Cash flow
-14.9%
Cash-on-Cash Return
2.3%
Cap rate
0.7%
Rent to Value Ratio

Active
$550,000
4
bds
|
2
ba
|
1,516
sqft
|
built
1910
502 Lee St, Evanston, IL 60202
$-1,754
Cash flow
-16.6%
Cash-on-Cash Return
1.9%
Cap rate
0.6%
Rent to Value Ratio

Active under contract
$328,000
1
bds
|
1
ba
|
831
sqft
|
built
2002
1640 Maple Ave, Evanston, IL 60201
$-925
Cash flow
-14.7%
Cash-on-Cash Return
2.3%
Cap rate
0.7%
Rent to Value Ratio

Active under contract
$290,000
1
bds
|
1
ba
|
830
sqft
|
built
2003
1210 Chicago Ave, Evanston, IL 60202
$-505
Cash flow
-9.1%
Cash-on-Cash Return
3.6%
Cap rate
0.9%
Rent to Value Ratio
Active
$249,500
1
bds
|
1
ba
|
1,000
sqft
|
built
1927
602 Sheridan Rd, Evanston, IL 60202
$-138
Cash flow
-2.9%
Cash-on-Cash Return
5.0%
Cap rate
0.9%
Rent to Value Ratio

Active under contract
$359,000
1
bds
|
1
ba
|
820
sqft
|
built
2002
1640 Maple Ave, Evanston, IL 60201
$-1,141
Cash flow
-16.6%
Cash-on-Cash Return
1.9%
Cap rate
0.6%
Rent to Value Ratio

Active
$358,000
1
bds
|
1
ba
|
700
sqft
|
built
2003
1720 Maple Ave, Evanston, IL 60201
$-868
Cash flow
-12.6%
Cash-on-Cash Return
2.8%
Cap rate
0.7%
Rent to Value Ratio

Active under contract
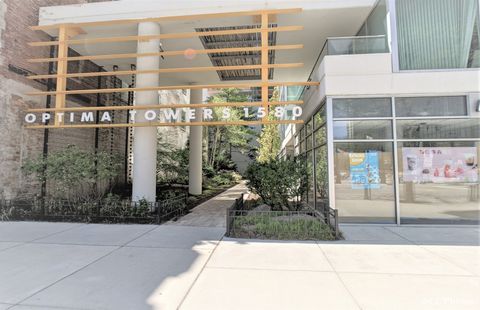
$455,000
2
bds
|
2
ba
|
1,300
sqft
|
built
2000
1580 Sherman Ave, Evanston, IL 60201
$-1,487
Cash flow
-17.1%
Cash-on-Cash Return
1.8%
Cap rate
0.6%
Rent to Value Ratio
Active
$399,900
2
bds
|
2
ba
|
1,227
sqft
|
built
2002
1580 Sherman Ave, Evanston, IL 60201
$-1,058
Cash flow
-13.8%
Cash-on-Cash Return
2.5%
Cap rate
0.7%
Rent to Value Ratio
Active under contract
$410,000
2
bds
|
2
ba
|
1,323
sqft
|
built
2004
1720 Maple Ave, Evanston, IL 60201
$-1,150
Cash flow
-14.6%
Cash-on-Cash Return
2.3%
Cap rate
0.9%
Rent to Value Ratio
Active
$430,800
2
bds
|
2
ba
|
1,384
sqft
|
built
2000
1720 Maple Ave, Evanston, IL 60201
$-1,110
Cash flow
-13.4%
Cash-on-Cash Return
2.6%
Cap rate
0.8%
Rent to Value Ratio

Active
$469,000
2
bds
|
2
ba
|
1,035
sqft
|
built
2003
1720 Maple Ave, Evanston, IL 60201
$-1,741
Cash flow
-19.4%
Cash-on-Cash Return
1.2%
Cap rate
0.7%
Rent to Value Ratio
Active
$389,900
3
bds
|
2
ba
|
1,350
sqft
|
built
1907
936 Hinman Ave, Evanston, IL 60202
$-863
Cash flow
-11.5%
Cash-on-Cash Return
3.0%
Cap rate
0.8%
Rent to Value Ratio

Active
$595,500
2
bds
|
2
ba
|
1,356
sqft
|
built
2003
807 Davis St, Evanston, IL 60201
$-2,359
Cash flow
-20.7%
Cash-on-Cash Return
0.9%
Cap rate
0.6%
Rent to Value Ratio
Active
$150,000
2
bds
|
1
ba
|
750
sqft
|
built
1949
626 Oakton St, Evanston, IL 60202
$-63
Cash flow
-2.2%
Cash-on-Cash Return
5.2%
Cap rate
1.2%
Rent to Value Ratio