Marion County Investment Properties for Sale
Browse homes for sale and investment properties in Marion County. Refine your search by price, property type, or more.
Best cash flowing properties in Marion County
Active
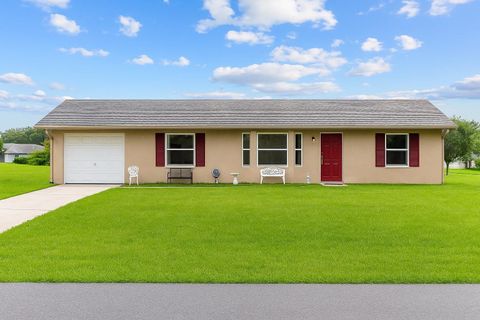
$220,000
3
bds
|
2
ba
|
1,161
sqft
|
built
1985
8 Dogwood Trail Pass, Ocala, FL 34472
$-48
Cash flow
-1.1%
Cash-on-Cash Return
5.9%
Cap rate
0.8%
Rent to Value Ratio
Active
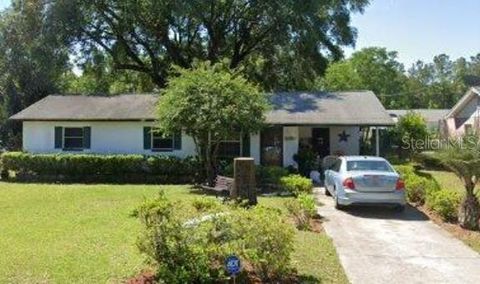
$175,000
3
bds
|
1
ba
|
960
sqft
|
built
1969
2114 SW 7th St, Ocala, FL 34471
$-60
Cash flow
-1.8%
Cash-on-Cash Return
5.7%
Cap rate
0.8%
Rent to Value Ratio
1,171 out of 1,544 properties for sale in Marion County
Limited Results Shown
Create a free account, or log in to reveal all property listings and enjoy the complete experience.
Active
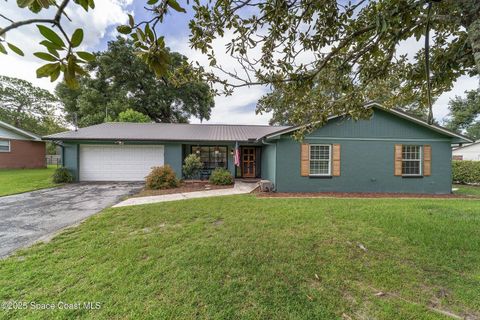
$325,000
4
bds
|
2
ba
|
2,089
sqft
|
built
1972
4015 SE 15th St, Ocala, FL 34471
$-442
Cash flow
-7.1%
Cash-on-Cash Return
4.5%
Cap rate
0.7%
Rent to Value Ratio
Active
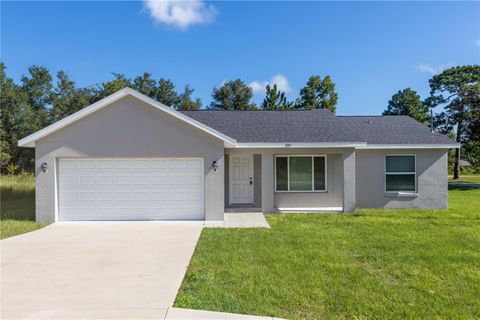
$259,000
3
bds
|
2
ba
|
1,319
sqft
|
built
2024
297 Malauka Run, Ocklawaha, FL 32179
$-186
Cash flow
-3.7%
Cash-on-Cash Return
5.3%
Cap rate
0.7%
Rent to Value Ratio

Active
$289,999
4
bds
|
2
ba
|
1,752
sqft
|
built
2023
6 Malauka Radial Ln, Ocklawaha, FL 32179
$-556
Cash flow
-10.0%
Cash-on-Cash Return
3.8%
Cap rate
0.6%
Rent to Value Ratio
Active
$199,900
3
bds
|
1
ba
|
984
sqft
|
built
1988
3793 SE 67th Pl, Ocala, FL 34480
$-85
Cash flow
-2.2%
Cash-on-Cash Return
5.6%
Cap rate
0.8%
Rent to Value Ratio

Active
$414,900
4
bds
|
2
ba
|
2,307
sqft
|
built
2015
4451 SW 62nd Loop, Ocala, FL 34474
$-808
Cash flow
-10.2%
Cash-on-Cash Return
3.8%
Cap rate
0.6%
Rent to Value Ratio
Active
$250,000
3
bds
|
2
ba
|
1,603
sqft
|
built
2007
13802 SW 48th Ct, Ocala, FL 34473
$-341
Cash flow
-7.1%
Cash-on-Cash Return
4.5%
Cap rate
0.6%
Rent to Value Ratio

Active
$229,900
4
bds
|
2
ba
|
1,680
sqft
|
built
1976
2904 NE 25th Ct, Ocala, FL 34479
$-96
Cash flow
-2.2%
Cash-on-Cash Return
5.6%
Cap rate
0.8%
Rent to Value Ratio

Active
$219,900
3
bds
|
2
ba
|
1,092
sqft
|
built
1983
2890 NE 43rd Pl, Ocala, FL 34479
$-279
Cash flow
-6.6%
Cash-on-Cash Return
4.6%
Cap rate
0.6%
Rent to Value Ratio
Active
$510,000
3
bds
|
2
ba
|
2,542
sqft
|
built
1992
9240 SW 212th Ct, Dunnellon, FL 34431
$-1,427
Cash flow
-14.6%
Cash-on-Cash Return
2.8%
Cap rate
0.5%
Rent to Value Ratio
Active
$925,000
4
bds
|
3
ba
|
1,704
sqft
|
built
1999
18975 W Highway 328, Dunnellon, FL 34432
$-3,767
Cash flow
-21.2%
Cash-on-Cash Return
1.3%
Cap rate
0.2%
Rent to Value Ratio
Active
$525,000
4
bds
|
2
ba
|
2,526
sqft
|
built
2002
999 NE 120th Pl, Ocala, FL 34479
$-796
Cash flow
-7.9%
Cash-on-Cash Return
4.3%
Cap rate
0.6%
Rent to Value Ratio

Active
$244,900
3
bds
|
2
ba
|
1,239
sqft
|
built
2023
2956 SE 145th Pl, Summerfield, FL 34491
$-274
Cash flow
-5.8%
Cash-on-Cash Return
4.8%
Cap rate
0.7%
Rent to Value Ratio
Active
$265,000
3
bds
|
2
ba
|
1,695
sqft
|
built
1995
2801 SW 167th Ln, Ocala, FL 34473
$-427
Cash flow
-8.4%
Cash-on-Cash Return
4.2%
Cap rate
0.7%
Rent to Value Ratio
Active
$329,000
3
bds
|
2
ba
|
2,027
sqft
|
built
1999
8859 SW 196th Avenue Rd, Dunnellon, FL 34432
$-517
Cash flow
-8.2%
Cash-on-Cash Return
4.3%
Cap rate
0.6%
Rent to Value Ratio
Active
$729,000
3
bds
|
2
ba
|
2,112
sqft
|
built
2021
8669 SE 71st Ct, Ocala, FL 34472
$-2,602
Cash flow
-18.6%
Cash-on-Cash Return
1.9%
Cap rate
0.3%
Rent to Value Ratio
Active
$679,000
3
bds
|
2
ba
|
2,653
sqft
|
built
2023
8715 NW 18th Cir, Ocala, FL 34475
$-2,120
Cash flow
-16.3%
Cash-on-Cash Return
2.4%
Cap rate
0.4%
Rent to Value Ratio
Active
$330,000
4
bds
|
2
ba
|
1,848
sqft
|
built
2021
767 NW 66th Pl, Ocala, FL 34475
$-548
Cash flow
-8.7%
Cash-on-Cash Return
4.2%
Cap rate
0.6%
Rent to Value Ratio
Active
$204,500
2
bds
|
1
ba
|
884
sqft
|
built
1973
13332 SE 40th Ave, Belleview, FL 34420
$-215
Cash flow
-5.5%
Cash-on-Cash Return
4.9%
Cap rate
0.6%
Rent to Value Ratio
Active
$629,000
3
bds
|
2
ba
|
1,791
sqft
|
built
2006
35 Lake Wood Cir, Ocala, FL 34482
$-1,326
Cash flow
-11.0%
Cash-on-Cash Return
3.6%
Cap rate
0.5%
Rent to Value Ratio
Active
$335,000
3
bds
|
2
ba
|
1,770
sqft
|
built
2003
7846 SW 103rd Loop, Ocala, FL 34476
$-481
Cash flow
-7.5%
Cash-on-Cash Return
4.4%
Cap rate
0.6%
Rent to Value Ratio

Active
$269,900
3
bds
|
2
ba
|
1,983
sqft
|
built
1967
4000 SW 6th Ave, Ocala, FL 34471
$-258
Cash flow
-5.0%
Cash-on-Cash Return
5.0%
Cap rate
0.7%
Rent to Value Ratio
Active
$369,999
3
bds
|
2
ba
|
1,750
sqft
|
built
1979
410 SE 41st Ave, Ocala, FL 34471
$-678
Cash flow
-9.6%
Cash-on-Cash Return
3.9%
Cap rate
0.5%
Rent to Value Ratio
Active
$275,000
3
bds
|
2
ba
|
1,871
sqft
|
built
2002
13538 SW 47th Cir, Ocala, FL 34473
$-283
Cash flow
-5.4%
Cash-on-Cash Return
4.9%
Cap rate
0.7%
Rent to Value Ratio

Active
$199,900
2
bds
|
2
ba
|
1,238
sqft
|
built
1981
8160 SW 202nd Ave, Dunnellon, FL 34431
$-138
Cash flow
-3.6%
Cash-on-Cash Return
5.3%
Cap rate
0.7%
Rent to Value Ratio

Active
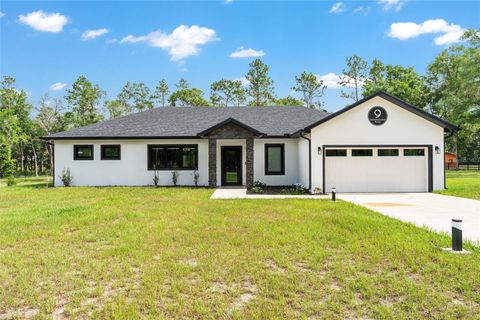
$279,000
3
bds
|
2
ba
|
1,398
sqft
|
built
2023
9 Dogwood Trail Ct, Ocala, FL 34472
$-461
Cash flow
-8.6%
Cash-on-Cash Return
4.2%
Cap rate
0.6%
Rent to Value Ratio
Active
$269,900
3
bds
|
2
ba
|
1,259
sqft
|
built
2022
4868 SW 131st Pl, Ocala, FL 34473
$-418
Cash flow
-8.1%
Cash-on-Cash Return
4.3%
Cap rate
0.7%
Rent to Value Ratio
Active
$950,000
4
bds
|
2
ba
|
1,880
sqft
|
built
2023
9 Middleground Rd, Ocala, FL 34482
$-3,507
Cash flow
-19.3%
Cash-on-Cash Return
1.7%
Cap rate
0.3%
Rent to Value Ratio
Active
$299,900
4
bds
|
2
ba
|
1,477
sqft
|
built
2023
12840 SW 60th Ct, Ocala, FL 34473
$-593
Cash flow
-10.3%
Cash-on-Cash Return
3.8%
Cap rate
0.6%
Rent to Value Ratio
Active
$285,000
2
bds
|
1
ba
|
1,022
sqft
|
built
1999
4645 NE 159th Pl, Citra, FL 32113
$-450
Cash flow
-8.2%
Cash-on-Cash Return
4.3%
Cap rate
0.6%
Rent to Value Ratio

Active
$214,900
3
bds
|
2
ba
|
1,381
sqft
|
built
2007
14 Water Trak, Ocala, FL 34472
$-248
Cash flow
-6.0%
Cash-on-Cash Return
4.8%
Cap rate
0.7%
Rent to Value Ratio

Active
$315,000
3
bds
|
2
ba
|
1,566
sqft
|
built
2023
4229 SW 169th Lane Rd, Ocala, FL 34473
$-683
Cash flow
-11.3%
Cash-on-Cash Return
3.5%
Cap rate
0.6%
Rent to Value Ratio

Active
$435,000
3
bds
|
4
ba
|
2,613
sqft
|
built
1917
615 SE 8th St, Ocala, FL 34471
$-1,538
Cash flow
-18.4%
Cash-on-Cash Return
1.9%
Cap rate
0.4%
Rent to Value Ratio

Active
$389,900
4
bds
|
3
ba
|
2,109
sqft
|
built
2006
12160 SE 100th Ct, Belleview, FL 34420
$-619
Cash flow
-8.3%
Cash-on-Cash Return
4.2%
Cap rate
0.6%
Rent to Value Ratio
Active
$240,000
3
bds
|
2
ba
|
1,047
sqft
|
built
2023
228 Locust Pass Ln, Ocala, FL 34472
$-333
Cash flow
-7.2%
Cash-on-Cash Return
4.5%
Cap rate
0.7%
Rent to Value Ratio

Active
$350,000
4
bds
|
3
ba
|
2,313
sqft
|
built
2021
5022 SW 90th Pl, Ocala, FL 34476
$-440
Cash flow
-6.6%
Cash-on-Cash Return
4.6%
Cap rate
0.7%
Rent to Value Ratio
Active
$279,700
3
bds
|
2
ba
|
1,672
sqft
|
built
1989
347 Oak Lane Dr, Ocala, FL 34472
$-649
Cash flow
-12.1%
Cash-on-Cash Return
3.4%
Cap rate
0.6%
Rent to Value Ratio
Active
$2,495,000
3
bds
|
4
ba
|
2,690
sqft
|
built
2022
2755 NW 80th Ave, Ocala, FL 34482
$-11,164
Cash flow
-23.3%
Cash-on-Cash Return
0.8%
Cap rate
0.2%
Rent to Value Ratio
Active
$535,000
3
bds
|
2
ba
|
2,356
sqft
|
built
2021
16442 SE 88th Ct, Summerfield, FL 34491
$-1,095
Cash flow
-10.7%
Cash-on-Cash Return
3.7%
Cap rate
0.6%
Rent to Value Ratio