Marion County Investment Properties for Sale
Browse homes for sale and investment properties in Marion County. Refine your search by price, property type, or more.
Best cash flowing properties in Marion County
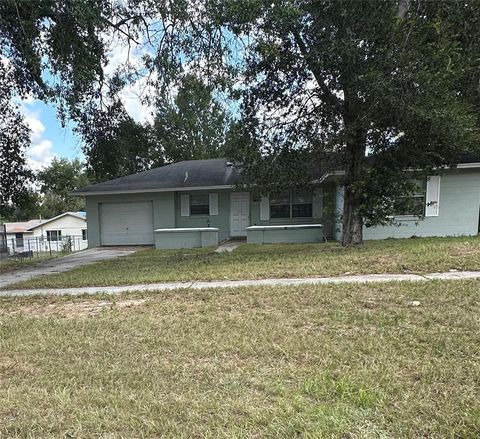
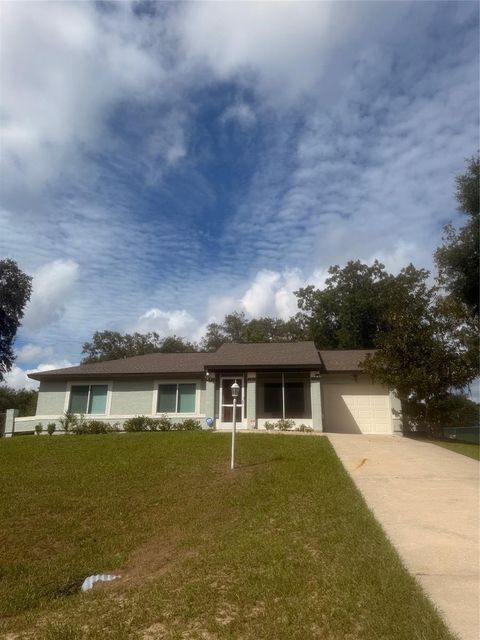
Active
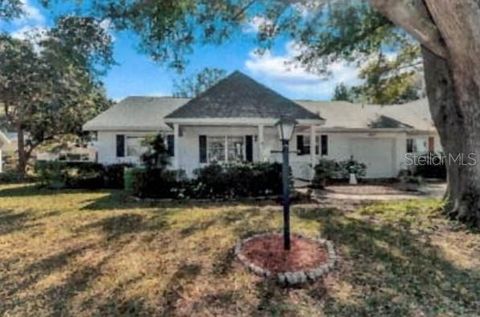
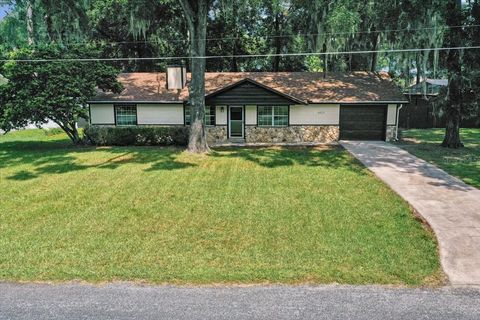
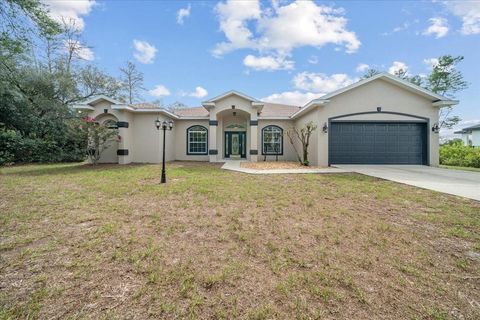
$142,500
2
bds
|
2
ba
|
1,121
sqft
|
built
1979
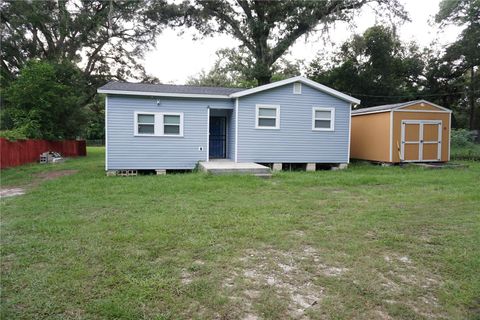
223 Marion Oaks Ln, Ocala, FL 34473
$184
Cash flow
6.7%
Cash-on-Cash Return
7.7%
Cap rate
1.1%
Rent to Value Ratio
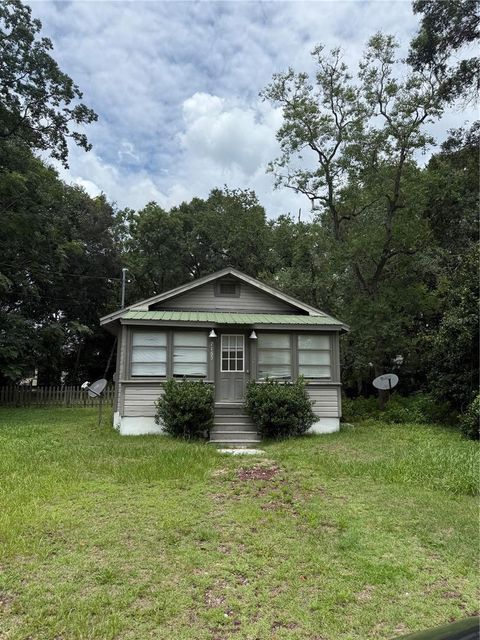
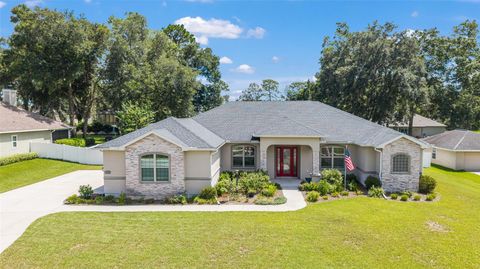
Active
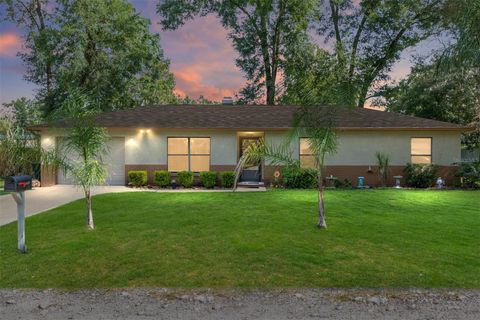
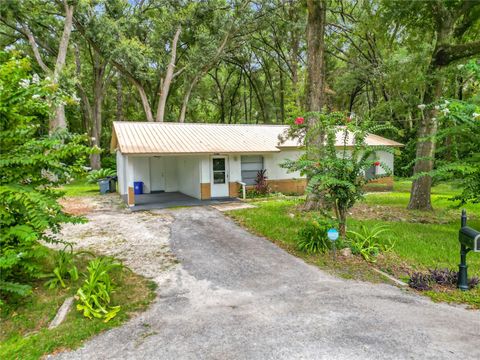
$114,900
1
bds
|
1
ba
|
620
sqft
|
built
1990
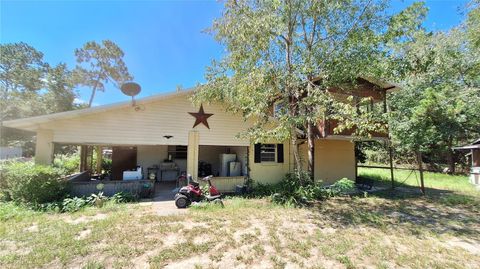
7165 SE 123rd Pl, Belleview, FL 34420
$10
Cash flow
0.5%
Cash-on-Cash Return
6.3%
Cap rate
0.9%
Rent to Value Ratio
679 out of 913 properties for sale in Marion County
Limited Results Shown
Create a free account, or log in to reveal all property listings and enjoy the complete experience.
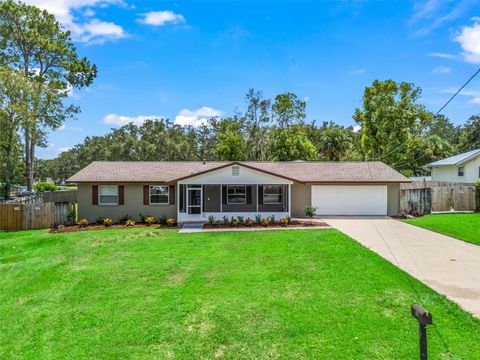
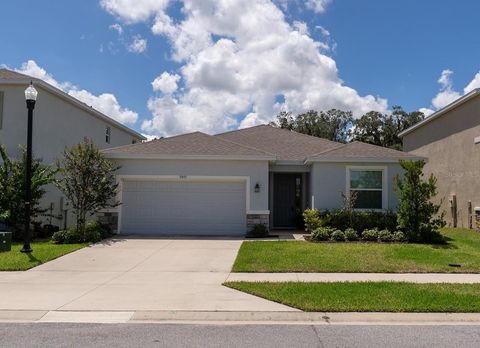
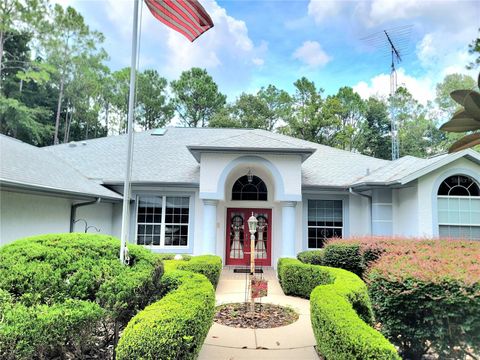
Active
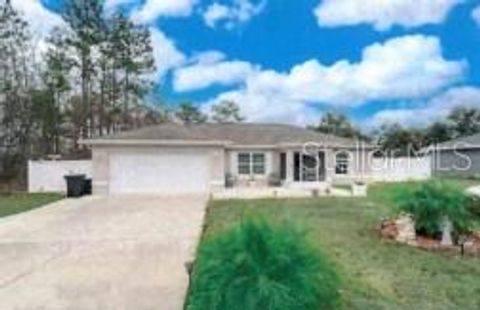
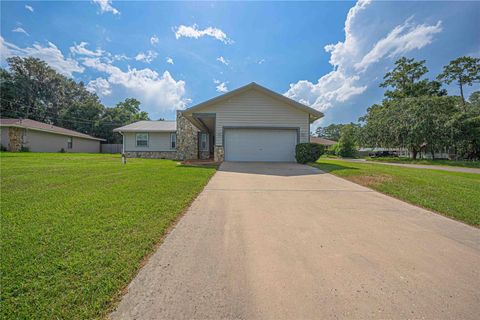
$364,900
3
bds
|
2
ba
|
1,456
sqft
|
built
1967
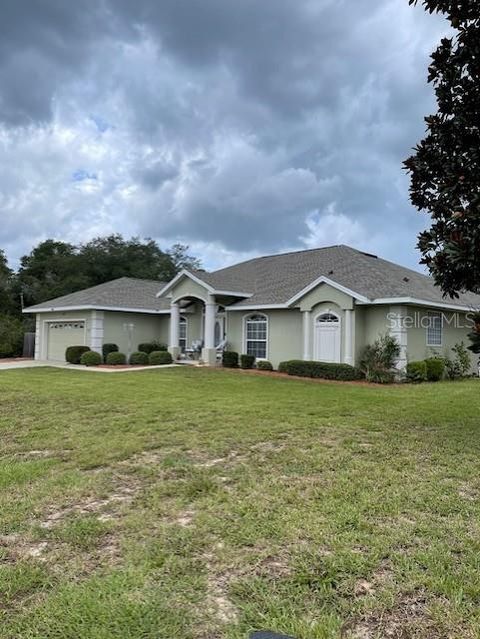
652 SE 18th St, Ocala, FL 34471
$-742
Cash flow
-10.6%
Cash-on-Cash Return
3.7%
Cap rate
0.5%
Rent to Value Ratio
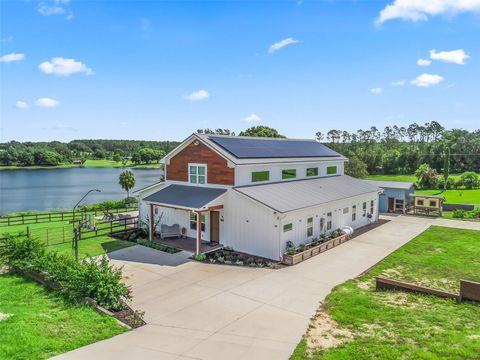
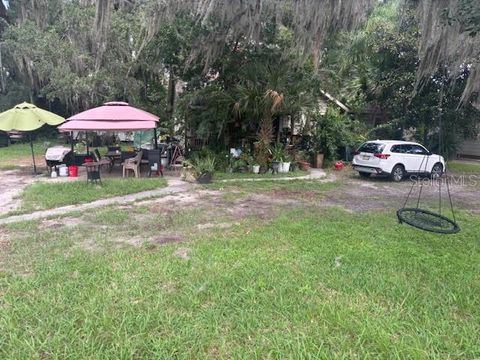
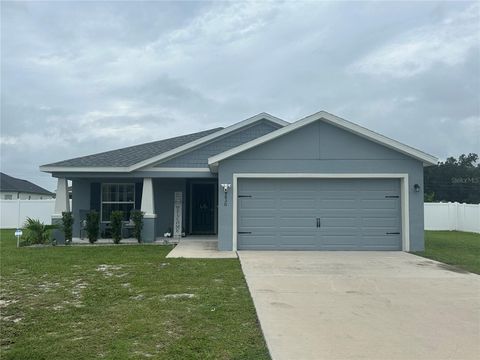
Active
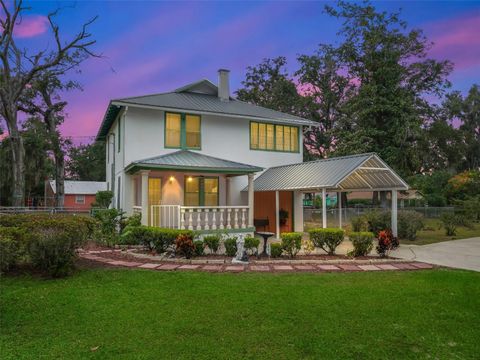
$1,300,000
4
bds
|
4
ba
|
3,039
sqft
|
built
2019
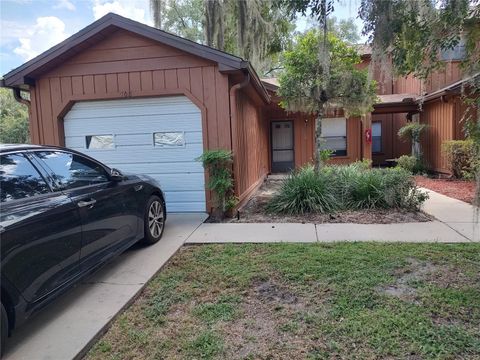
16795 SE Highway 42, Weirsdale, FL 32195
$-4,613
Cash flow
-18.5%
Cash-on-Cash Return
1.9%
Cap rate
0.3%
Rent to Value Ratio
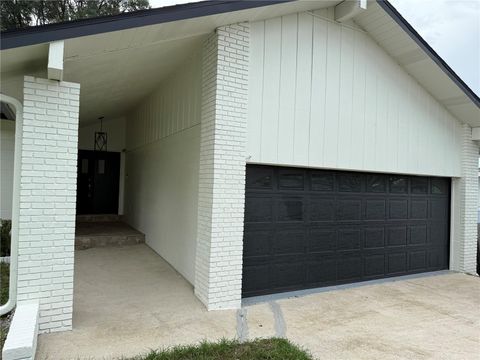
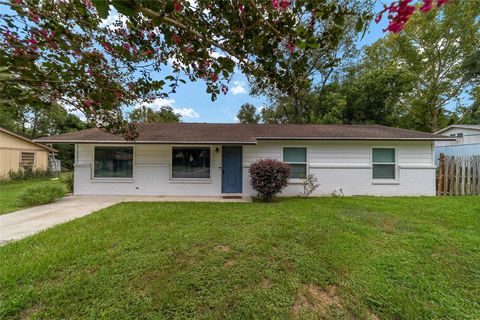
Active
$425,000
4
bds
|
2
ba
|
2,327
sqft
|
built
1989
16555 N Highway 329, Reddick, FL 32686
$-732
Cash flow
-9.0%
Cash-on-Cash Return
4.1%
Cap rate
0.5%
Rent to Value Ratio
Active
$245,000
3
bds
|
2
ba
|
1,143
sqft
|
built
1984
6415 NW 61st Ave, Ocala, FL 34482
$-434
Cash flow
-9.2%
Cash-on-Cash Return
4.0%
Cap rate
0.6%
Rent to Value Ratio
Active
$239,900
3
bds
|
2
ba
|
1,536
sqft
|
built
1977
9312 Bahia Rd, Ocala, FL 34472
$-557
Cash flow
-12.1%
Cash-on-Cash Return
3.4%
Cap rate
0.6%
Rent to Value Ratio
Active
$260,000
2
bds
|
2
ba
|
1,080
sqft
|
built
1974
5989 SE 159th Ct, Ocklawaha, FL 32179
$-268
Cash flow
-5.4%
Cash-on-Cash Return
4.9%
Cap rate
0.7%
Rent to Value Ratio
Active
$162,900
2
bds
|
2
ba
|
812
sqft
|
built
1958
5330 SE 30th Ave, Ocala, FL 34480
$-124
Cash flow
-4.0%
Cash-on-Cash Return
5.2%
Cap rate
0.7%
Rent to Value Ratio
Active
$315,000
5
bds
|
3
ba
|
2,497
sqft
|
built
1983
13160 NE 1st Street Rd, Silver Springs, FL 34488
$-669
Cash flow
-11.1%
Cash-on-Cash Return
3.6%
Cap rate
0.6%
Rent to Value Ratio
Active
$499,000
4
bds
|
3
ba
|
2,530
sqft
|
built
2004
4493 SW 102nd Lane Rd, Ocala, FL 34476
$-992
Cash flow
-10.4%
Cash-on-Cash Return
3.8%
Cap rate
0.5%
Rent to Value Ratio
Active
$128,000
2
bds
|
2
ba
|
924
sqft
|
built
1987
2701 NE 10th St, Ocala, FL 34470
$-278
Cash flow
-11.3%
Cash-on-Cash Return
3.5%
Cap rate
1.0%
Rent to Value Ratio
Active
$1,290,000
2
bds
|
3
ba
|
2,108
sqft
|
built
2023
21679 SW 106th Lane Rd, Dunnellon, FL 34431
$-5,264
Cash flow
-21.3%
Cash-on-Cash Return
1.3%
Cap rate
0.2%
Rent to Value Ratio
Active
$379,500
3
bds
|
2
ba
|
2,046
sqft
|
built
1974
3561 SE 30th Ter, Ocala, FL 34471
$-598
Cash flow
-8.2%
Cash-on-Cash Return
4.3%
Cap rate
0.6%
Rent to Value Ratio
Active
$290,000
3
bds
|
2
ba
|
1,686
sqft
|
built
1997
6060 SE 5th Pl, Ocala, FL 34472
$-538
Cash flow
-9.7%
Cash-on-Cash Return
3.9%
Cap rate
0.6%
Rent to Value Ratio
Active
$360,000
4
bds
|
2
ba
|
2,332
sqft
|
built
2008
3967 SE 99th St, Belleview, FL 34420
$-464
Cash flow
-6.7%
Cash-on-Cash Return
4.6%
Cap rate
0.7%
Rent to Value Ratio
Active
$173,000
2
bds
|
2
ba
|
1,530
sqft
|
built
1992
8862 SW 92nd St, Ocala, FL 34481
$-189
Cash flow
-5.7%
Cash-on-Cash Return
4.8%
Cap rate
1.0%
Rent to Value Ratio
Active
$199,999
3
bds
|
2
ba
|
1,184
sqft
|
built
1981
5701 SE 4th Pl, Ocala, FL 34480
$-124
Cash flow
-3.2%
Cash-on-Cash Return
5.4%
Cap rate
0.8%
Rent to Value Ratio
Active
$350,000
3
bds
|
2
ba
|
1,352
sqft
|
built
2021
3 Pecan Drive Loop, Ocala, FL 34472
$-481
Cash flow
-7.2%
Cash-on-Cash Return
4.5%
Cap rate
0.6%
Rent to Value Ratio
Active
$240,000
4
bds
|
2
ba
|
1,188
sqft
|
built
1943
712 SW 10th Ave, Ocala, FL 34471
$-157
Cash flow
-3.4%
Cash-on-Cash Return
5.4%
Cap rate
0.8%
Rent to Value Ratio
Active
$299,900
2
bds
|
3
ba
|
1,360
sqft
|
built
1988
814 Oak Rd, Ocala, FL 34472
$-380
Cash flow
-6.6%
Cash-on-Cash Return
4.6%
Cap rate
0.6%
Rent to Value Ratio
Active
$625,000
4
bds
|
3
ba
|
2,642
sqft
|
built
2017
4530 SE 33rd Pl, Ocala, FL 34480
$-1,747
Cash flow
-14.6%
Cash-on-Cash Return
2.8%
Cap rate
0.5%
Rent to Value Ratio
Active
$359,900
4
bds
|
3
ba
|
2,053
sqft
|
built
2023
5445 SW 44th Court Rd, Ocala, FL 34474
$-959
Cash flow
-13.9%
Cash-on-Cash Return
3.0%
Cap rate
0.6%
Rent to Value Ratio
Active
$320,000
3
bds
|
2
ba
|
1,686
sqft
|
built
1941
1807 E Fort King St, Ocala, FL 34471
$-630
Cash flow
-10.3%
Cash-on-Cash Return
3.8%
Cap rate
0.7%
Rent to Value Ratio
Active
$232,999
3
bds
|
2
ba
|
1,300
sqft
|
built
1983
4025 NE 29th Ct, Ocala, FL 34479
$-352
Cash flow
-7.9%
Cash-on-Cash Return
4.3%
Cap rate
0.6%
Rent to Value Ratio
Active
$533,000
3
bds
|
4
ba
|
2,230
sqft
|
built
1997
21525 SW 82nd Loop, Dunnellon, FL 34431
$-1,558
Cash flow
-15.3%
Cash-on-Cash Return
2.6%
Cap rate
0.4%
Rent to Value Ratio
Active
$305,000
3
bds
|
2
ba
|
1,541
sqft
|
built
2022
4830 SE 91st Pl, Ocala, FL 34480
$-447
Cash flow
-7.6%
Cash-on-Cash Return
4.4%
Cap rate
0.7%
Rent to Value Ratio
Active
$274,900
3
bds
|
2
ba
|
1,311
sqft
|
built
1972
616 Water Rd, Ocala, FL 34472
$-552
Cash flow
-10.5%
Cash-on-Cash Return
3.7%
Cap rate
0.6%
Rent to Value Ratio
Active
$305,000
3
bds
|
2
ba
|
0
sqft
|
built
2023
11338 Orange Rd, Ocklawaha, FL 32179
$-717
Cash flow
-12.3%
Cash-on-Cash Return
3.3%
Cap rate
0.5%
Rent to Value Ratio
Active
$215,000
3
bds
|
2
ba
|
1,341
sqft
|
built
2007
15592 SW 8th Pl, Ocala, FL 34481
$-6
Cash flow
-0.1%
Cash-on-Cash Return
6.1%
Cap rate
0.8%
Rent to Value Ratio
Active
$250,000
3
bds
|
2
ba
|
1,799
sqft
|
built
1975
479 Water Rd, Ocala, FL 34472
$-374
Cash flow
-7.8%
Cash-on-Cash Return
4.4%
Cap rate
0.7%
Rent to Value Ratio
Active
$349,900
3
bds
|
3
ba
|
2,218
sqft
|
built
2007
2731 SW 161st Loop, Ocala, FL 34473
$-336
Cash flow
-5.0%
Cash-on-Cash Return
5.0%
Cap rate
0.7%
Rent to Value Ratio
Active
$364,900
3
bds
|
3
ba
|
2,473
sqft
|
built
2001
10929 SW 39th Ct, Ocala, FL 34476
$-335
Cash flow
-4.8%
Cash-on-Cash Return
5.0%
Cap rate
0.7%
Rent to Value Ratio
Active
$210,000
3
bds
|
2
ba
|
1,014
sqft
|
built
1982
3611 NE 15th Ave, Ocala, FL 34479
$-313
Cash flow
-7.8%
Cash-on-Cash Return
4.4%
Cap rate
0.6%
Rent to Value Ratio
Active
$249,900
3
bds
|
2
ba
|
1,502
sqft
|
built
1986
4490 NE 2nd Ct, Ocala, FL 34479
$-312
Cash flow
-6.5%
Cash-on-Cash Return
4.6%
Cap rate
0.7%
Rent to Value Ratio
Active
$218,900
3
bds
|
2
ba
|
1,224
sqft
|
built
1980
14065 SE 51st Ave, Summerfield, FL 34491
$-183
Cash flow
-4.4%
Cash-on-Cash Return
5.1%
Cap rate
0.8%
Rent to Value Ratio
Active
$425,000
4
bds
|
3
ba
|
2,226
sqft
|
built
2014
4743 SW 62nd Pl, Ocala, FL 34474
$-932
Cash flow
-11.4%
Cash-on-Cash Return
3.5%
Cap rate
0.5%
Rent to Value Ratio
Active
$245,000
3
bds
|
2
ba
|
1,655
sqft
|
built
2004
30 Pecan Run Crse, Ocala, FL 34472
$-411
Cash flow
-8.8%
Cash-on-Cash Return
4.1%
Cap rate
0.7%
Rent to Value Ratio
Active
$259,900
3
bds
|
2
ba
|
1,475
sqft
|
built
1983
2635 NE 60th Ln, Ocala, FL 34479
$-184
Cash flow
-3.7%
Cash-on-Cash Return
5.3%
Cap rate
0.7%
Rent to Value Ratio
Active
$274,000
3
bds
|
2
ba
|
1,376
sqft
|
built
2023
15790 SE 98th Ter, Summerfield, FL 34491
$-339
Cash flow
-6.5%
Cash-on-Cash Return
4.7%
Cap rate
0.7%
Rent to Value Ratio